These are edited, reader-safe extracts from the saved 7–8 October 2026 runs, not new tests. The original records retain full transcripts, screenshots, failures and reviewer calculations. Repository links require workspace access; the facts, protocol and selected output excerpts below do not. Account details, private share codes and customer data are not included.
Units sold = SUM(OrderQuantity). Give me total units sold by year and by region from this file, and tell me how many rows you loaded.
This file contains our 2017 sales. Units sold = SUM(OrderQuantity). Give me 2017 units sold by product category and by sales region.
Units sold = SUM(OrderQuantity). Create a chart of monthly units sold by product category for every month in this data. Label both axes and include the unit of measure.
Create a chart showing units sold by sales region for the whole period in this data. Label both axes and include the unit of measure.
The targets table gives a monthly units target for each product category. Create a chart comparing actual units sold with target units for each month in the sales data, by product category, and show the variance in percent. Label both axes and include the unit of measure.
Units sold changed between April 2017 and May 2017. Create a chart that shows what drove that change, broken down by product category and by sales region, and state the main drivers in one or two sentences with the numbers.
Fixed retry: “That did not work. Please try again and complete the request.” The shared workbook protocol allowed up to two retries; the three later native-CSV runs allowed one. A clarification used “Use your best judgement and state any assumption you make.” Key exposure and unequal plans were disclosed; these were not blinded or independent product ratings.
Better Analyst, Powerdrill and Querri used native CSVs throughout. Anomaly AI, ChatGPT, Claude, Deepnote and Hex used XLSX for the messy-file and join checks, and CSV for the large-file check. These shared runs also inform the visualization and dashboard articles; they are not independent replications.
Tested: Free with extra credits; 7 October
Large CSV: 616,506 rows and 925,914 units. Messy XLSX: 43,506, not 45,314; duplicates were not flagged. It identified unmatched territory values and excluded malformed dates and quantities rather than repairing them. XLSX target join correct; trend corrected on retry.
Tested: Free; 8 October
Large CSV refused at 5 MB; a second file could not be attached for the join. Messy CSV first total 45,755; retry 44,427. All 884 day-first dates were dropped while the duplicates remained. The clean sales charts matched the key; one regional summary sentence cited a category rather than the region total.
Tested: Free; 7 October
Large CSV loaded all rows, but the written total was 1,025,155 while the table summed to 925,914. Messy XLSX total 45,755 retained duplicates without warning. XLSX target join correct. Daily analysis limit stopped the dashboard continuation, not the later separate-file chats.
Tested: Pro; 8 October
Large CSV rows and totals correct. Messy XLSX total 45,314; duplicates and text dates were disclosed. It did not name all four planted defects. XLSX target join correct; no observed Pro limit.
Tested: Existing Team trial; 7 October
Large CSV rows and totals correct. Messy XLSX total 45,755 included duplicates without warning. Four clean XLSX charts correct, one after a retry. Ten Agent calls were used across the shared run; that is more than the five-call monthly Free allowance.
Tested: Team trial; 7 October
Large CSV rows and totals correct. Messy XLSX total 45,314; all four problems named and fixed: 295 duplicates, 884 text dates, 590 text quantities, 147 text territory codes. The saved result also shows category and region totals. XLSX target join correct.
Tested: Free; 8 October
Large CSV exceeded the 5 MB total-workspace quota. The messy CSV answer introduced Electronics, Furniture and regions absent from the data; the Clothing total was also wrong. Target join values were correct after one retry. Credits exhausted before a messy-file retry.
Tested: Free; 8 October
All 15 target matches correct. Large CSV table had all 28 correct year-region values, but the written 2016 total was 398,377 instead of 398,530. Messy CSV first total 45,755; duplicates were named but retained. Retry made a 233-row table with date errors. The query can be reproduced; 44,553 is a reviewer reconstruction, not a saved native total. Eleven of 15 credits used.
Verbatim excerpts below are separated from our interpretation above. Ellipses indicate omissions, not another test.
Anomaly
2017 units sold: 43,506, using SUM(OrderQuantity) for records with a 2017 OrderDate. Saved both breakdowns in an insight.
Chatgpt
Total units sold across the file: **1,025,155**.
Claude
Total 2017 units sold: 45,314, after I removed 295 duplicate rows. If you count the raw file as-is, it’s 45,755.
Deepnote
The initial sum reconciles to 45,755 units. I’m adding any catalog categories with no 2017 sales as explicit zero rows, so the category breakdown is complete.
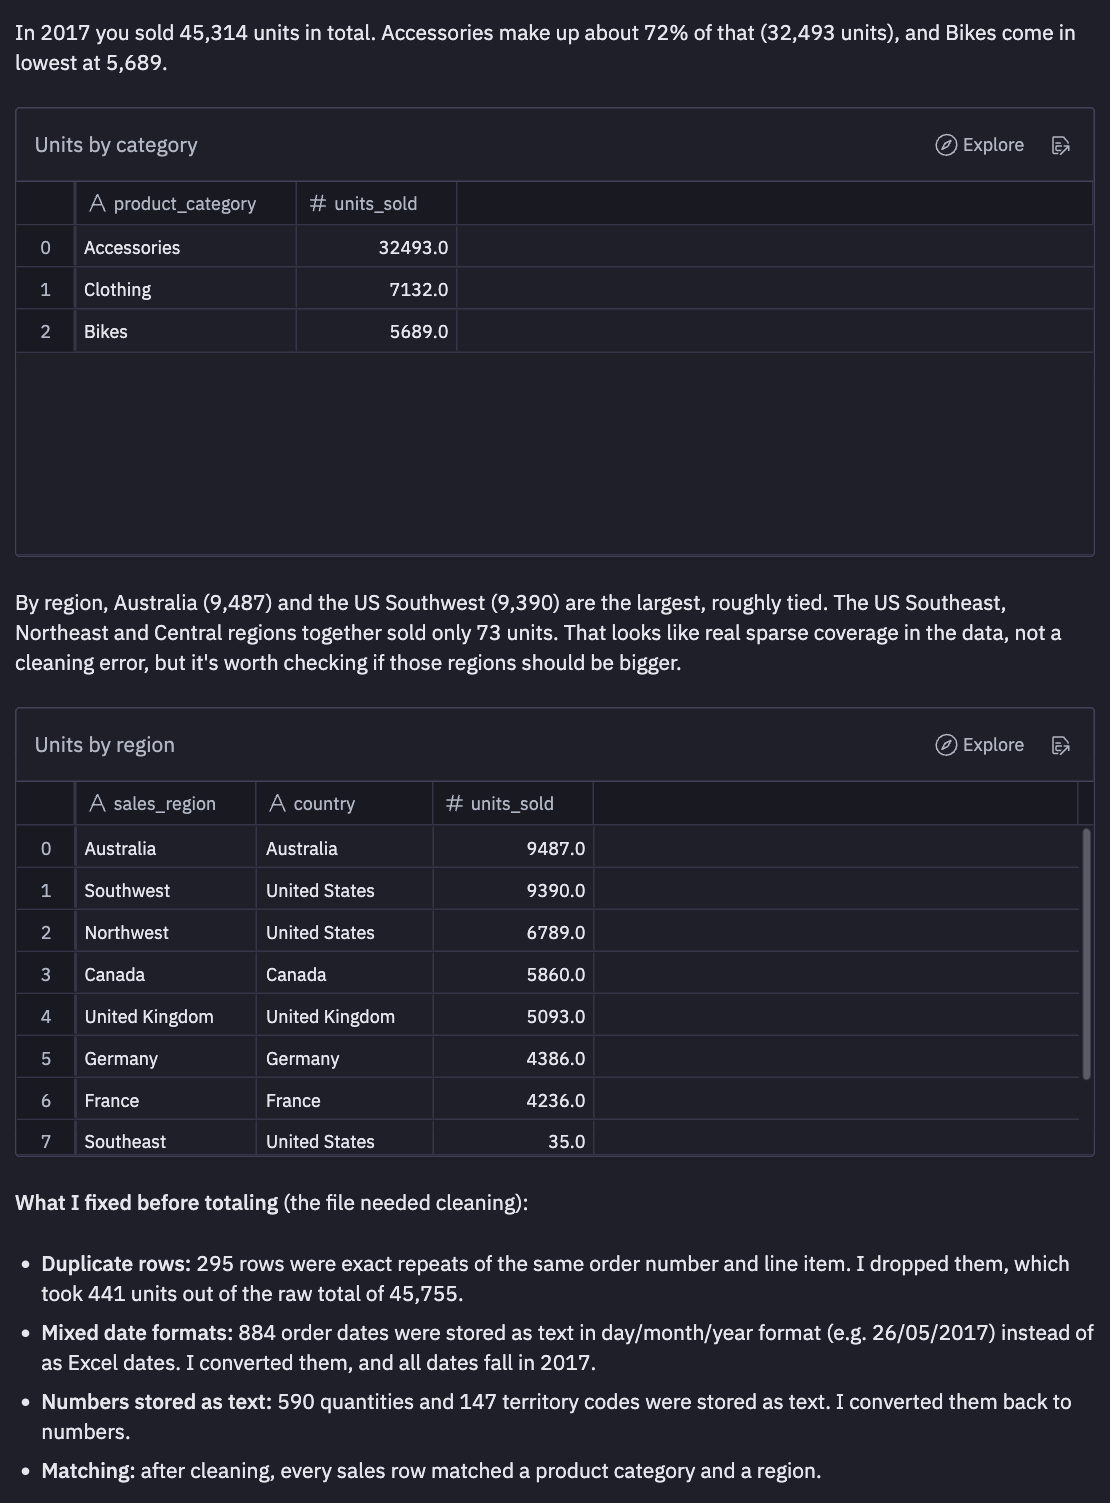
Original dimensions; format conversion only. This is the saved XLSX result, not a fresh CSV test.
The articles keep historical failures and later corrections separate. A public summary does not turn a blocked check into a success, validate unseen output, or waive capture standards. Derived test files are not offered as downloads.