Tools & Comparisons
12 min
Best Tableau Alternatives for Small Teams in 2026
Leaving Tableau as a small team? Match the replacement to which part of Tableau you keep and which cost, setup, or specialist burden you are trying to shed.
Read More
Tools & Comparisons — Hands-on test · 2026
 Updated 14 min read
A sales export needs checking before your reporting deadline. We tested eight AI tools on file size, dirty data and joins.
Quick answer. Our test picks: Claude and Hex for messy XLSX copies; Querri for CSV joins; Anomaly AI for large-file dashboards. No tool passed everything. Anomaly AI is our product.
We checked file handling, accuracy and plan limits.
616,506 rows and 925,914 units.
295 duplicates, day-first dates and a clean total of 45,314.
15 sales-to-target matches.
Table, chart and prose agree.
Where the tested plan stopped and the next price.
We followed files from upload through cleaning and joins to checked answers. The method below distinguishes native CSV from XLSX tests.
Scroll horizontally for all columns → · Keyboard: focus the table, then use the arrow keys.
| Tool | Plan and price | Best for | Big CSV file | Messy file | Two-file join | Right numbers | Free plan reach |
|---|---|---|---|---|---|---|---|
| Anomaly AI | Free; Pro $25/mo | Turning a large CSV into dashboards and reports | Pass: All rows, exact totals | Fail: 43,506; duplicates unflagged (Excel copy) | Pass (Excel copy) | Partial: Big file and join right; messy total wrong | About 30 credits used |
| Better Analyst | Free; Starter $20/mo | Quick charts from one small, clean CSV | Free plan stops at 5 MB | Fail: 45,755, then 44,427 | Free plan takes one file per chat | Partial: Clean charts right; messy answers wrong | One file per chat; 5 MB per file |
| ChatGPT | Free; Go $8; Plus $20/mo | A quick look at a small file | Partial: All rows; wrong grand total | Fail: 45,755, no warning (Excel copy) | Pass (Excel copy) | Partial: Table right; written total wrong | Daily limit after three charts |
| Claude | Free; Pro $20/mo | Messy exports where the total must be right | Pass: All rows, exact totals | Pass: 45,314; duplicates flagged (Excel copy) | Pass (Excel copy) | Pass: Tables, charts and totals right | Pro tested; Free not measured |
| Deepnote | Free; Team $39/editor/mo, yearly | Notebook users who check data themselves | Pass: All rows, exact totals | Fail: 45,755, no warning (Excel copy) | Pass (Excel copy) | Partial: Clean analyses right; messy total wrong | Team trial; test used 10 calls; Free then showed 5/mo |
| Hex | Free; Professional $36/editor/mo | Messy data you must explain line by line | Pass: All rows, exact totals | Pass: 45,314; all four problems named (Excel copy) | Pass (Excel copy) | Pass: Tables, charts and totals right | Team trial; Free not measured |
| Powerdrill (Chat) | Free; Basic $3.90/mo | Low-cost charts from a small, clean CSV | Free workspace holds 5 MB | Fail: Answered with categories not in the file | Pass: After one retry | Partial: Final join right; messy answer invented | 5 MB workspace; credits exhausted |
| Querri | Free; Pro $119/mo | Joining CSV files into charts | Partial: All rows; wrong written total | Fail: 45,755; named the duplicates, kept them | Pass: All 15 values | Partial: Charts right; written answers conflicted | 11 of 15 monthly credits used |
Compare AI analysis tools by job, or see the separate Excel workbook test.
The files. We used Microsoft’s AdventureWorks sample data, not customer data. Repeating 56,046 sales rows eleven times produced the large CSV. We calculated the expected answers first; derived files are not offered for download.
Prompts. Fixed requests used fresh chats or projects, with up to two fixed retries for the shared XLSX runs and one for the three native-CSV runs. The test evidence records the requests, expected values and saved results.
Testers. Claude-based AI agents operated Anomaly AI, ChatGPT, Claude, Deepnote and Hex on 7–8 October; a GPT-based agent operated the other three on 8 October. Agents drafted from saved records. Ash Rai is the editorial byline, not a claim of personal testing.
Testers generally knew the answer key; the prompts did not reveal it. A separate agent recomputed the three native-CSV runs. No independent ratings review occurred, so tools are alphabetical and unranked.
Formats differ. All eight received the large CSV. Better Analyst, Querri and Powerdrill received CSVs for the other checks; five tools received XLSX copies, with targets on another sheet.
Both messy versions contain 295 duplicates, 884 day-first text dates and 590 text quantities. The fourth defect differs: 147 trailing-space region labels in CSV versus 147 text territory codes in XLSX. They share an expected clean total, not identical parsing tests. These disclosed runs also support our analysis and chart comparison.
Disclosure. Anomaly AI is our product. It kept duplicates that Claude and Hex removed.
Scroll horizontally for all columns → · Keyboard: focus the table, then use the arrow keys.
| Tool | Plan and date | Messy file and join tested as | Where the plan stopped us | Tester knew the expected totals? |
|---|---|---|---|---|
| Anomaly AI | Free account with extra credits, 7 Oct | Excel copy | Not stopped; used about 30 credits, roughly a month of the Free plan | Yes |
| Better Analyst | Free, 8 Oct | CSV | One file per chat; 5 MB per file | Yes |
| ChatGPT | Free, 7 Oct | Excel copy | Daily data-analysis limit after three charts | Yes |
| Claude | Pro (paid), 8 Oct | Excel copy | No limit hit | Headline totals only |
| Deepnote | Team trial, 7 Oct | Excel copy | Team trial used 10 calls; Free lists 5 a month | Not recorded |
| Hex | Team trial, 7 Oct | Excel copy | No limit hit on the trial | Yes |
| Powerdrill (Chat) | Free, 8 Oct | CSV | 5 MB total workspace; credits ran out before a retry | Yes |
| Querri | Free, 8 Oct | CSV | Not stopped; 11 of 15 monthly credits used | Yes |
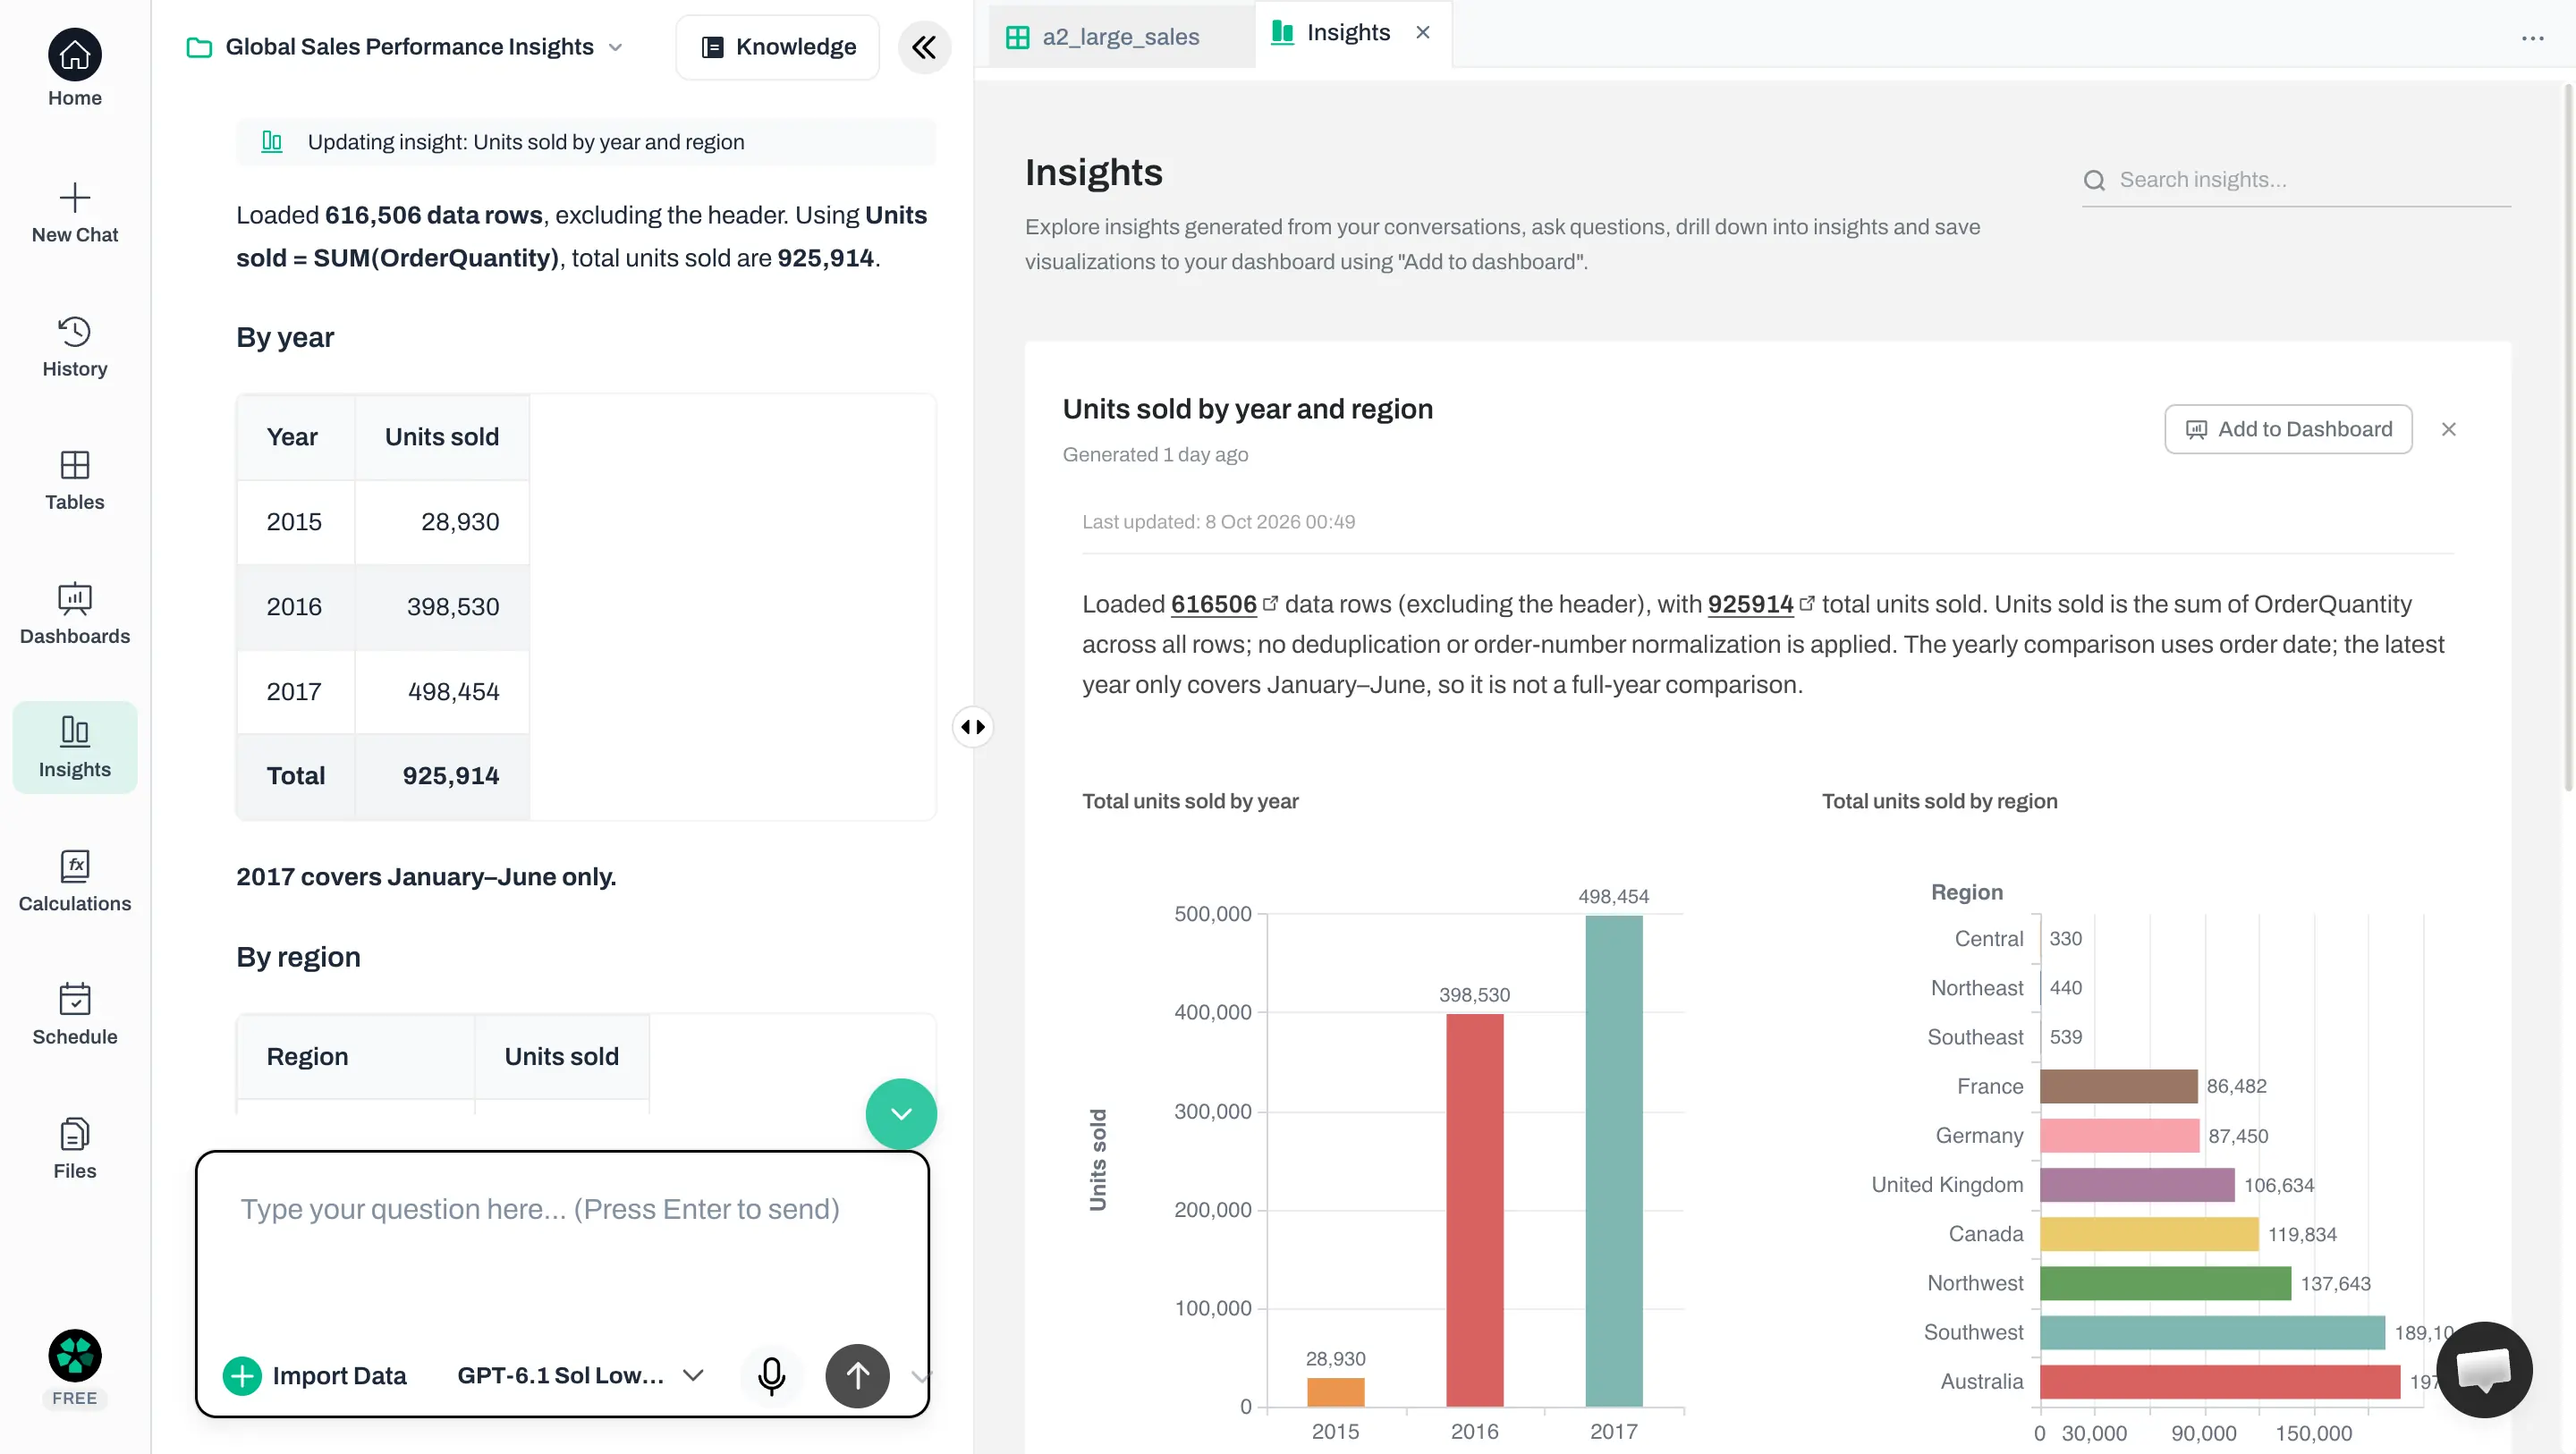
Anomaly AI loaded all 616,506 rows and returned exact totals by year and region in our big-CSV test. It confirmed the row count with a query of its own. Saved test evidence
Anomaly AI's row count and yearly totals for the big CSV
On messy XLSX, Anomaly returned 43,506 instead of 45,314. It set aside text dates and quantities as missing, disclosed those exclusions, and never flagged the duplicates. None of the four problems was fixed.
The XLSX join chart was correct. A trend chart initially merged categories; the fixed retry corrected it.
Anomaly accepts CSV/Excel uploads up to 1 GB and builds dashboards and reports with reviewable calculations. This run used about 30 credits.
Pick it if you need a large CSV turned into a dashboard or report. Check duplicates and date formats first.
Price (checked 10 Oct 2026): Free, with 30 credits every 30 days; Pro $25 a month ($20 a month when billed yearly); Analyst $90 a month; Team $45 per seat a month, two-seat minimum (Anomaly AI pricing). Annual plans are billed once a year. Tested on: a free account with extra credits.
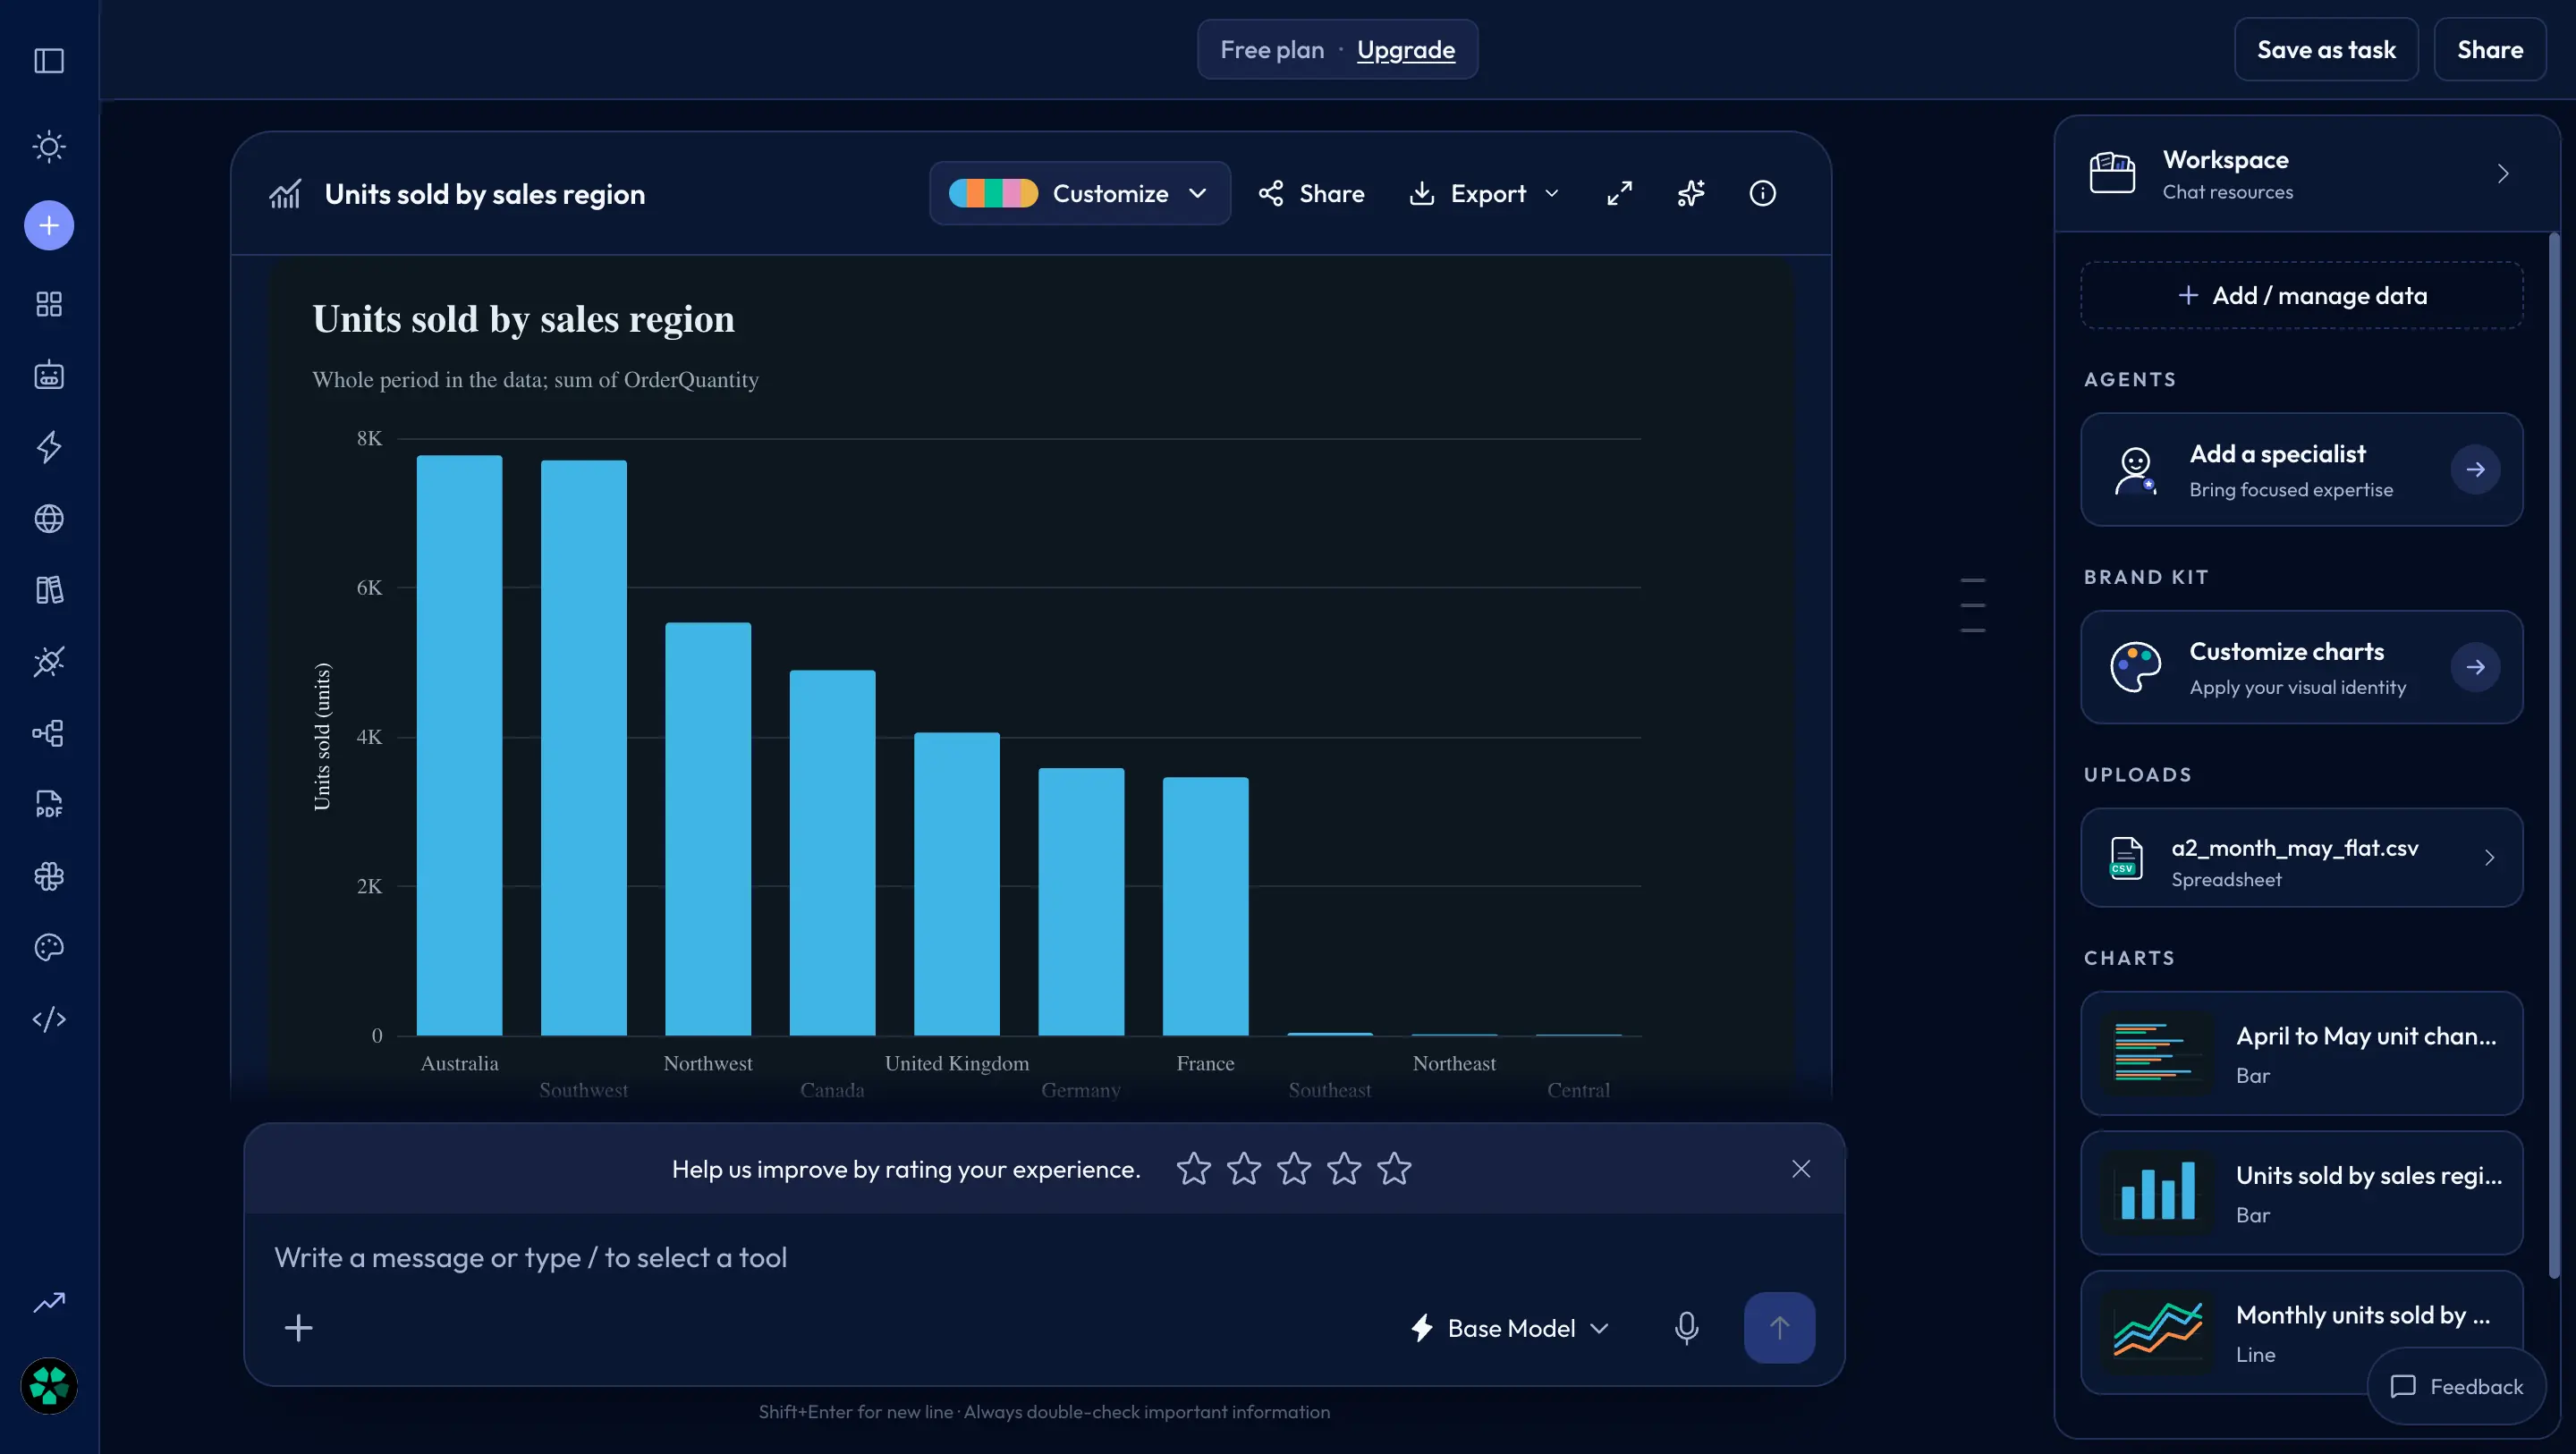
Better Analyst's free plan produced three correct charts when our team tested the May sales CSV used here. All 15 monthly values, 10 region totals and 29 April-to-May changes matched our key. One summary sentence understated the biggest regional change: it quoted Southwest's Accessories alone (+205) rather than Southwest's full +279. Saved test evidence
Better Analyst's units-by-region chart from our sales CSV
The free plan takes one file per chat, so we could not attach the targets file for the join. It also refused the big file: "Skipped 1 file(s) exceeding 5MB limit".
On messy CSV, Better Analyst returned 45,755 without flagging duplicates. Its retry returned 44,427: duplicates remained and all 884 day-first dates were dropped.
Formerly Formula Bot, Better Analyst lists 200 MB and 20 files per chat on Starter.
Pick it if you want quick charts from one small, clean CSV. Re-check any total that comes from a messy file.
Price (checked 10 Oct 2026): Free; Starter $20 monthly/$14 yearly-billed; Max $40/$28 and Business $80/$56 per user monthly/yearly-billed (Better Analyst pricing). Tested on: Free, with its Base Model. For similar tools, see our Formula Bot alternatives.
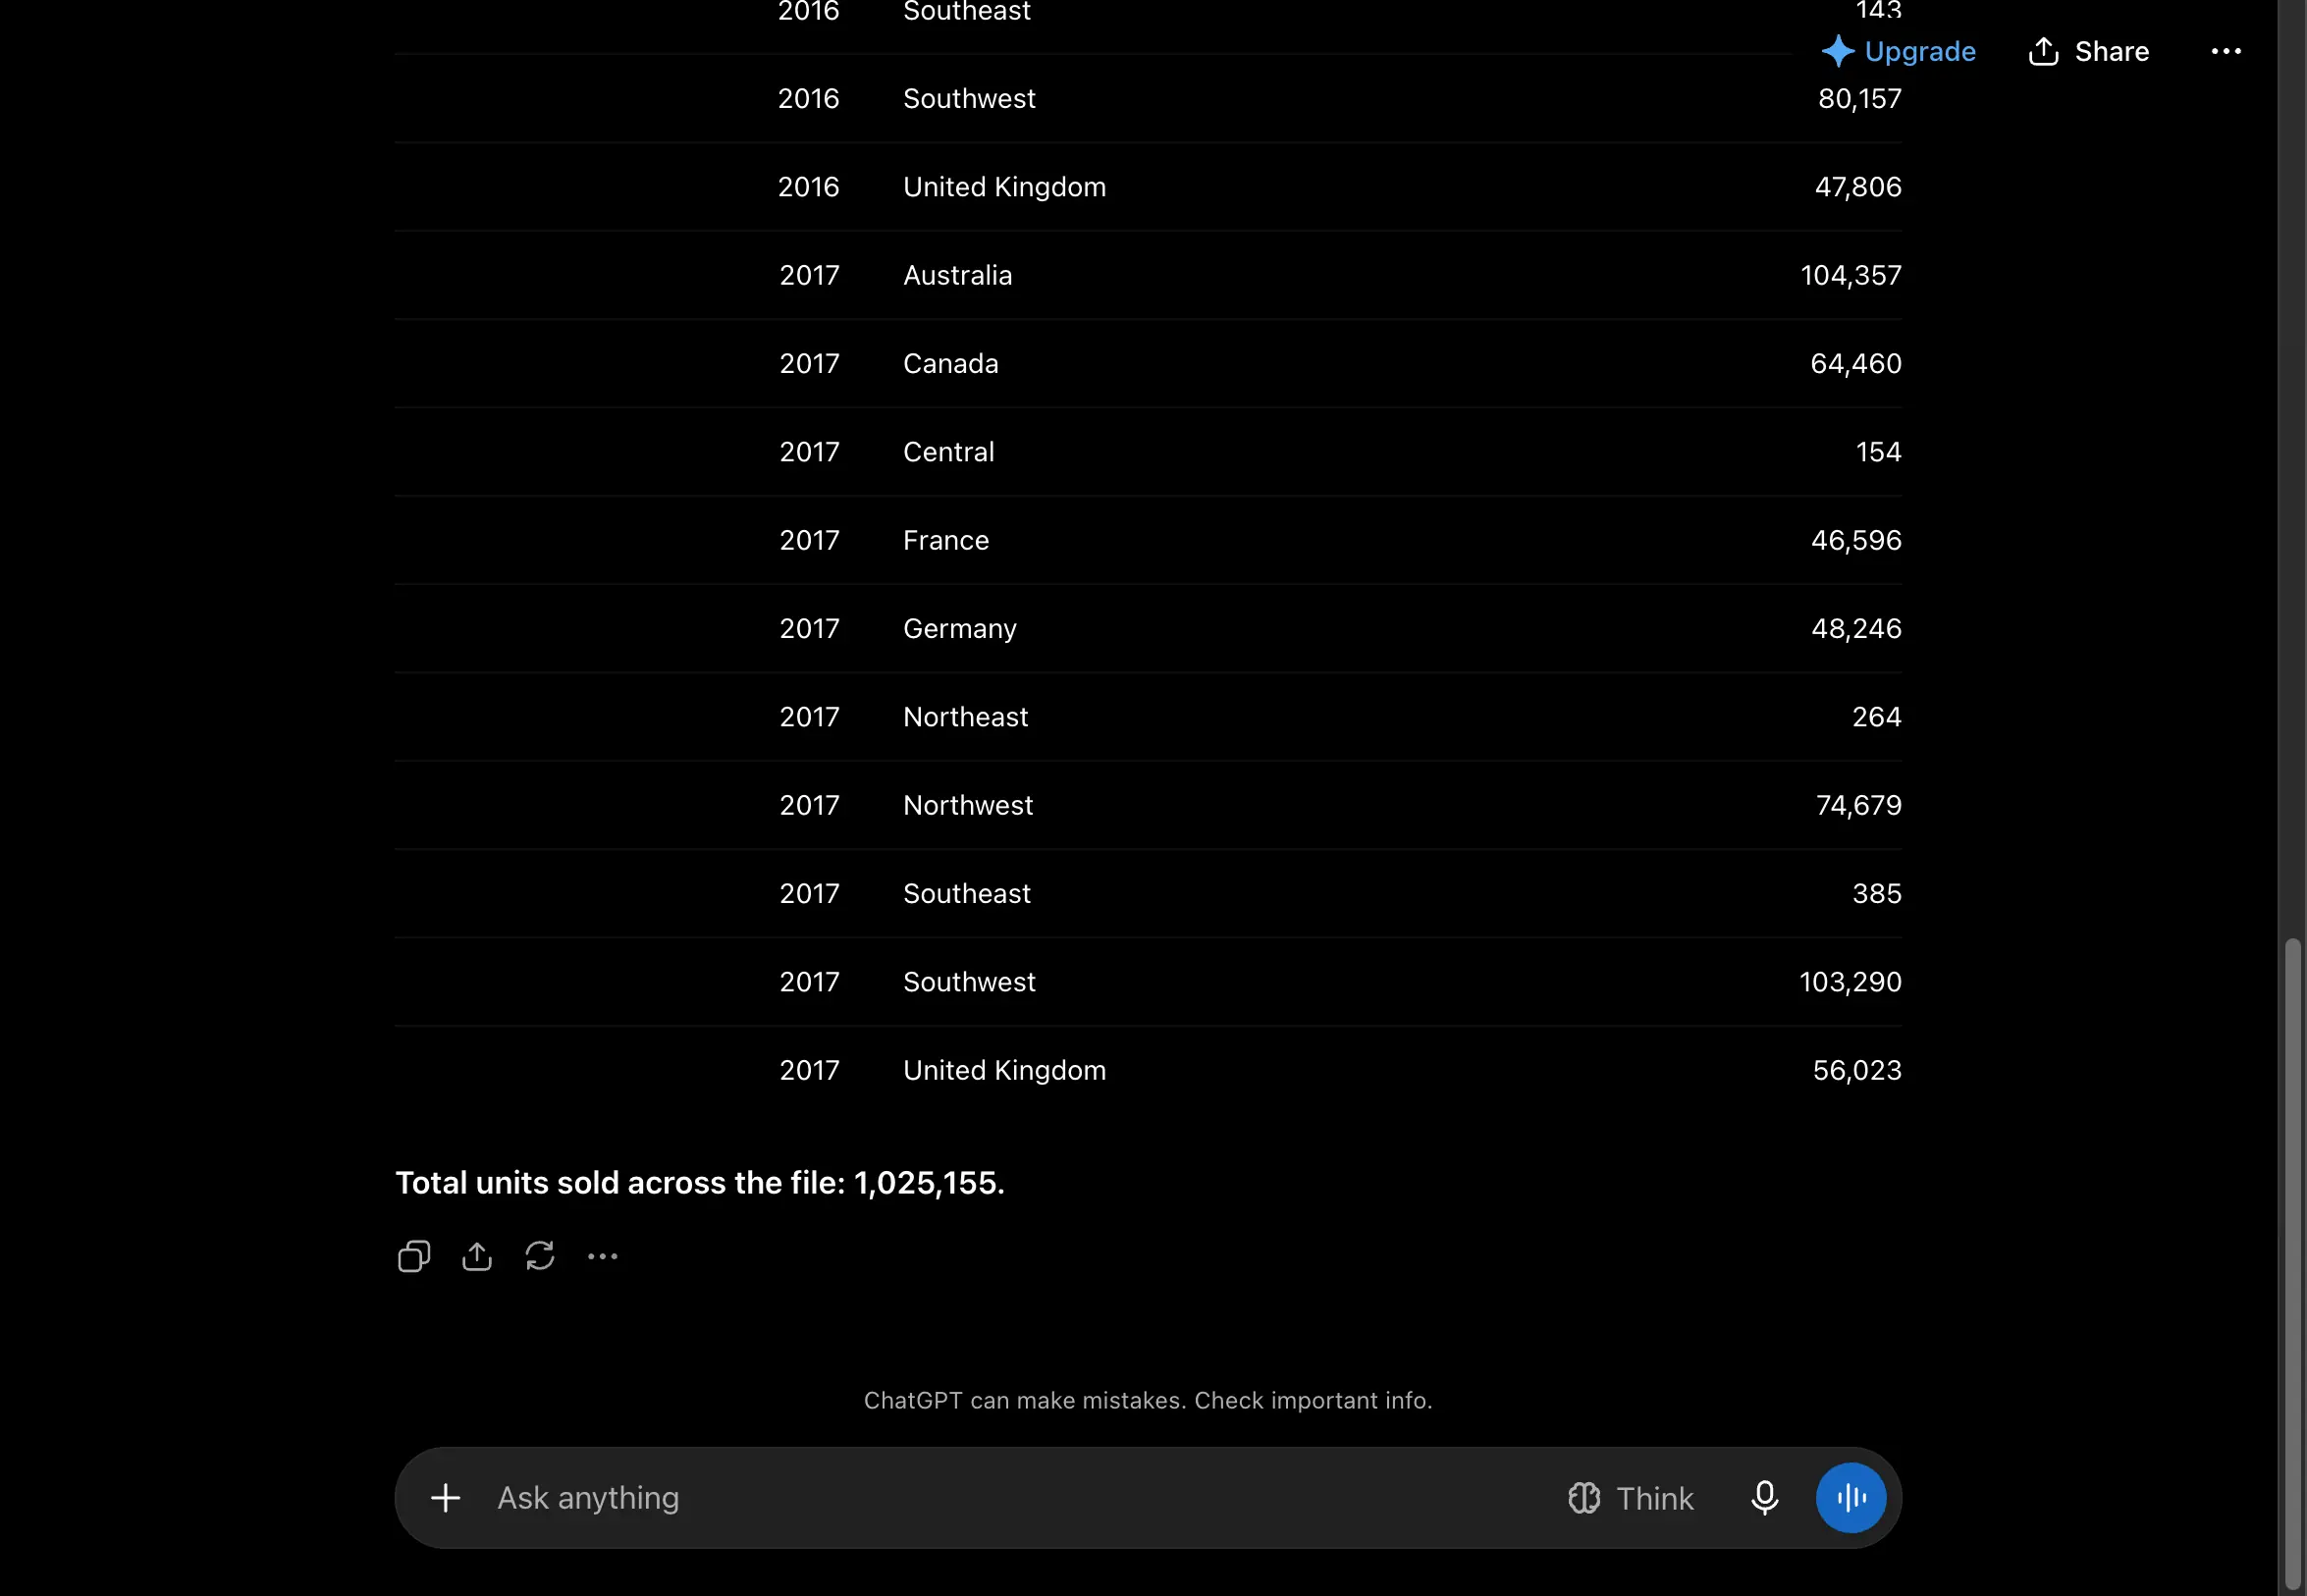
ChatGPT gave a split result in our big-CSV test on its free plan: it loaded all 616,506 rows, and its year-by-region table was right. The grand total it stated, 1,025,155 units, was not: the file holds 925,914. Saved test evidence
ChatGPT's year-by-region table and the total it stated
On the Excel copy of the messy file, it returned 45,755, keeping the duplicate rows without a warning.
On the Excel copy, its first three charts matched our key, including actual against target. Then the free plan's daily limit stopped the fourth: "You've reached your data analysis limit." New chats still ran the other checks.
Pick it if you want a quick look at a small, clean file. Add the grand total up yourself before you quote it.
Price (checked 10 Oct 2026): Free; Go $8 a month; Plus $20; Pro from $100 (ChatGPT pricing). Tested on: Free.
Claude returned 45,314, the right total, in our team test with the Excel copy of the messy file. It said it had removed 295 duplicate rows, and it noticed the 884 dates written day-first as text. Saved test evidence
It loaded all 616,506 rows of the big CSV with exact totals. Its four charts matched our key, including actual against target from the targets sheet.
Claude's summary for the big CSV
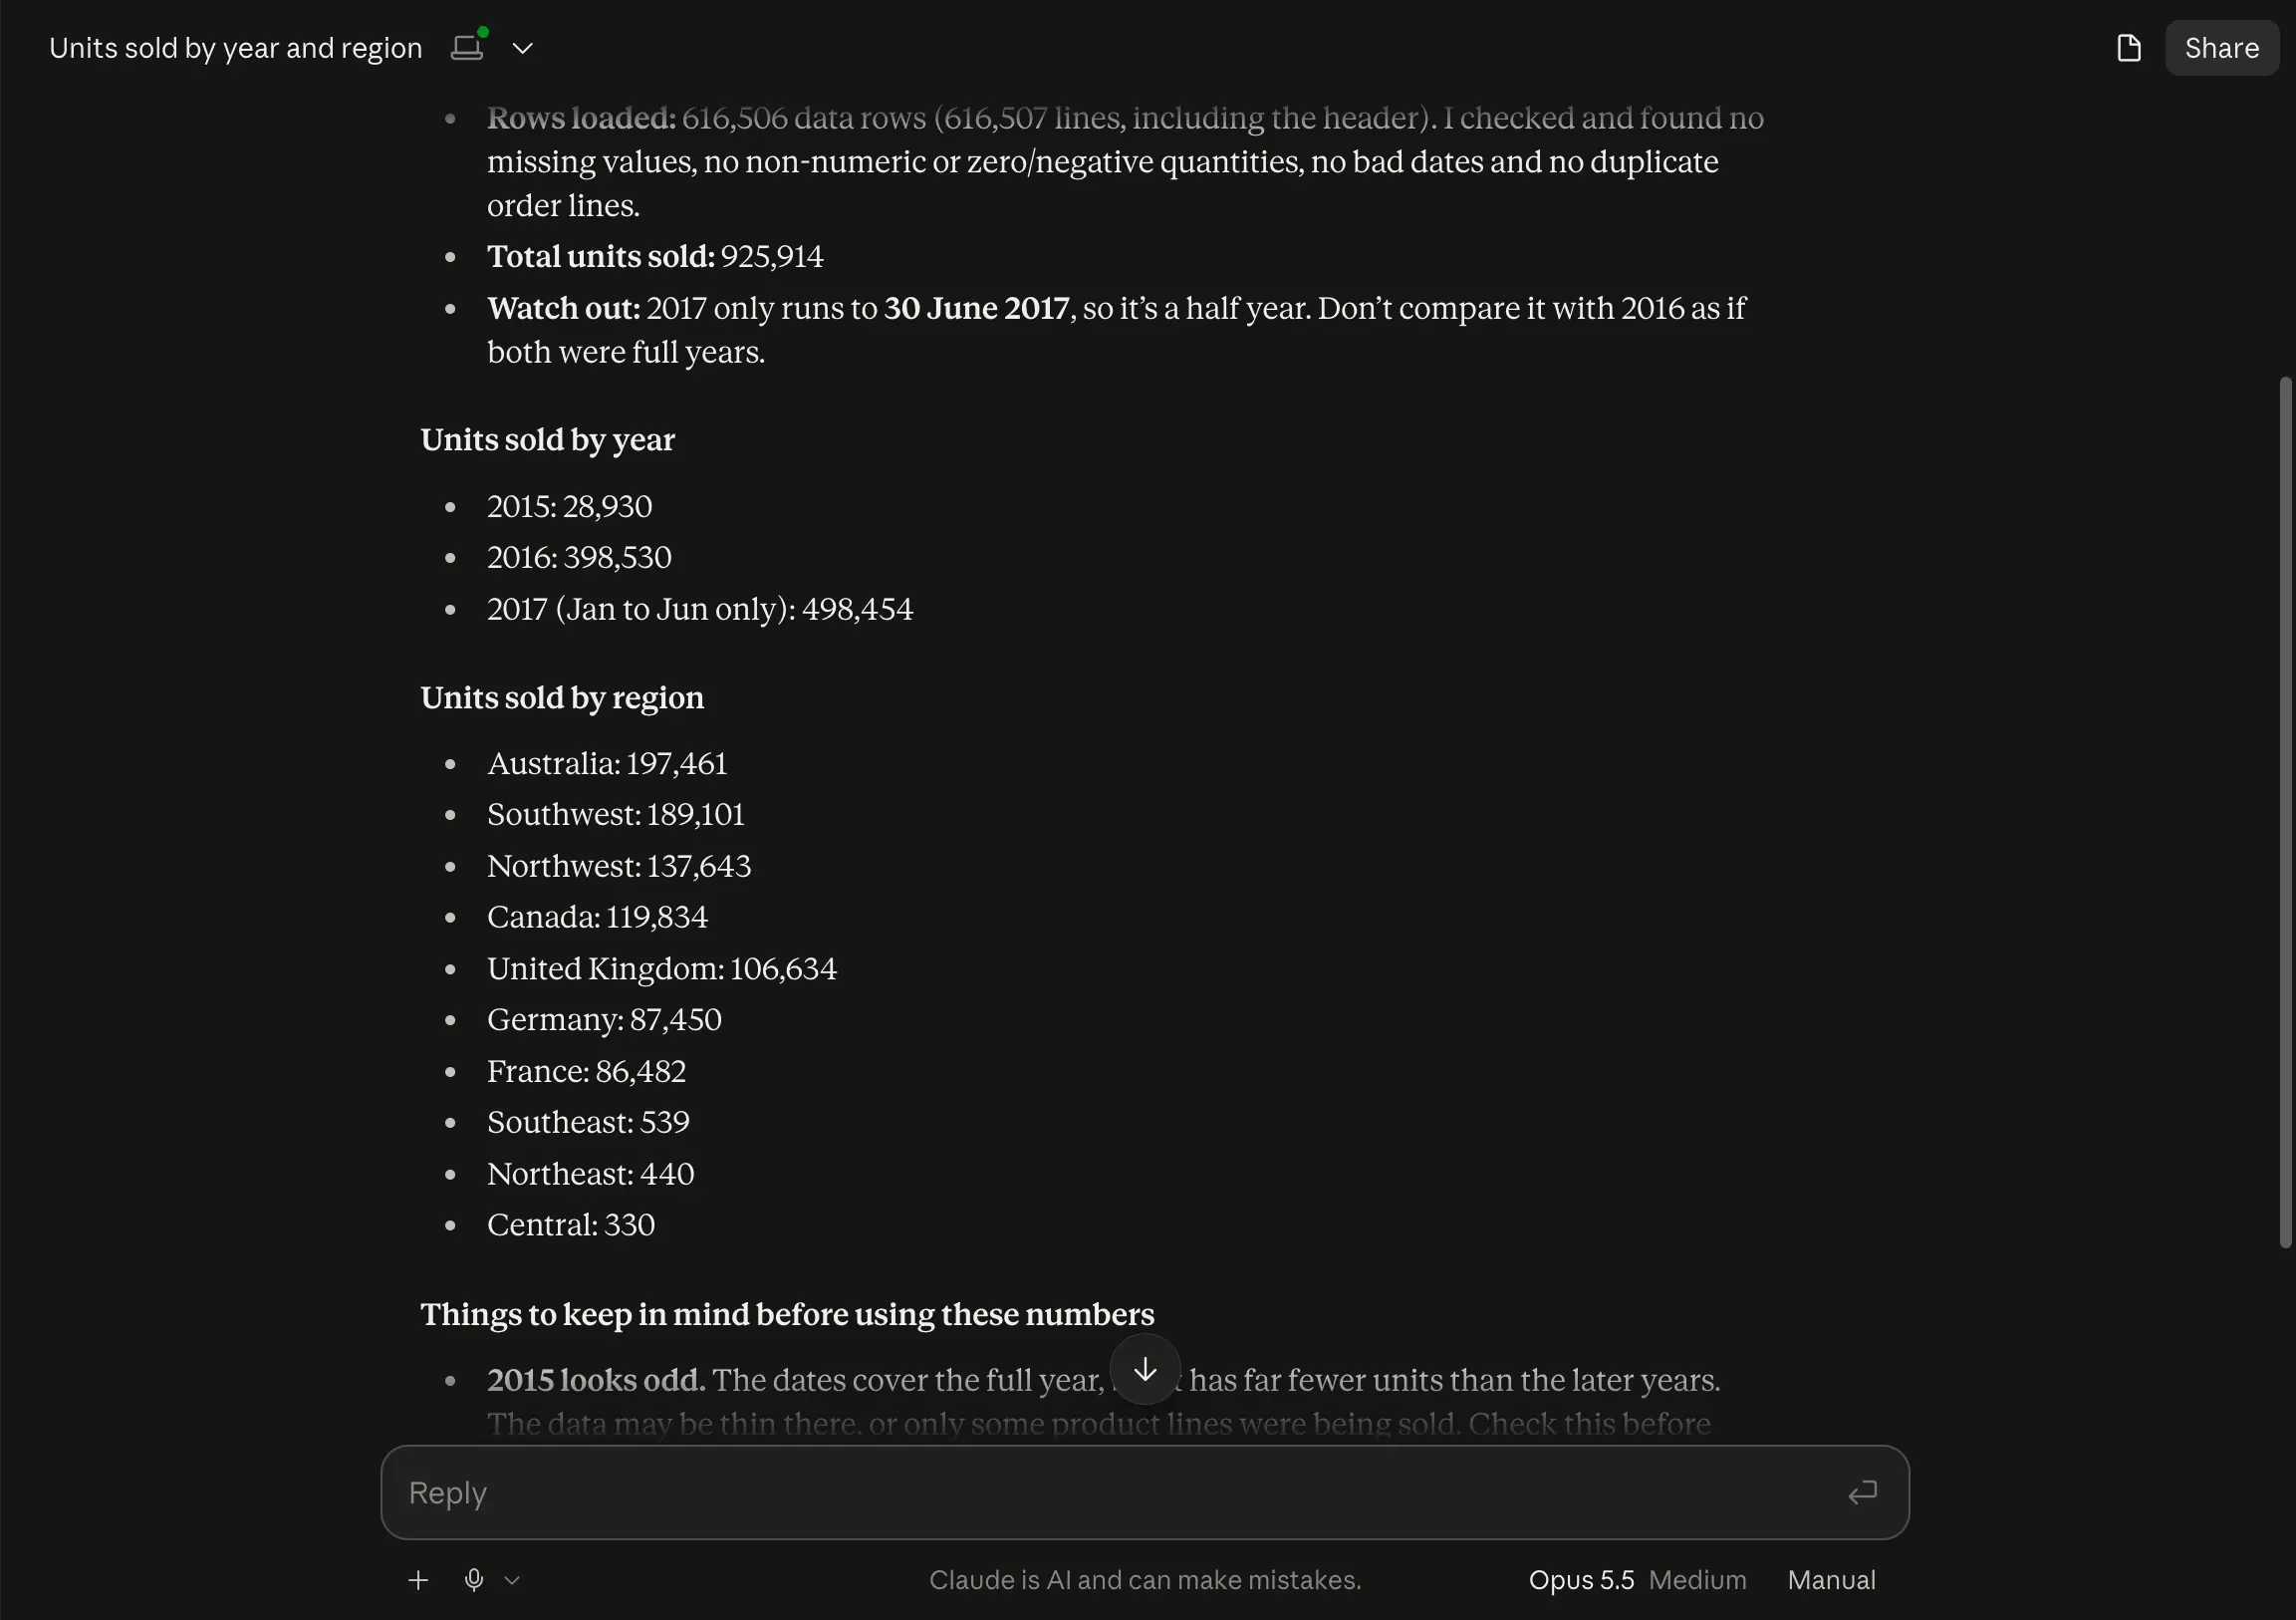
Claude used paid Pro with Opus 5.5; Free was not tested. Its tester was also Claude-based, with results checked against the shared answer key.
Pick it if your exports are messy and the total has to be right.
Price (checked 10 Oct 2026): Free; Pro $20 a month, or $200 paid upfront yearly (about $17 a month); Max from $100 a month (Claude pricing). Tested on: Pro, with Opus 5.5.
Deepnote used Python code to read all 616,506 CSV rows in our test and returned exact totals. Saved test evidence
Deepnote's code and row count for the big CSV
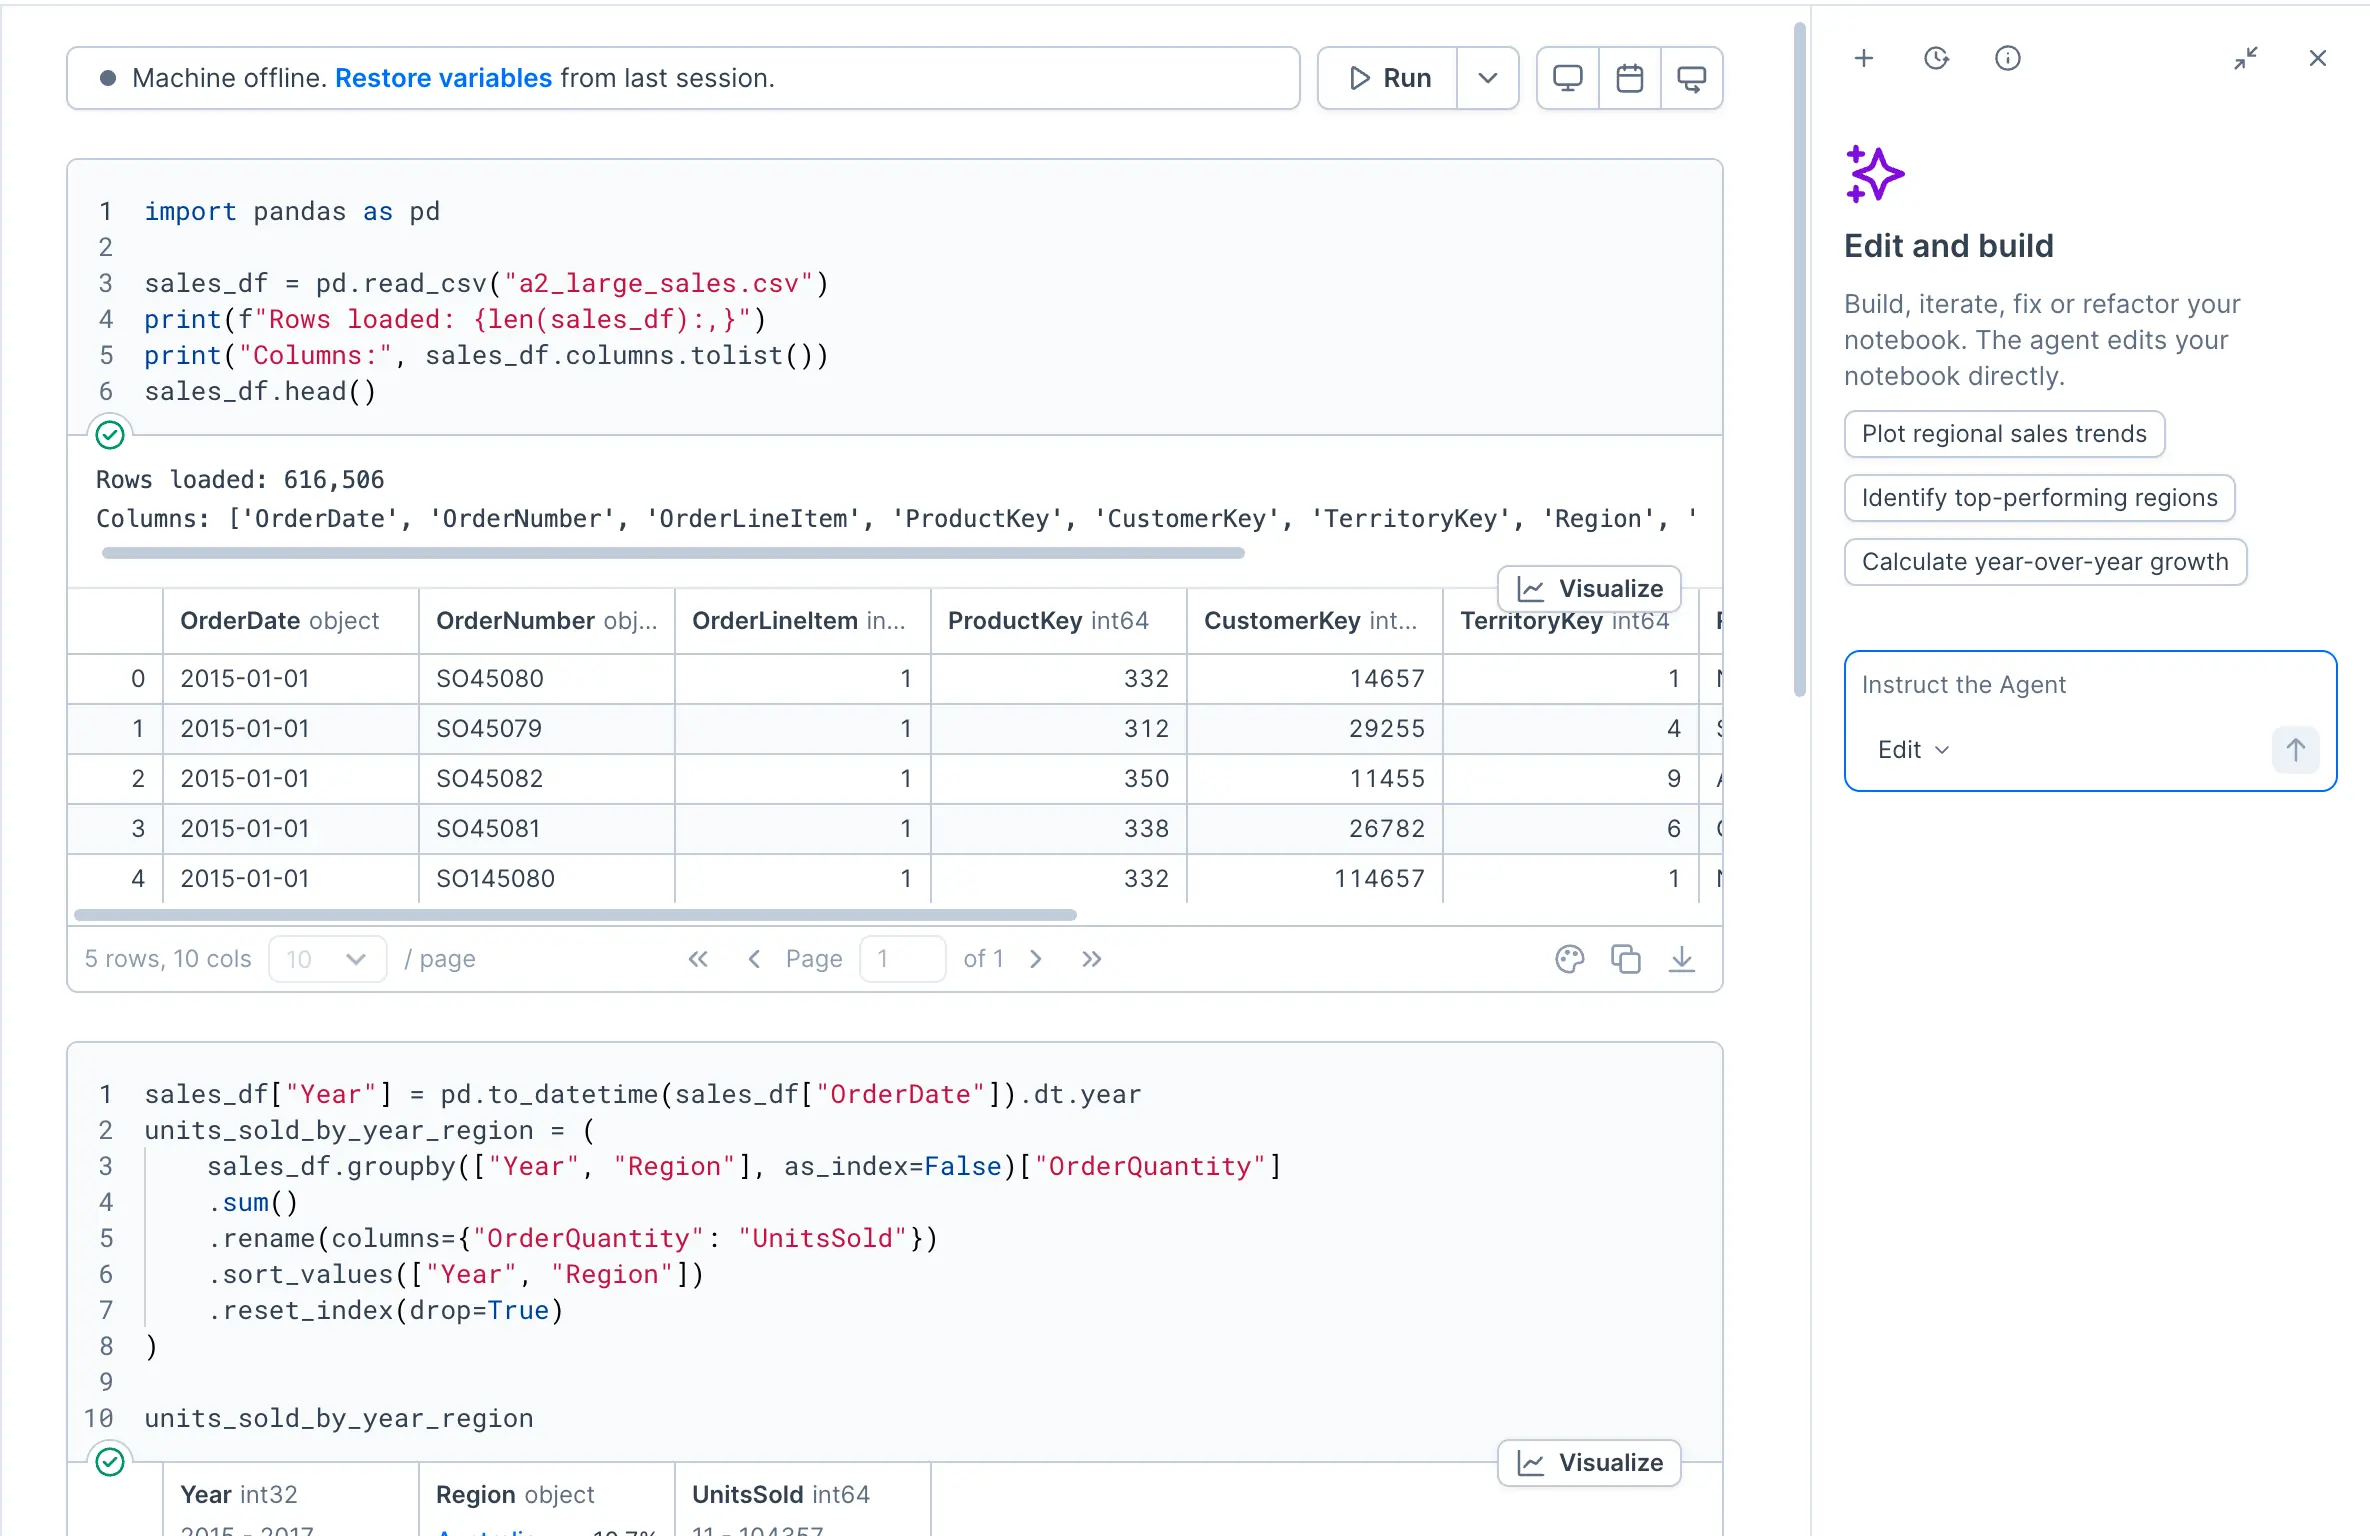
On the Excel copy of the messy file, it returned 45,755 with all 295 duplicate rows still counted, and no warning. Its code was on view beside the answer, so a careful reader could have spotted the gap.
Deepnote’s four XLSX charts matched the key, one after a retry. The Team-trial run used ten Agent calls. The current pricing comparison lists five Agent calls monthly on Free; the plan card says “Limited Deepnote AI”.
Pick it if you use notebooks—documents containing code, data and charts—and check data quality yourself.
Price (checked 10 Oct 2026): Free, with five Agent calls monthly in the pricing comparison; Team $49 per editor monthly or $39 yearly-billed, with a 14-day trial (Deepnote pricing). Tested on: an existing Team trial.
Hex returned 45,314 in our saved XLSX run on the Excel copy of the messy file and was the only tool to name all four planted problems. It listed its fixes: 295 duplicate rows (441 units), 884 dates stored as text, and quantities and region codes stored as text. Saved test evidence
We checked its final category and region totals against the answer key.
Hex’s saved messy-XLSX answer and cleaning steps
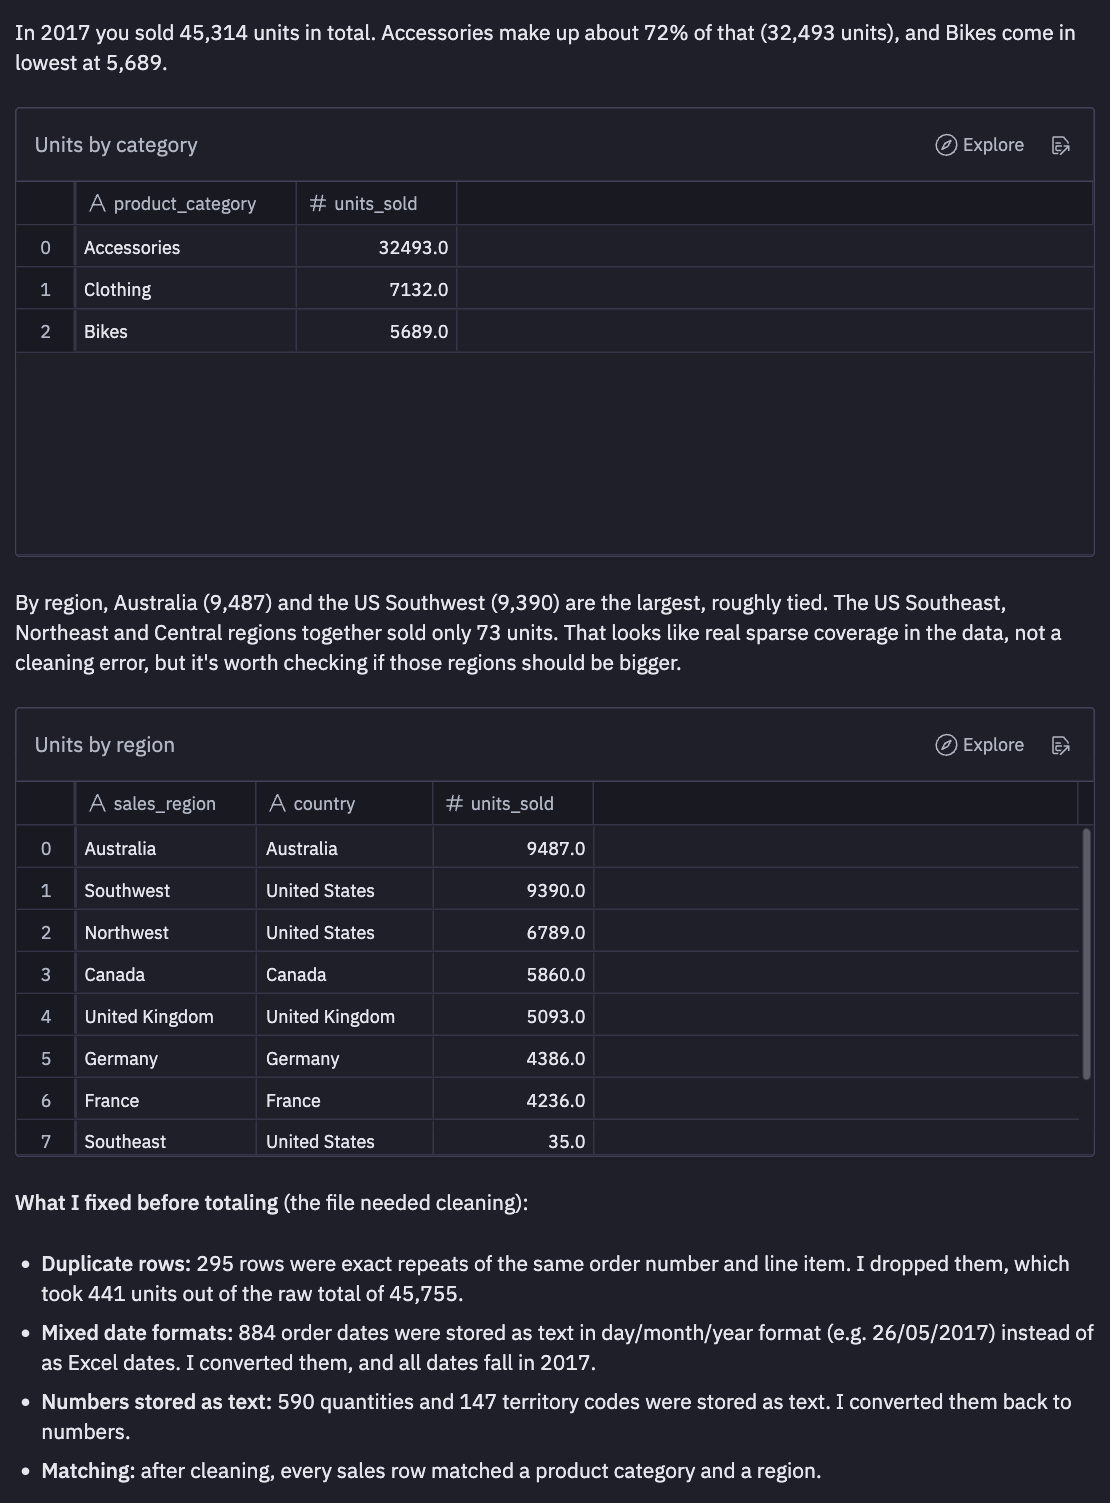
It loaded all 616,506 rows of the big CSV and gave exact totals in a year-by-region table. On the Excel copy, its four charts matched our key.
Pick it if your data arrives messy and you need to explain every fix before you trust a total.
Price (checked 10 Oct 2026): Community free; Professional $36 and Team $75 per editor a month; paid plans have a 14-day trial (Hex pricing). Tested on: a Team trial.
Powerdrill Chat answered the messy CSV in our team's test with categories and regions that are not in the file, such as Electronics and North America. None of its totals came from our data. Saved test evidence
Powerdrill Chat's answer to the messy CSV
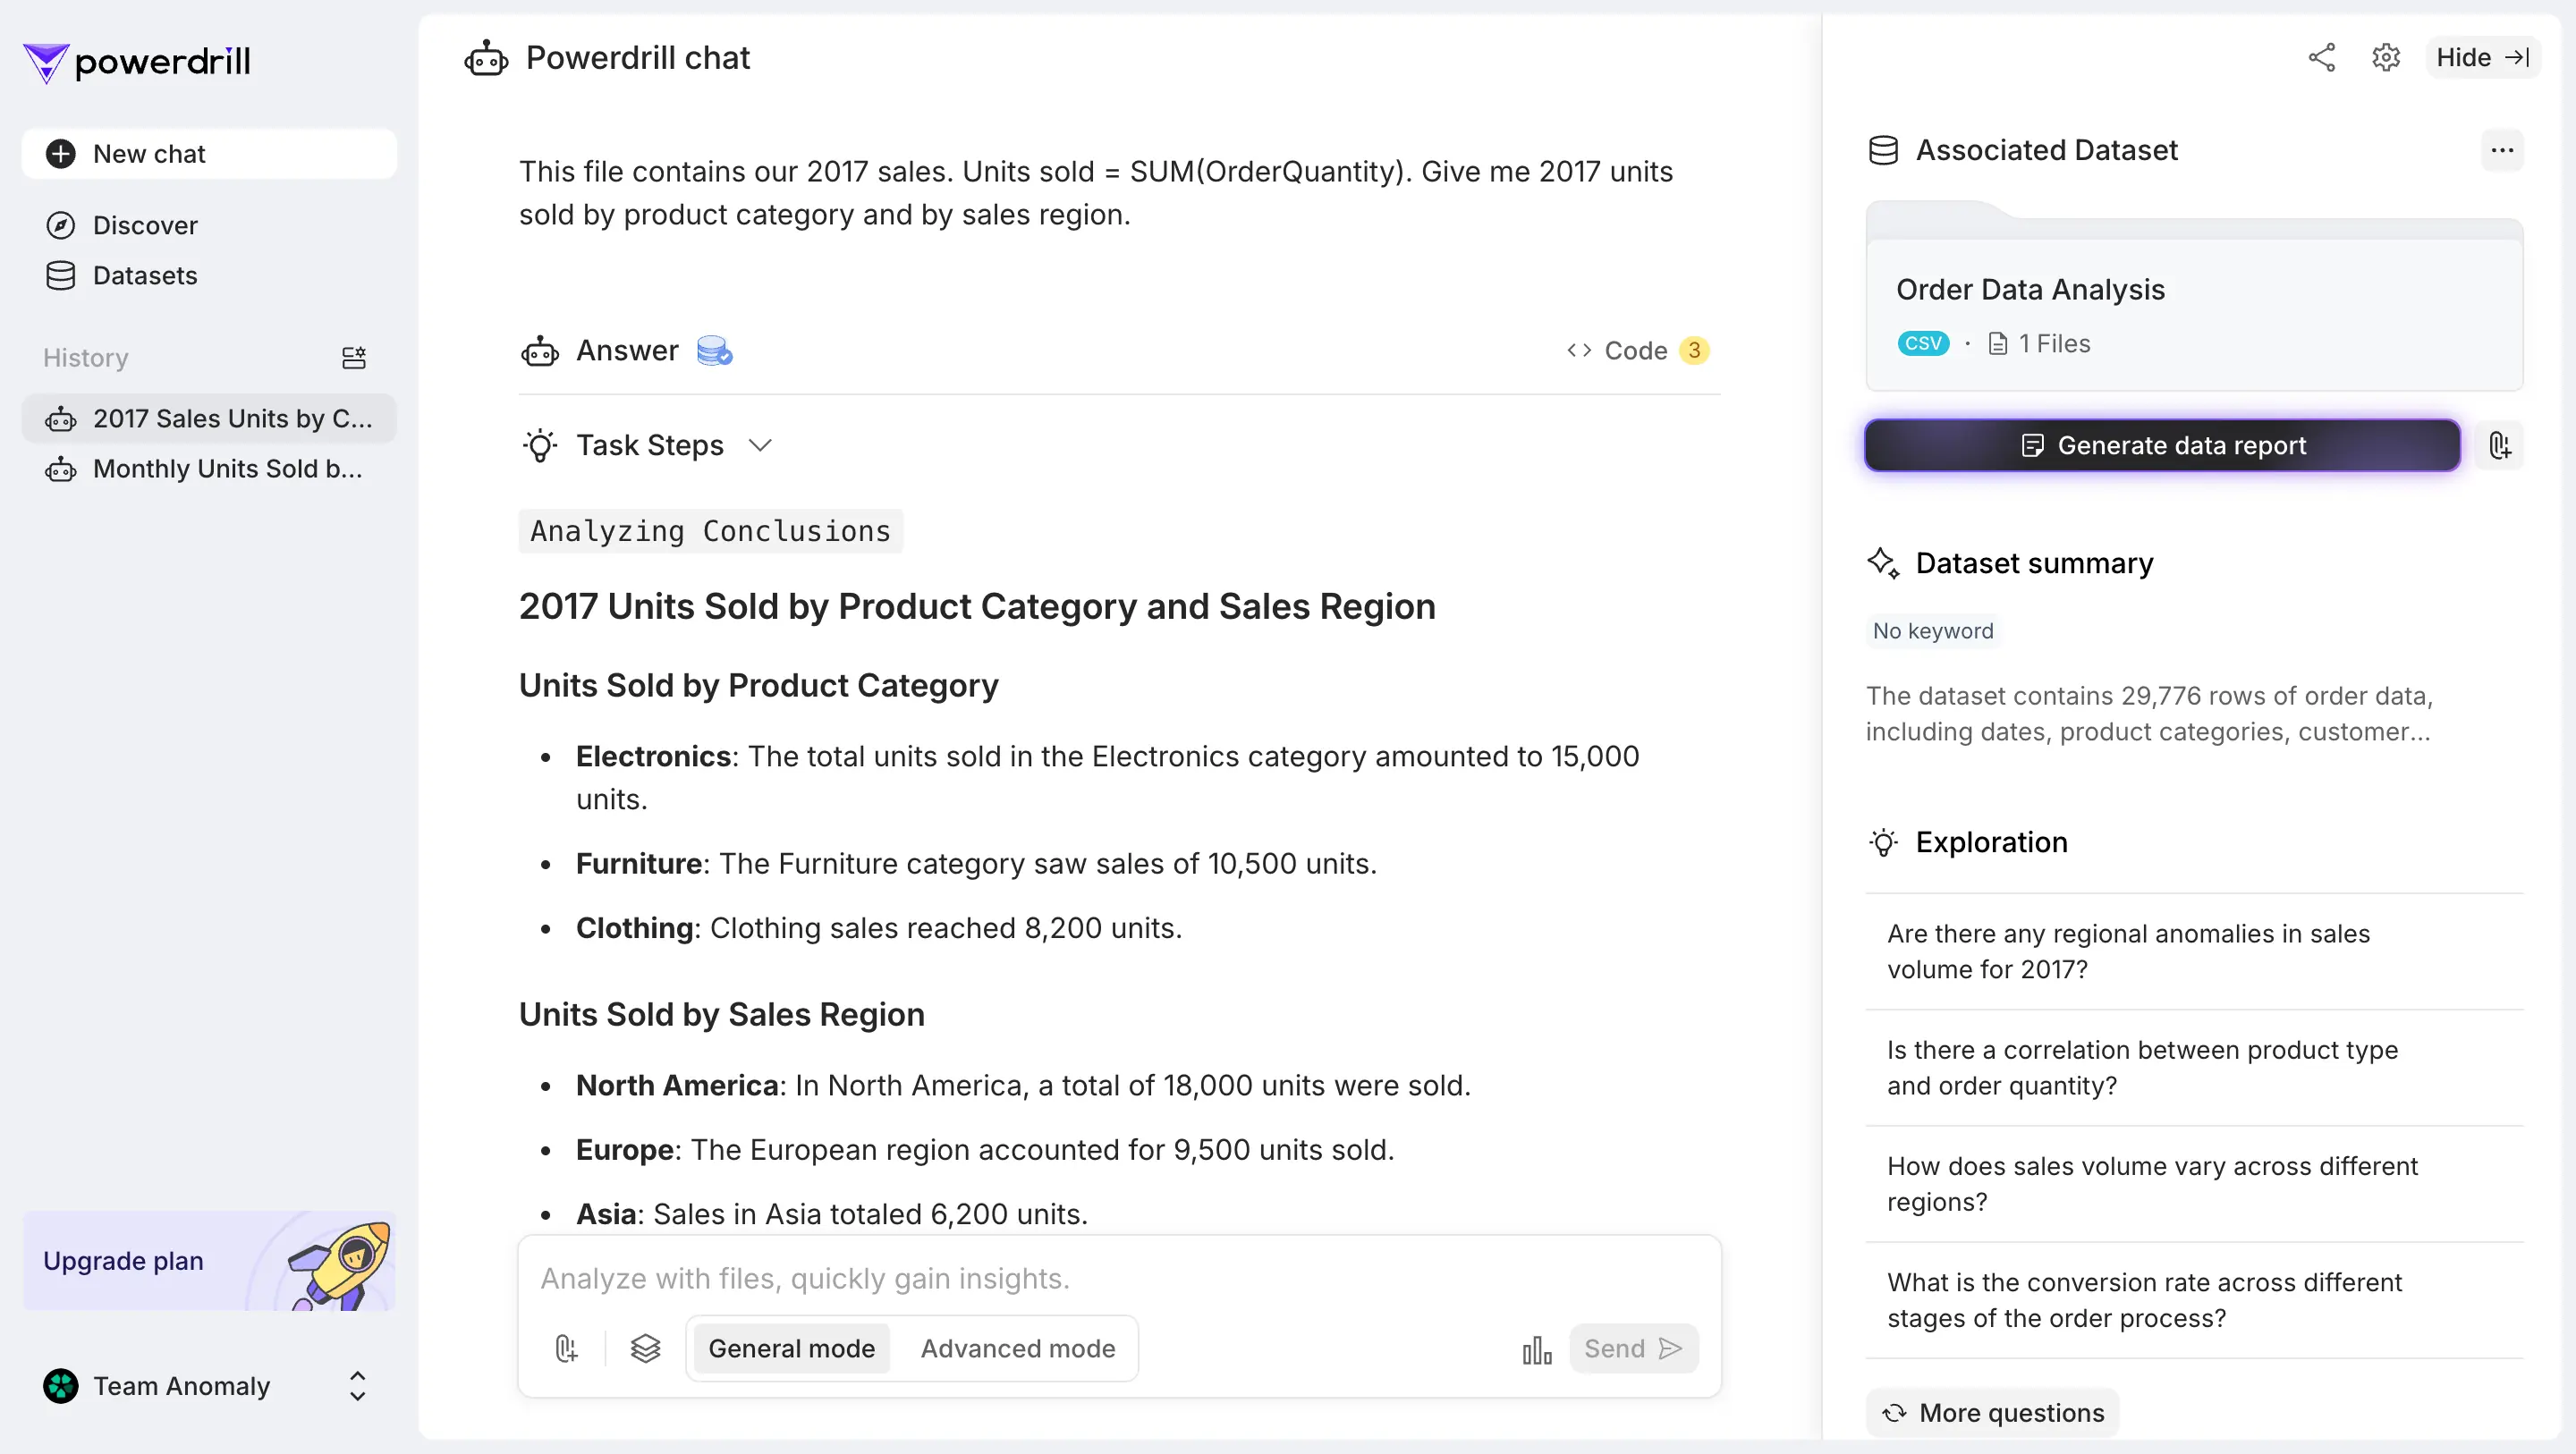
After one retry, Powerdrill’s join chart matched all 15 values but lacked the requested variance labels. Its other charts were correct, one after a retry.
The free workspace holds 5 MB in total, so the big file never loaded: "AI workspace capacity 44.59 MB / 5 MB". Credits ran out before we could retry the messy file.
We tested Powerdrill Chat, the company's separate chat product. The main Powerdrill Bloom app had no free credits on our account, so Bloom is not part of this test.
Pick it if you want low-cost charts from a small, clean CSV and will check every number.
Price (checked 10 Oct 2026): Free; Basic $3.90 a month on its pricing page, though the in-app upgrade box quoted $3.25 when we tested. Plus $9.90 and Pro $29.90 a month (Powerdrill Chat pricing). Tested on: Free. For similar tools, see our Powerdrill alternatives.
Querri got every number in its charts right when our team ran the join test, including all 15 values from the sales and targets CSVs. Its written explanations got several numbers wrong. It put a +15.05% month in April, at 810 against 704; it was May, at 1,116 against 970. Saved test evidence
Querri's joined actual-against-target table
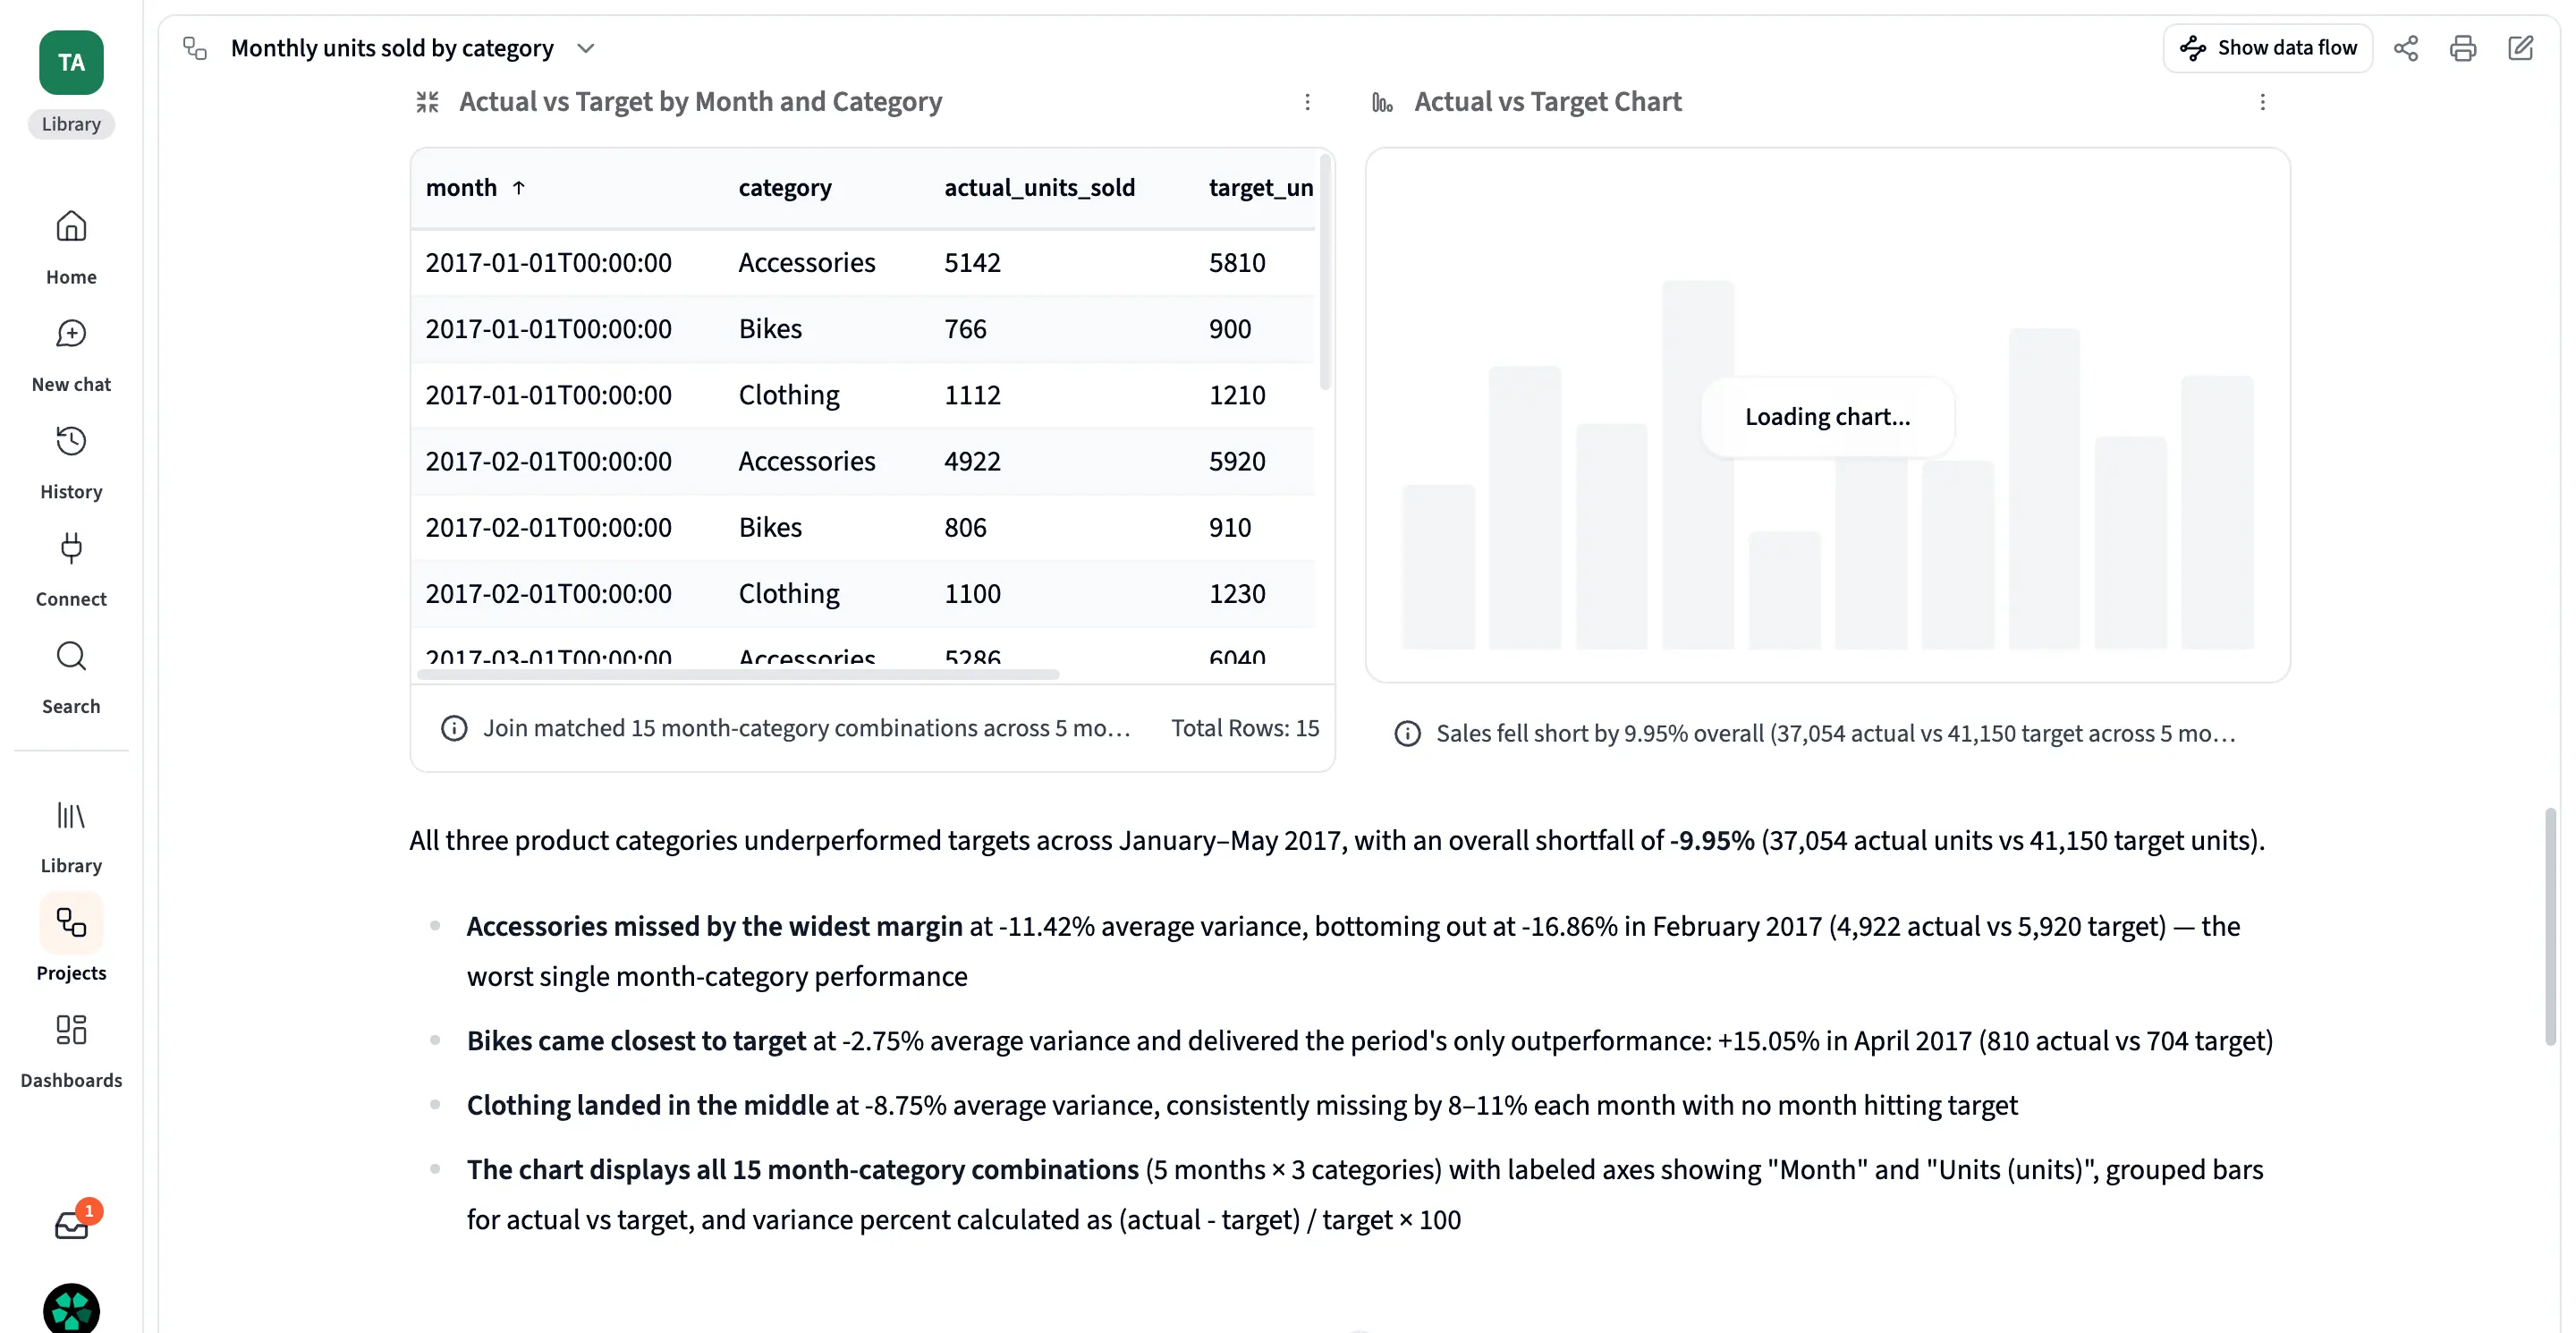
Querri's completed actual-against-target chart
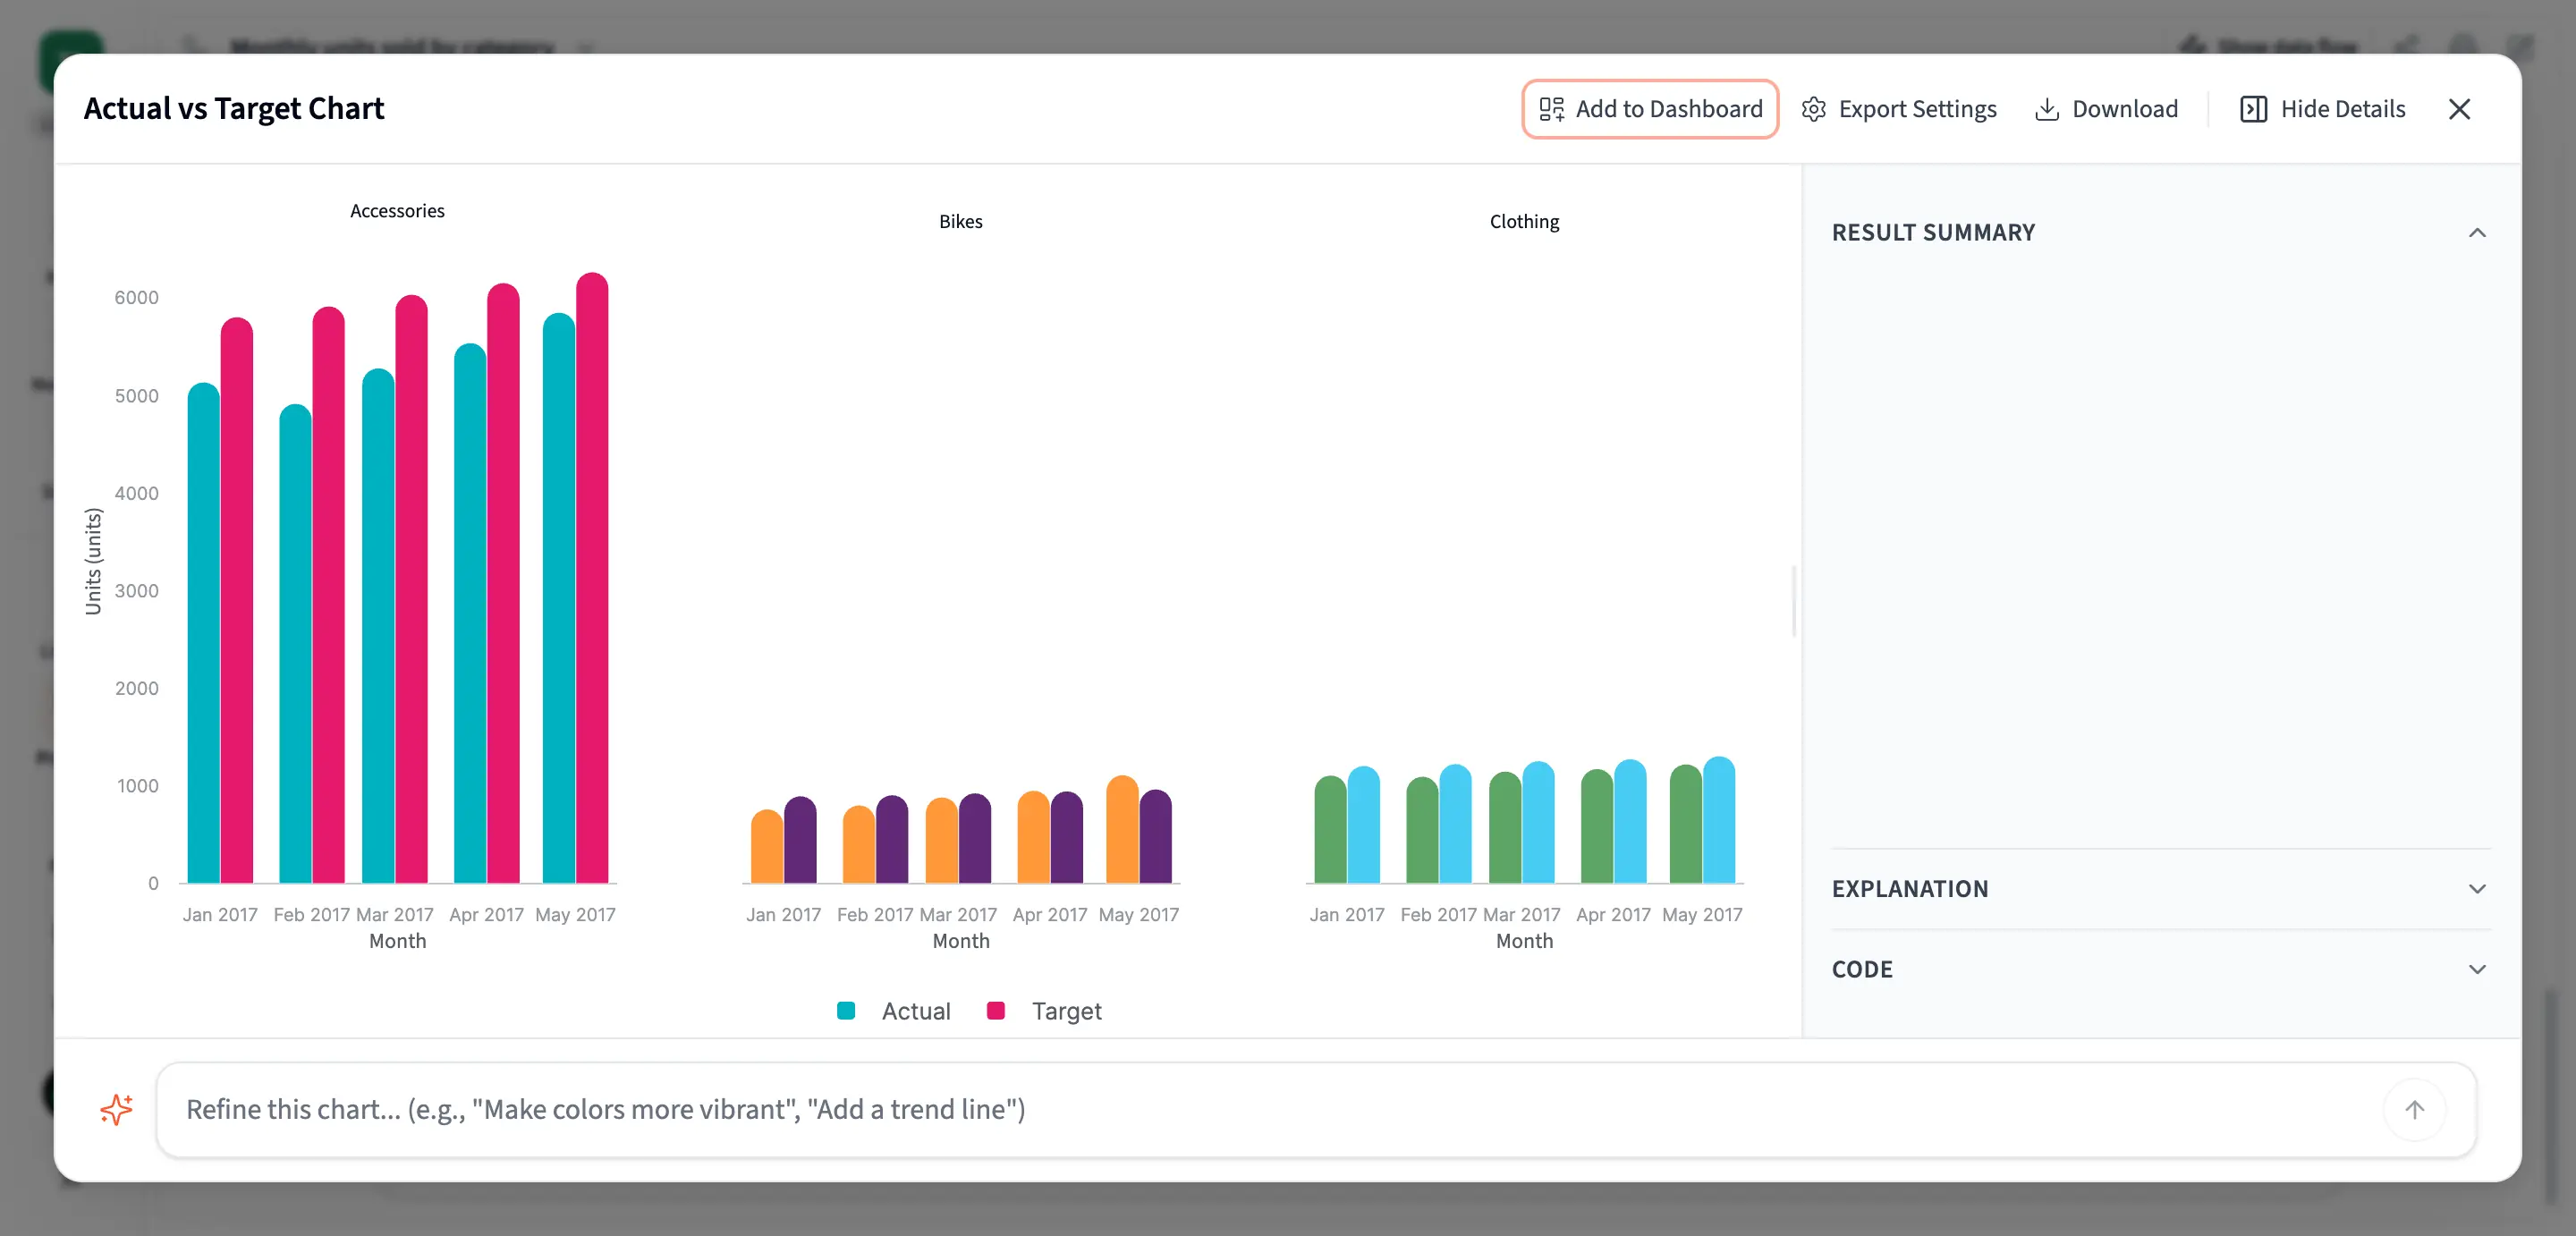
On the messy CSV it returned 45,755: it named the 295 duplicates but kept them and called day-first dates month-first. The fixed retry built a 233-row category-region-month table, not the requested summaries; its query dropped some valid dates and shifted others to the wrong month.
It loaded all 616,506 big-file rows, and all 28 year-by-region values were right. Its written 2016 total was 398,377; its own rows add to 398,530. A retry showed 25 groups while claiming 28.
Pick it if you join several CSV files into charts and will read the numbers, not the summary.
Price (checked 10 Oct 2026): Free, with 15 credits a month, five creator users and 50 MB of storage; Pro $119 a month for five creator users; Team $399 a month for 10; 20% off billed yearly (Querri pricing). Tested on: Free.
Removed: Rows joined Superhuman and announced a 31 May 2026 shutdown. Its app no longer loaded in October.
Each check below comes from something that went wrong in our test.
Next steps: validate a CSV, recover a failed upload, handle a 1 GB file or merge exports.
Your CSV has hundreds of thousands of rows:
Anomaly AI, Claude, Deepnote or Hex counted all 616,506 rows exactly. Avoid 5 MB upload caps.
Your export is messy and the total must be right:
Claude or Hex, on the Excel copy of our data.
You need to join two CSV files:
Querri got the join right; trust its table, not its summary.
You want a dashboard or report:
Anomaly AI. Our analysis and chart test covers dashboards, and our AI report generator comparison covers finished reports.
You want a free, quick look at a clean file:
ChatGPT Free or Better Analyst Free. Re-check totals yourself.
You work in notebooks:
Deepnote or Hex, with the code beside every answer.
If you would rather ask questions across several data sources than analyze one file, see our comparison of tools to chat with your data.
Keep the original. Conversion can change dates, leading zeros and number types. Our XLSX and CSV messy files also had different fourth defects, so an XLSX success does not prove the same CSV will work. Check the row count and totals after any conversion.
Do not choose whichever looks plausible. Add the underlying table, compare it with a known total, and ask which rows were excluded. ChatGPT and Querri demonstrated why a correct chart alone cannot validate the surrounding explanation.
Only if you can preserve how the parts fit together. Check repeated headers, duplicates across parts and matching category labels, then reconcile the combined total. Our test did not establish a reliable split-file workaround for either 5 MB limit.
Keep the prompts, expected checks and original file. Compare the new columns and date formats before rerunning. A saved answer describes the uploaded snapshot; this CSV comparison did not test an automatic connection to next month’s export.
Confirm the required file size, files per chat, export formats and allowance for retries. Test the exact step that stopped you if a trial permits it. We did not verify that paying fixes a wrong answer or a blocked step.
Our benchmark used sample data and did not assess vendor security. Before uploading work data, check your organisation’s approval, the vendor’s retention and training terms, access controls and deletion process. Start with a non-sensitive sample.
A chart is only the start. Check file limits, duplicate handling, dates and whether the written answer agrees with the numbers.
Anomaly AI counted the large file correctly but missed the messy-file problems. Choose for your actual file and verify a total you already know before relying on the result.
Technical Product Manager, Data & Engineering
Ash Rai is a Technical Product Manager with 5+ years of experience building AI and data engineering products, cloud and B2B SaaS products at early- and growth-stage startups. She studied Computer Science at IIT Delhi and Computer Science at the Max Planck Institute for Informatics, and has led data, platform and AI initiatives across fintech and developer tooling.
LinkedInContinue exploring AI data analysis with these related insights and guides.
Leaving Tableau as a small team? Match the replacement to which part of Tableau you keep and which cost, setup, or specialist burden you are trying to shed.
There is no single best Looker Studio alternative for GA4 reporting — the right move depends on the limit you have hit. A decision guide by constraint.

If you want answers, dashboards, reports, and alerts without dragging nodes across a workflow canvas, Anomaly AI is built for that.