Hands-on runs conducted by Anomaly on 9–10 November 2026. The five BI workflows were built manually; Python and R ran as scripts, and DuckDB ran SQL. The records below preserve the selected surface and output for each run.
The six-sheet AdventureWorks-derived workbook contains 56,046 sales rows and 1,809 return rows. Units sold means SUM(OrderQuantity). Category return rate means 100 × returned units ÷ sold units. Returns lack an original order identifier, so this is a ratio across the file, not a rate for a matched group of purchases. The sales sheet has no transaction sale price, so these examples report units rather than revenue. The 2017 data ends in June.
Components has no sold units, so its return rate is undefined. Some views represent its quantities as blanks and others as zero. Bikes has the highest category ratio. Sales total 84,174 units across years, categories and regions.
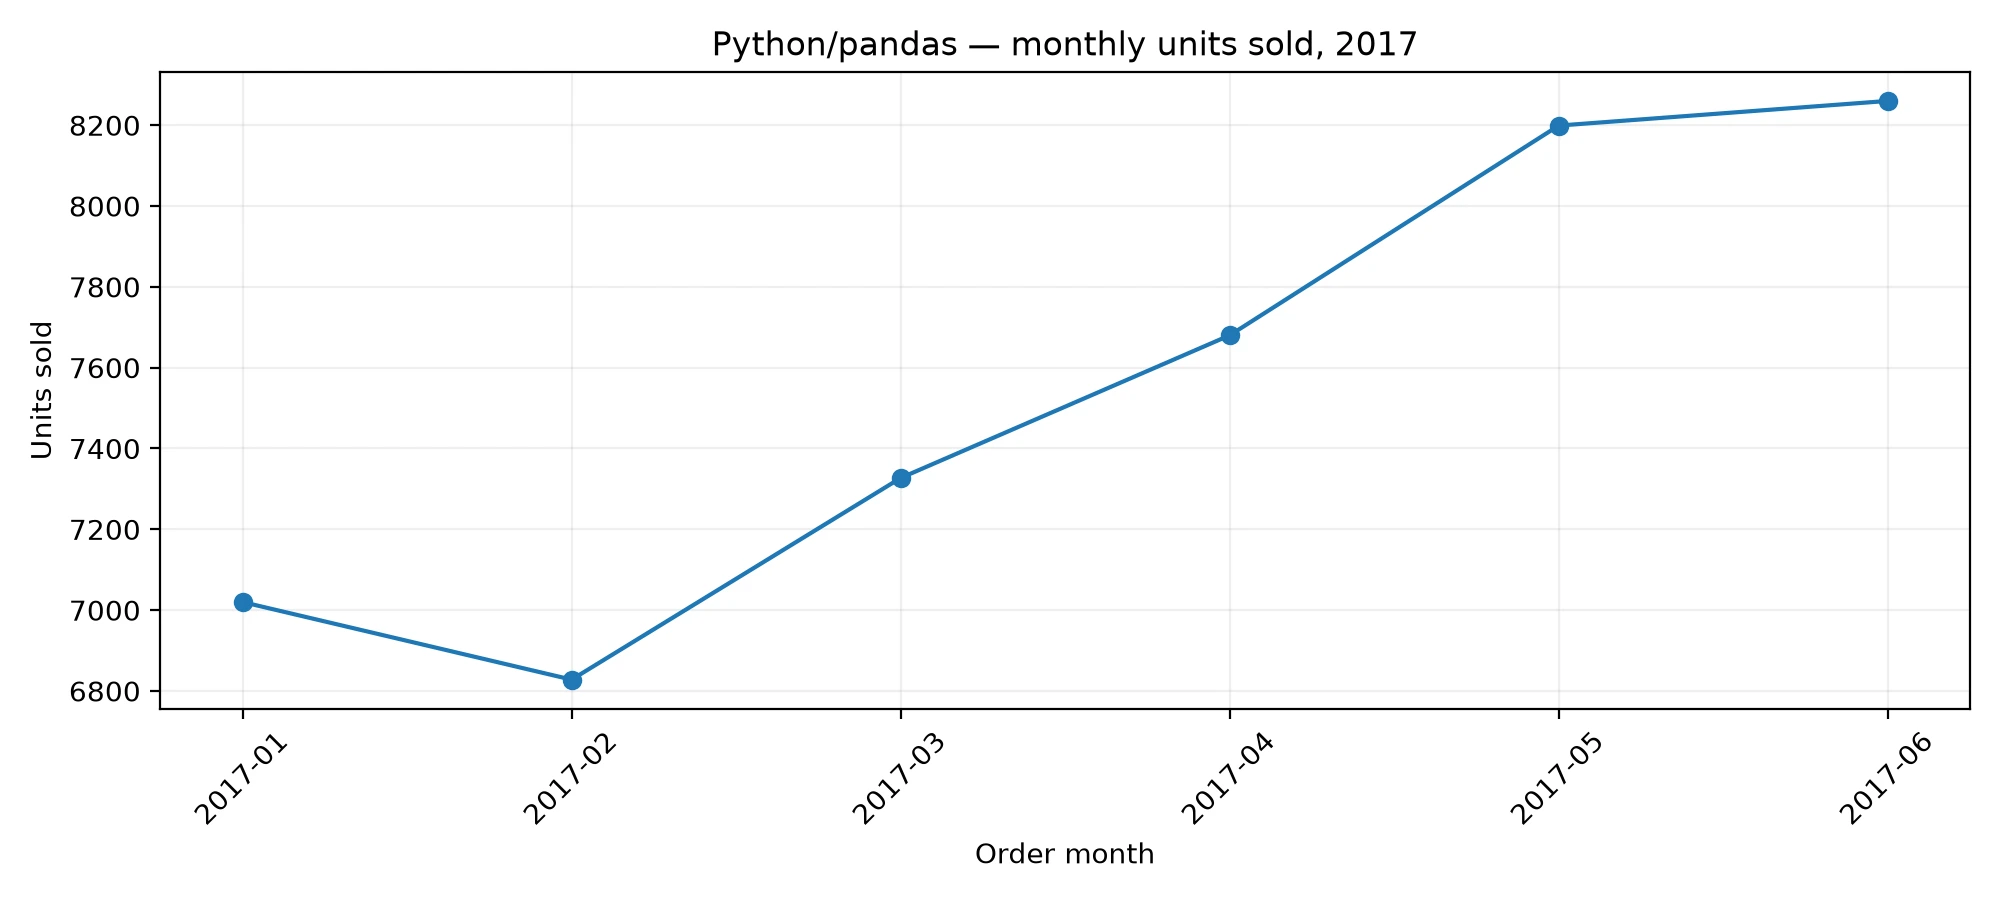
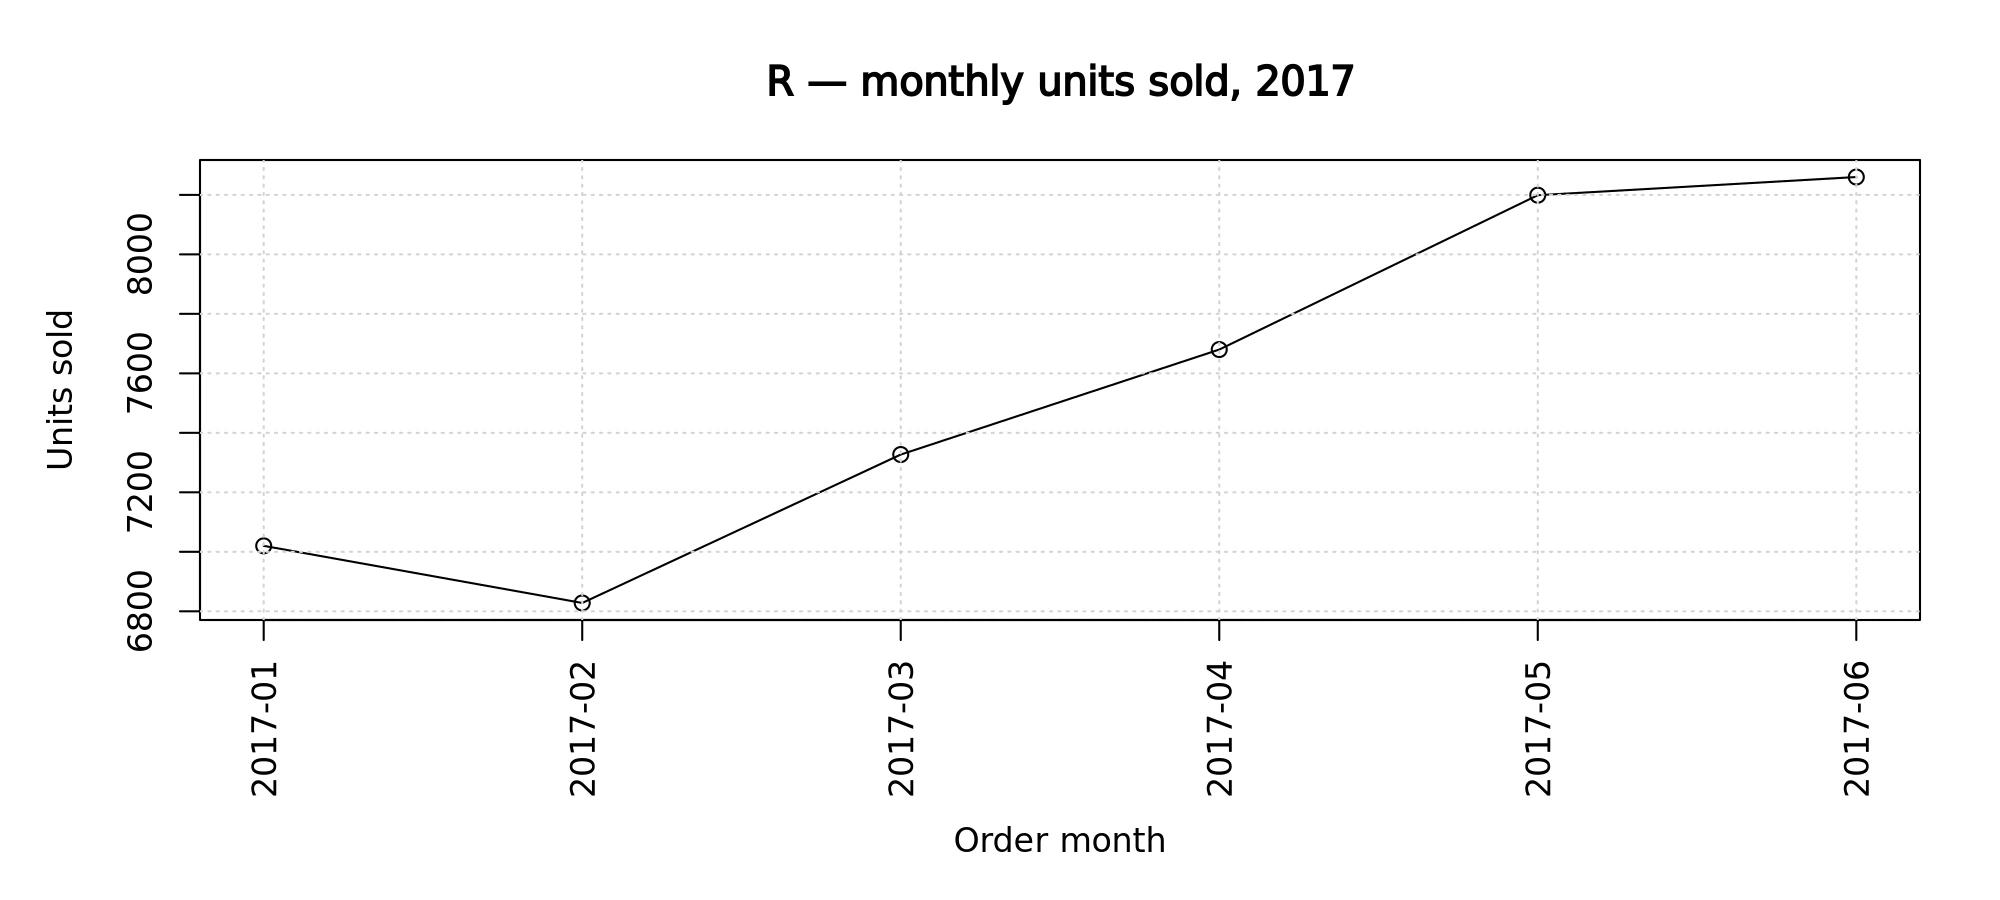
Month
Units sold
2017-01
7,020
2017-02
6,828
2017-03
7,327
2017-04
7,680
2017-05
8,199
2017-06
8,260
What each run required
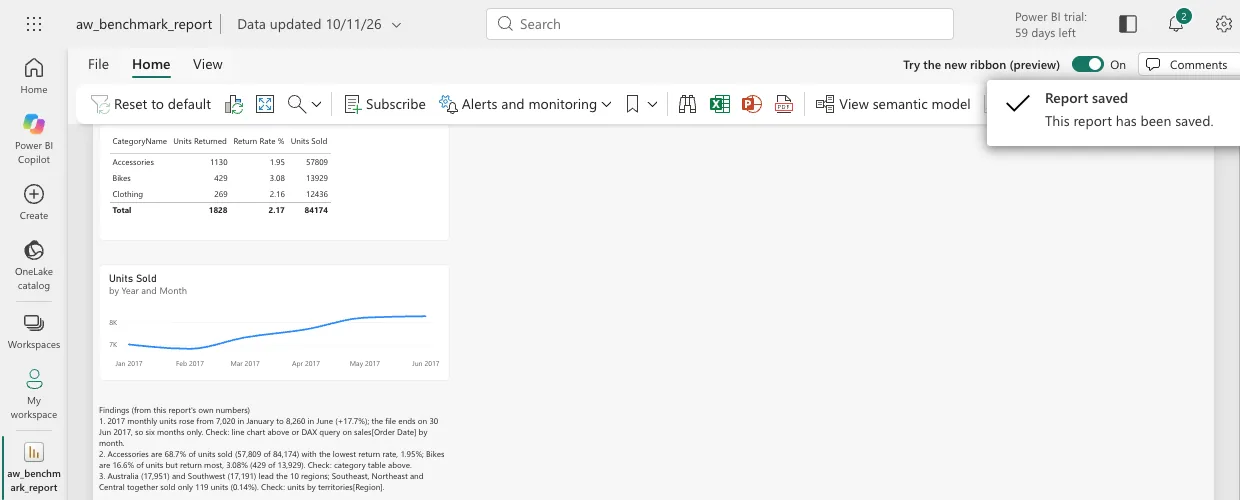
Power BI service
Browser; 60-day Power BI trial; 2026-11-10.
Original XLSX copied to SharePoint and loaded through Power Query. One missing territory relationship and text dates were repaired; calculations used DAX.
Output: Monthly line chart, findings and PDF report.
Saved output from the dated run.
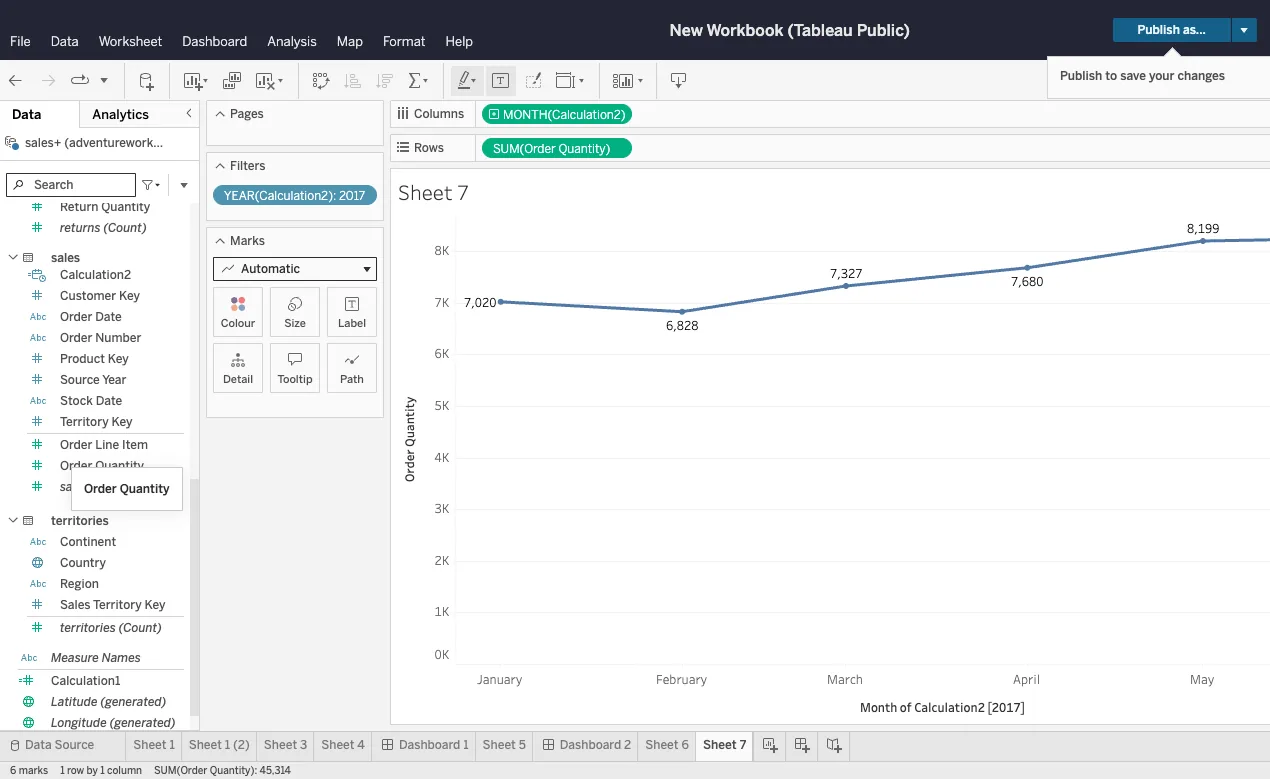
Tableau Public
Free web authoring; 2026-11-10.
Two relationships and text-date conversion were configured manually. Saving uses a public profile; the workbook was kept as an authoring session and the dashboard exported.
Output: Monthly line chart, findings dashboard and PDF.
Saved output from the dated run.
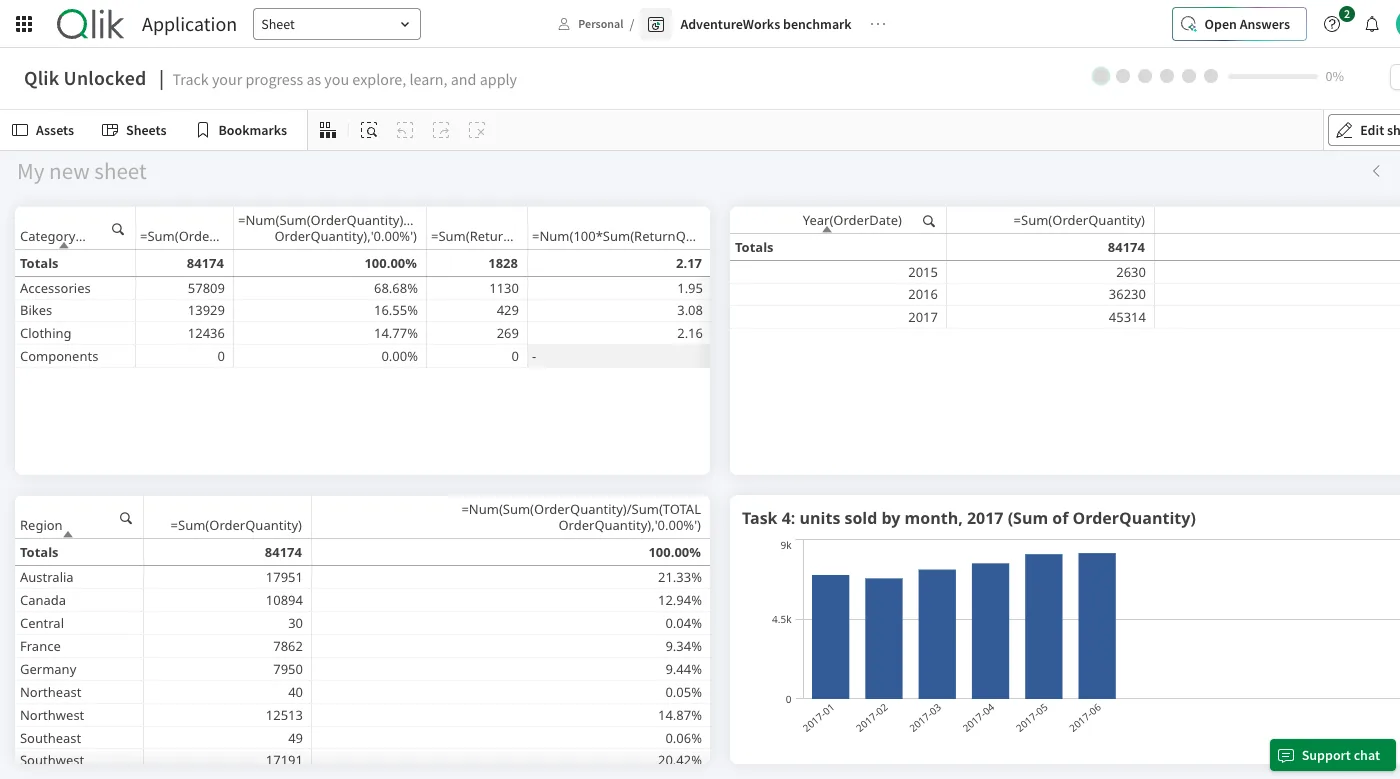
Qlik Cloud Analytics
Browser; 30-day Premium trial; 2026-11-10.
Suggested associations linked returns through regions rather than products. Eight load-script lines re-keyed the returns table.
Output: Monthly bar chart, tables and a generated PDF saved separately from the download button.
Saved output from the dated run.
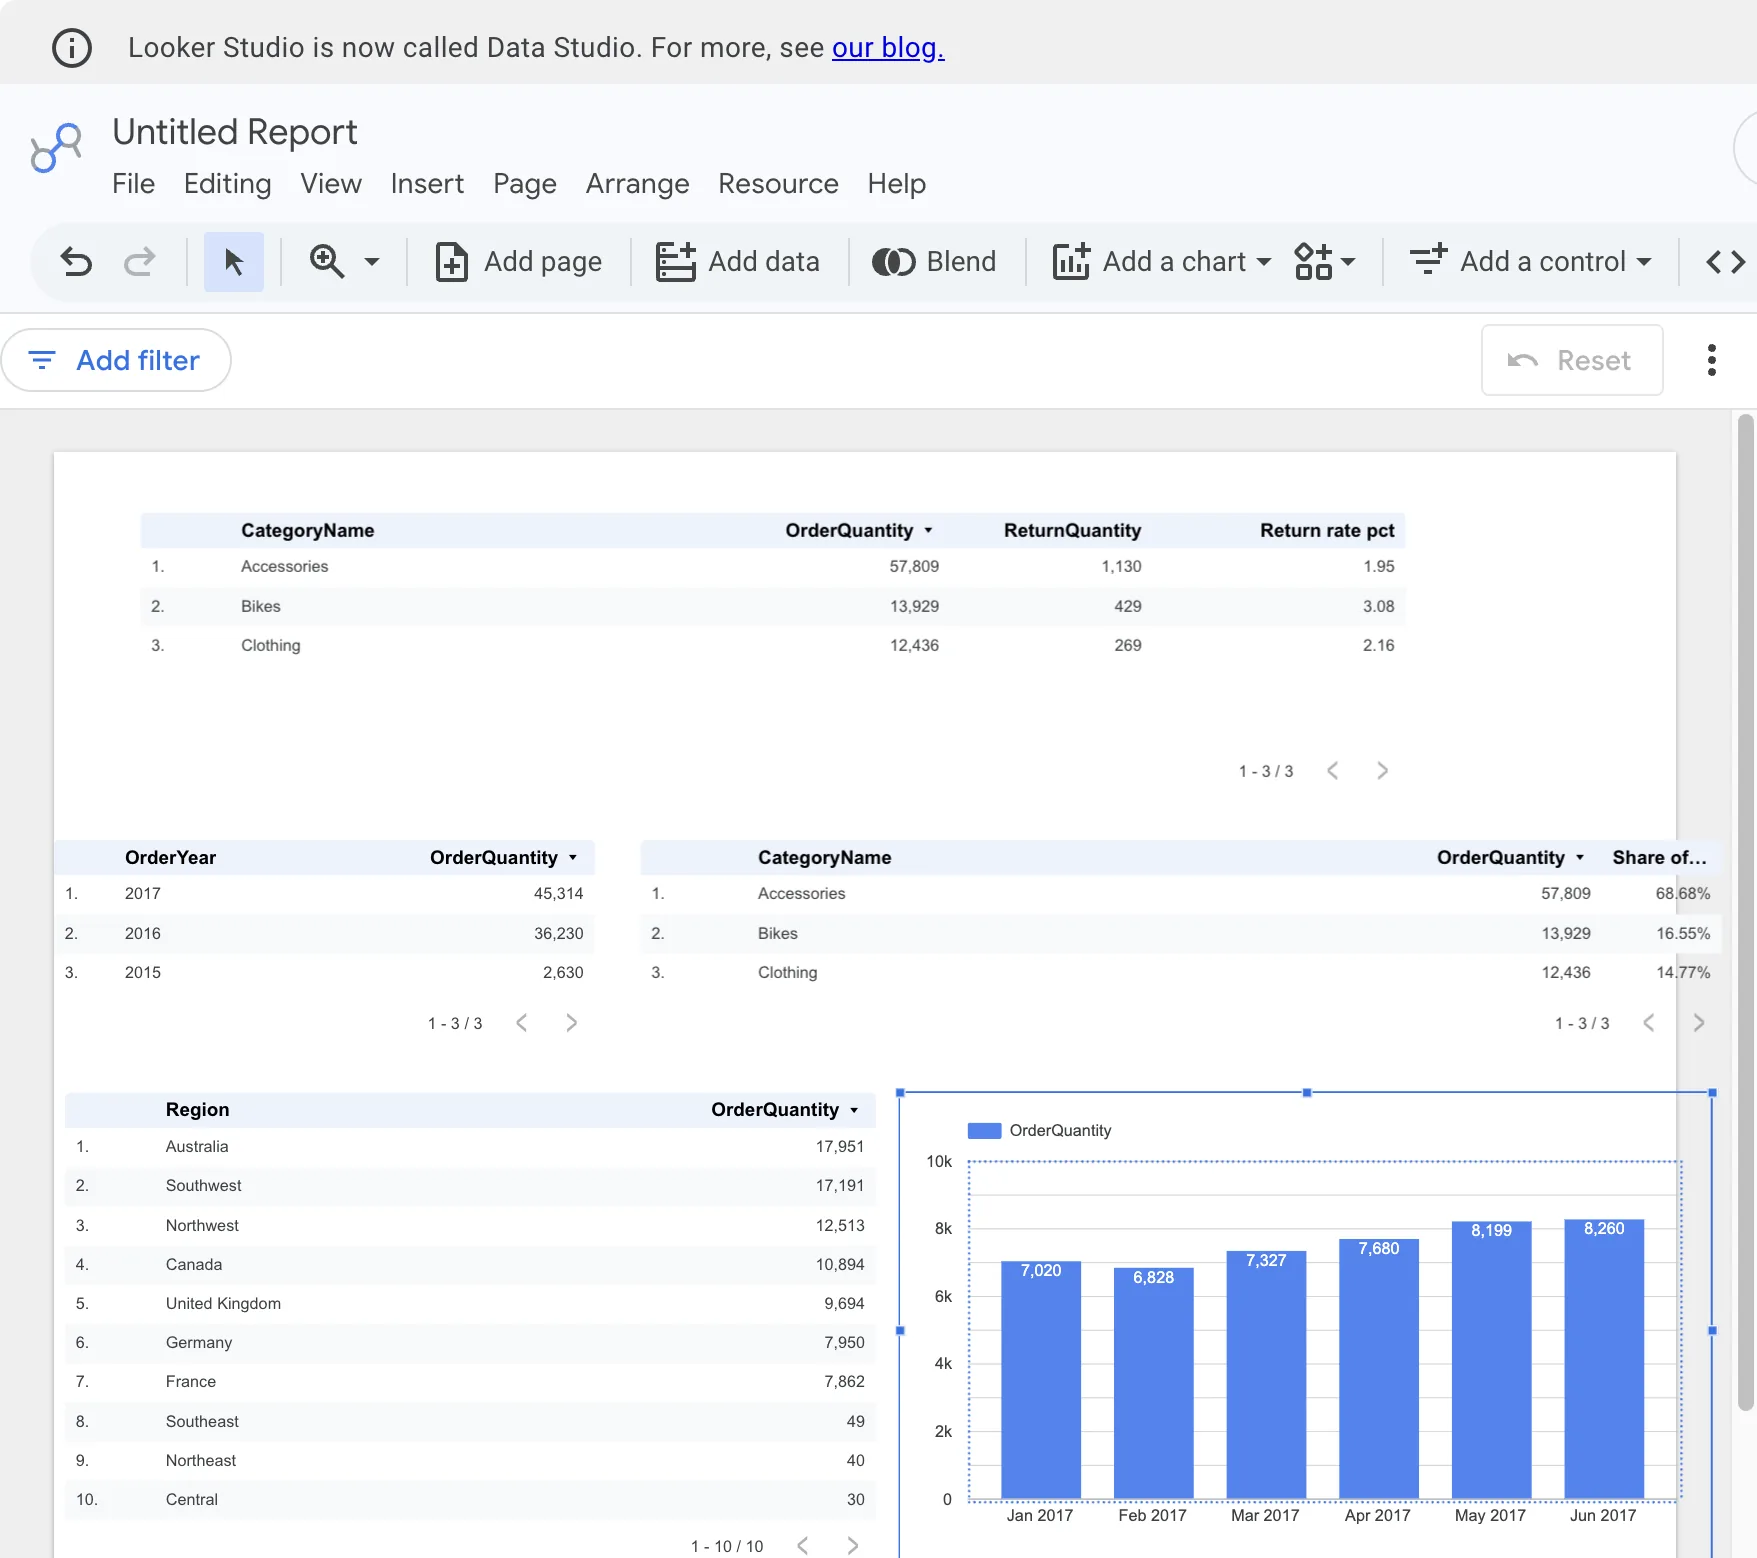
Looker Studio
Free browser reporting; 2026-11-10.
Original XLSX loaded through the Excel connector. Two chart-level blends combined the sheets; monthly sorting and date grouping were configured.
Output: Monthly bar chart, tables, findings and a two-page PDF.
Saved output from the dated run.
KNIME Analytics Platform
Free desktop application; 2026-11-10.
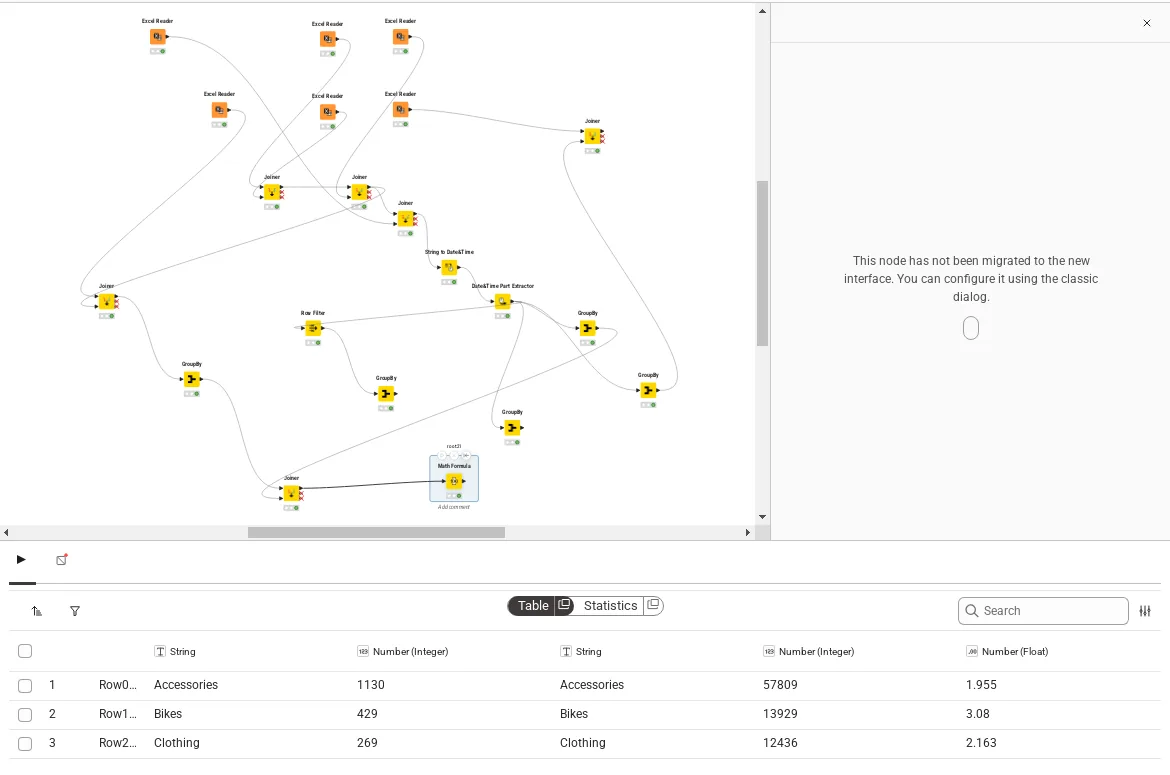
Reader, Joiner, date conversion, GroupBy and formula steps were configured manually. Category shares used the fixed total 84,174.
Output: Line chart with row-number labels, PNG and return-rate CSV.
Saved output from the dated run.
Python / pandas
Native script; 2026-11-09.
pandas imported the six sheets. The script checked keys, joined dimensions, aggregated sales and returns, and used a plotting library.
Output: Monthly chart and five answer CSVs.
Saved output from the dated run.
R
Native script; 2026-11-09.
readxl imported the workbook; the R script joined dimensions, aggregated sales and returns, and plotted the monthly series.
Output: Monthly chart and five answer CSVs.
Saved output from the dated run.
DuckDB SQL
Native SQL engine; 2026-11-09.
Python imported the original workbook into six DuckDB tables. SQL performed the business calculations.
Output: Monthly table and answer CSVs; charting is a separate step.
Anomaly's separate Python example
On 9 November 2026, the production Free account executed agent-written Python against a small synthetic file. An exact supplied Python expression also returned 52. The nine-row input reduced to seven cleaned records, 18 units and 173.50 in sales under the stated rules: remove exact duplicate copies and blank order IDs, trim and normalize region names, and multiply units by unit price.
The input CSV, cleaned CSV and reference calculation script let you check those rules. Run the reference as python clean-sales.py sales-base.csv --output-dir results. This is a separate small-file example.