Data Analysis
15 min
Bank Reconciliation: Worked Example With Practice Files
Learn bank reconciliation step by step with downloadable practice files. Match transactions, calculate adjusted balances, and investigate differences.
Read More
Data Analysis — Tool comparison · 2026
Compare 12 data analysis tools by how much work each takes to get a correct answer, what to watch for and what it costs.
 Updated 21 min read
Data analysis tools are the software people use to clean, calculate, chart and share data. Most data analytics tools fall into four types: spreadsheets such as Excel and Google Sheets, business intelligence (BI) tools such as Power BI and Tableau, code such as Python, R and SQL, and AI assistants. Below we compare 12 of them, from free data analysis software to paid platforms, by how much work each takes to get a correct answer, what to watch for and what it costs, using our own tests where we have them.
Quick answer — choose by the work
These use cases overlap, and one tool can support several of them.
Already decided on AI? See our AI data analysis tools comparison.
| Tool | Best for | Effort to a correct answer | Accuracy in our test | From |
|---|---|---|---|---|
| Excel / Power Query | Calculations people check in cells | Medium: formulas and saved Power Query steps | Not tested; from Microsoft’s docs | Free on the web; $9.99/mo |
| Google Sheets | Small shared reports | Low: formulas in a shared sheet | Correct | Free; $7/user/mo |
| Power BI | Recurring dashboards | High: data model and DAX, about 1¼ hours in our test | Correct after fixing a missing link and text dates | Desktop free; $14/user/mo |
| Tableau | Visual exploration | Medium: link tables and fix dates by hand, about 45 minutes in our test | Correct after linking tables by hand | Free edition; $75/user/mo |
| Python / pandas | Custom rules you rerun | High: write and maintain code | Correct; depends on your code | Free |
| R | Statistics | High: code and statistics knowledge | Correct; depends on your code | Free |
| Anomaly AI | Large or messy business data, recurring reports | Low: upload or connect, ask in plain language | Correct; one export needed a retry | Free; Pro $25/mo |
| ChatGPT | Exploring a file | Low: ask in plain language | Correct on paid; Free plan ranked a category wrong | Free; $20/mo |
| Claude | An editable workbook from a request | Low: ask in plain language | Correct | Free; $20/mo |
| Gemini | Spreadsheet questions | Low: ask in plain language | Two figures wrong | Free; $19.99/mo |
| Copilot in Excel | AI inside your workbook | Low, on an eligible Microsoft 365 plan | Not tested; from Microsoft’s docs | $21/user/mo add-on |
| Julius | A dedicated chat for your file | Low: ask in plain language | Hit a usage limit | Free; $20/mo |
What we found: the classic tools we tested took the most setup but gave correct numbers once the tables were linked and the dates fixed. Power BI took our tester about an hour and a quarter, Tableau about 45 minutes. The AI assistants needed almost no setup, but their accuracy varied: Claude's totals were right, ChatGPT's Free plan ranked a category wrong, and Gemini got two figures wrong, so check one total by hand whichever you choose. Prices run from free (Sheets, Python, R and the free editions of Power BI and Tableau) to $75 a user a month for a Tableau Creator licence.
Tools are grouped by type, not ranked. Times come from our own tests, which AI agents ran for us. They show which tools take more work, not how long a person would need.
Prices are in US dollars and were checked on each vendor’s pricing page in November 2026. Confirm taxes and the offer for your country before buying.
Check AI-generated answers and files before sharing.
The best data analysis tools for you depend on the person receiving the work. This comparison spans four categories: spreadsheets for calculations people inspect in cells; business intelligence (BI) and reporting for shared views people filter; code and statistics for methods an analyst maintains; and AI-assisted analysis for requesting summaries, working and files in a conversation. Some tools cross categories. Choose the deliverable and its owner before comparing features.
Check six things before choosing:
Data rules come first. If a file cannot leave your organisation’s approved environment, rule out unsuitable services before uploading it. Check the exact account, contract, retention rules and recipient permissions. A familiar brand or a public security statement does not establish approval for your dataset.
Anomaly is our product. AI agents working for Anomaly ran a sales and returns analysis in each tool we could access, and we checked every total against figures we calculated ourselves, keeping the mistakes as well as the correct answers. The test data includes duplicate orders and a category with no sales, to see whether each tool handles them correctly.
The AI assistants worked on a five-sheet sales and returns workbook, and the classic tools on a larger sales workbook. You can download both: the AI test workbook and answers (ZIP) and the classic-tool workbook and results.
Effort: Medium: formulas and saved Power Query steps
Accuracy in our test: Not tested; from Microsoft’s docs
From: Free on the web; $9.99/mo
Excel fits work where the workbook itself is the deliverable: budgets, reconciliations and calculations colleagues review in cells. A finance or operations analyst can follow inputs and formulas rather than receive only a chart.
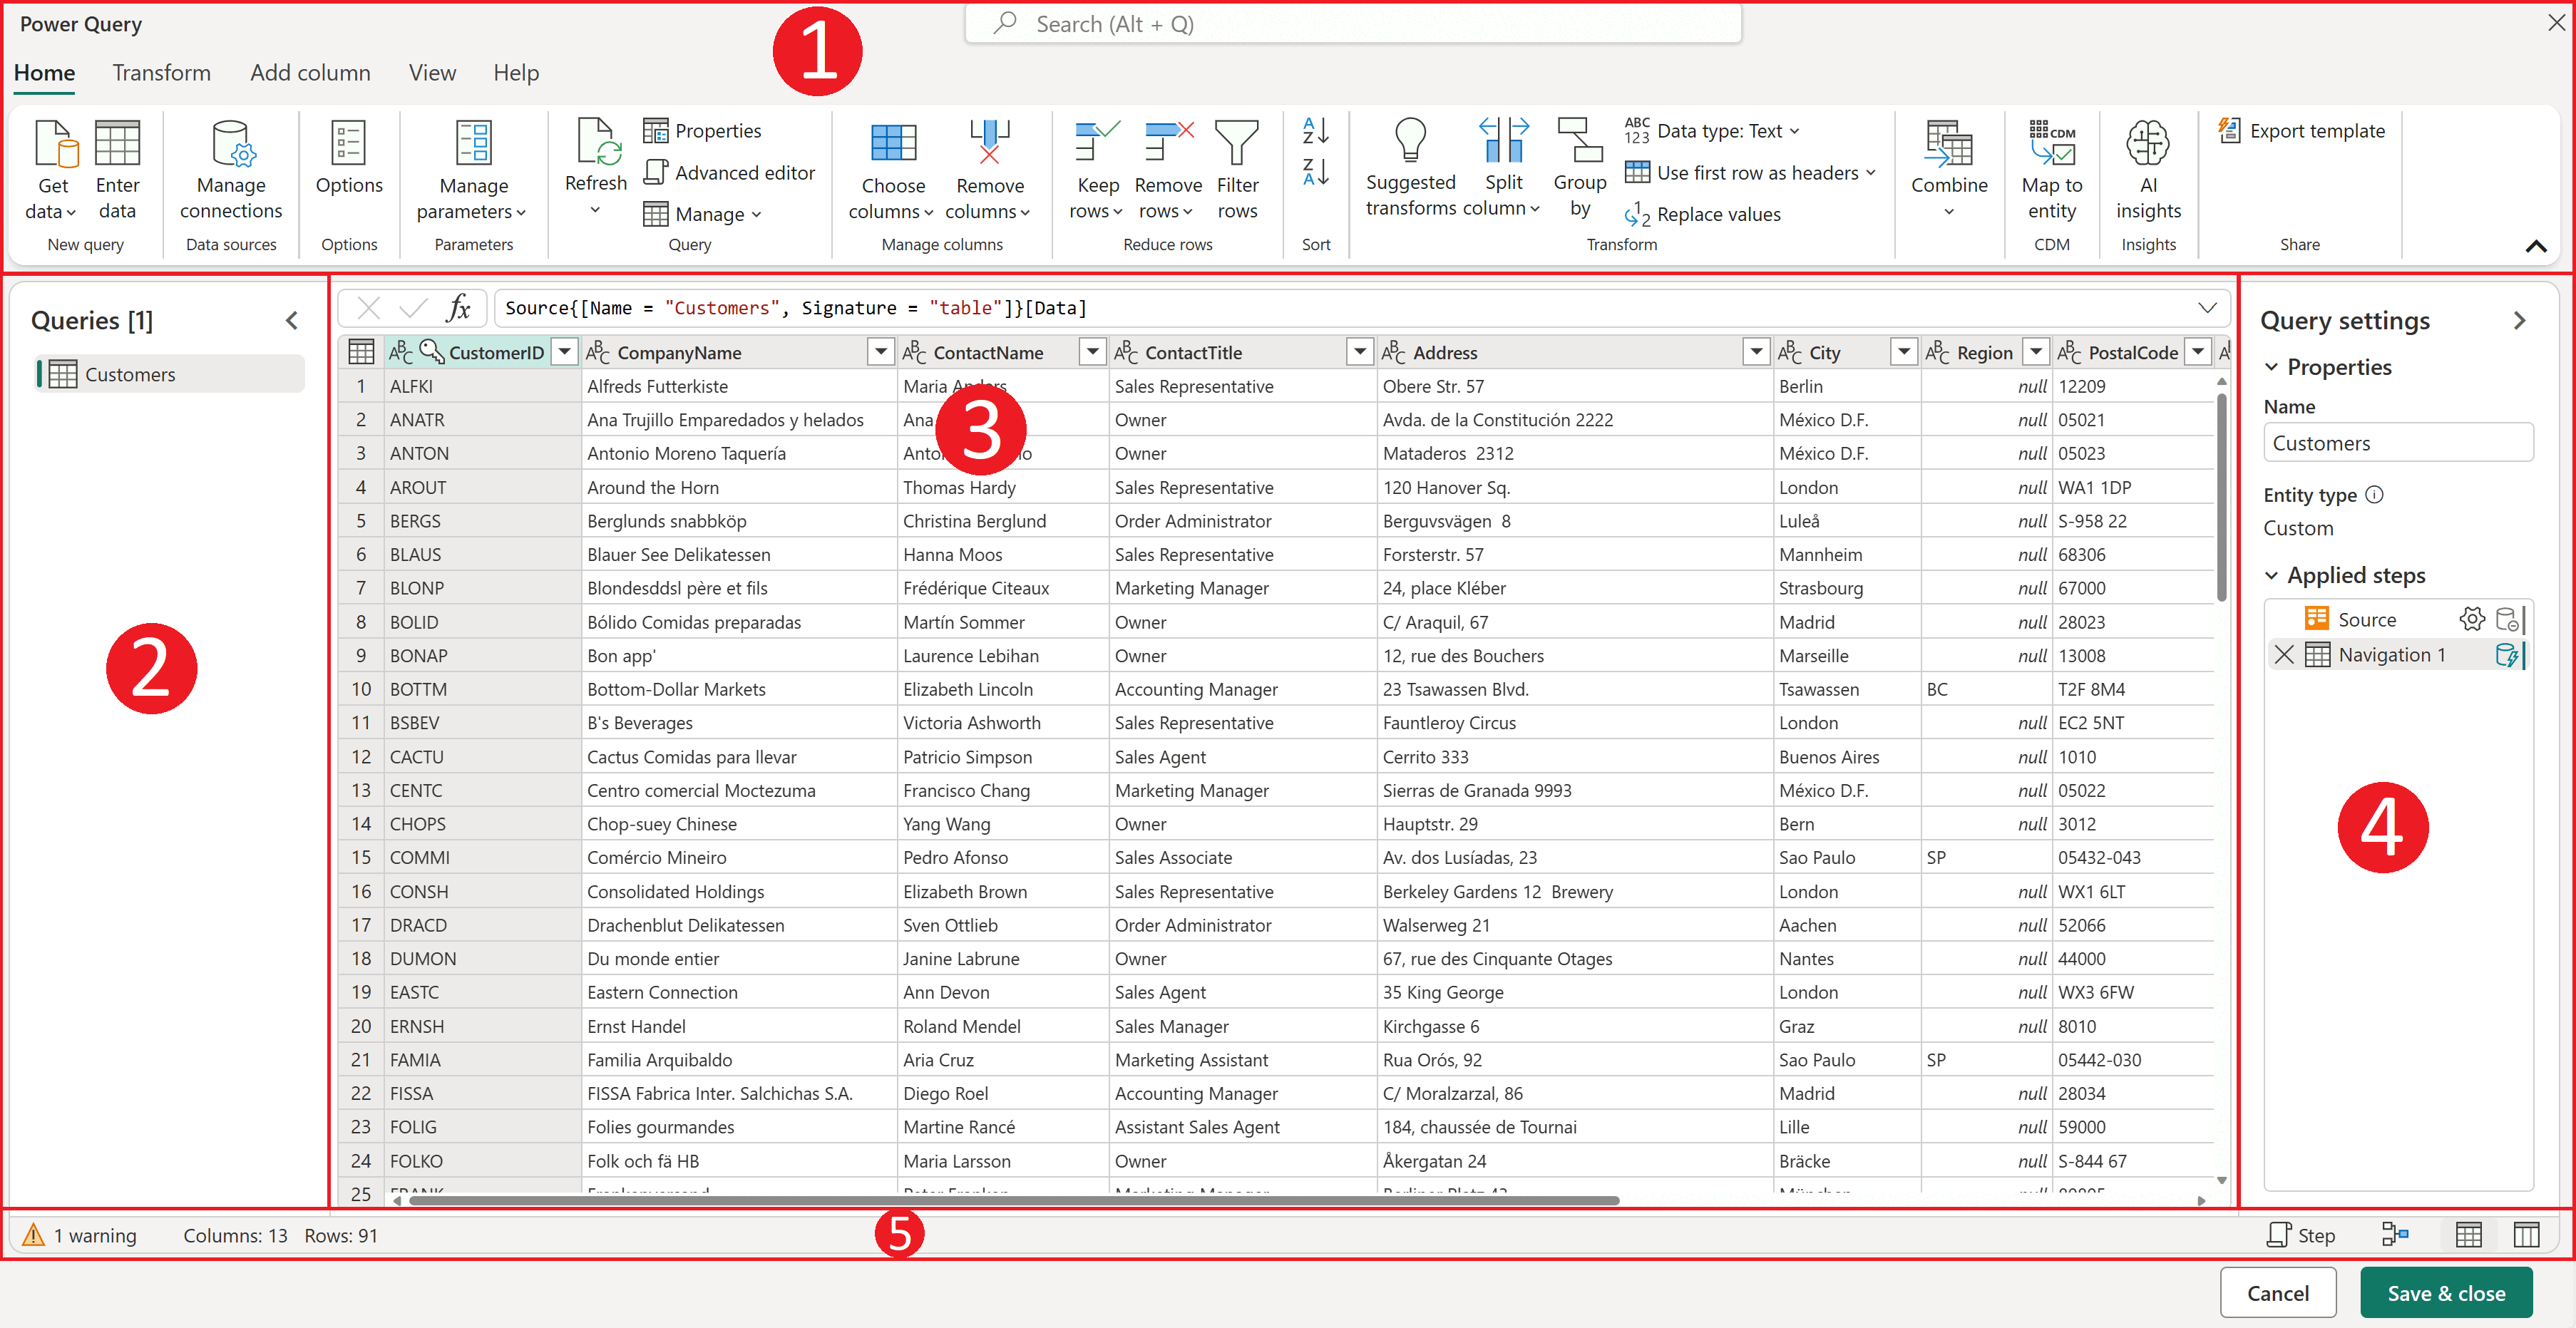
Power Query adds saved preparation steps: connect to a source, reshape records and refresh the query later. Check the features available in your particular Excel edition and operating system; the product name alone does not settle that question.
The maintenance job belongs to someone who understands the formulas and preparation steps, especially when a new file changes its columns. Our Excel analysis guide explains the workflow.
Before buying, try the actual source file and required preparation steps, then change one known input and inspect the result.
Price: Excel for the web has a free route. As a US individual subscription example, Microsoft 365 Personal includes desktop Excel at the standard $9.99/month or $99.99/year, excluding introductory offers. Business licensing is separate. Do not assume an existing web editor includes every desktop or preparation feature you need.
Power Query Online: saved preparation steps
Effort: Low: formulas in a shared sheet
Accuracy in our test: Correct
From: Free; $7/user/mo
Google Sheets suits a small shared report that colleagues need to inspect and edit in cells. Give one person responsibility for formulas and access permissions, and decide whether recipients only need to view, edit or make their own copy.
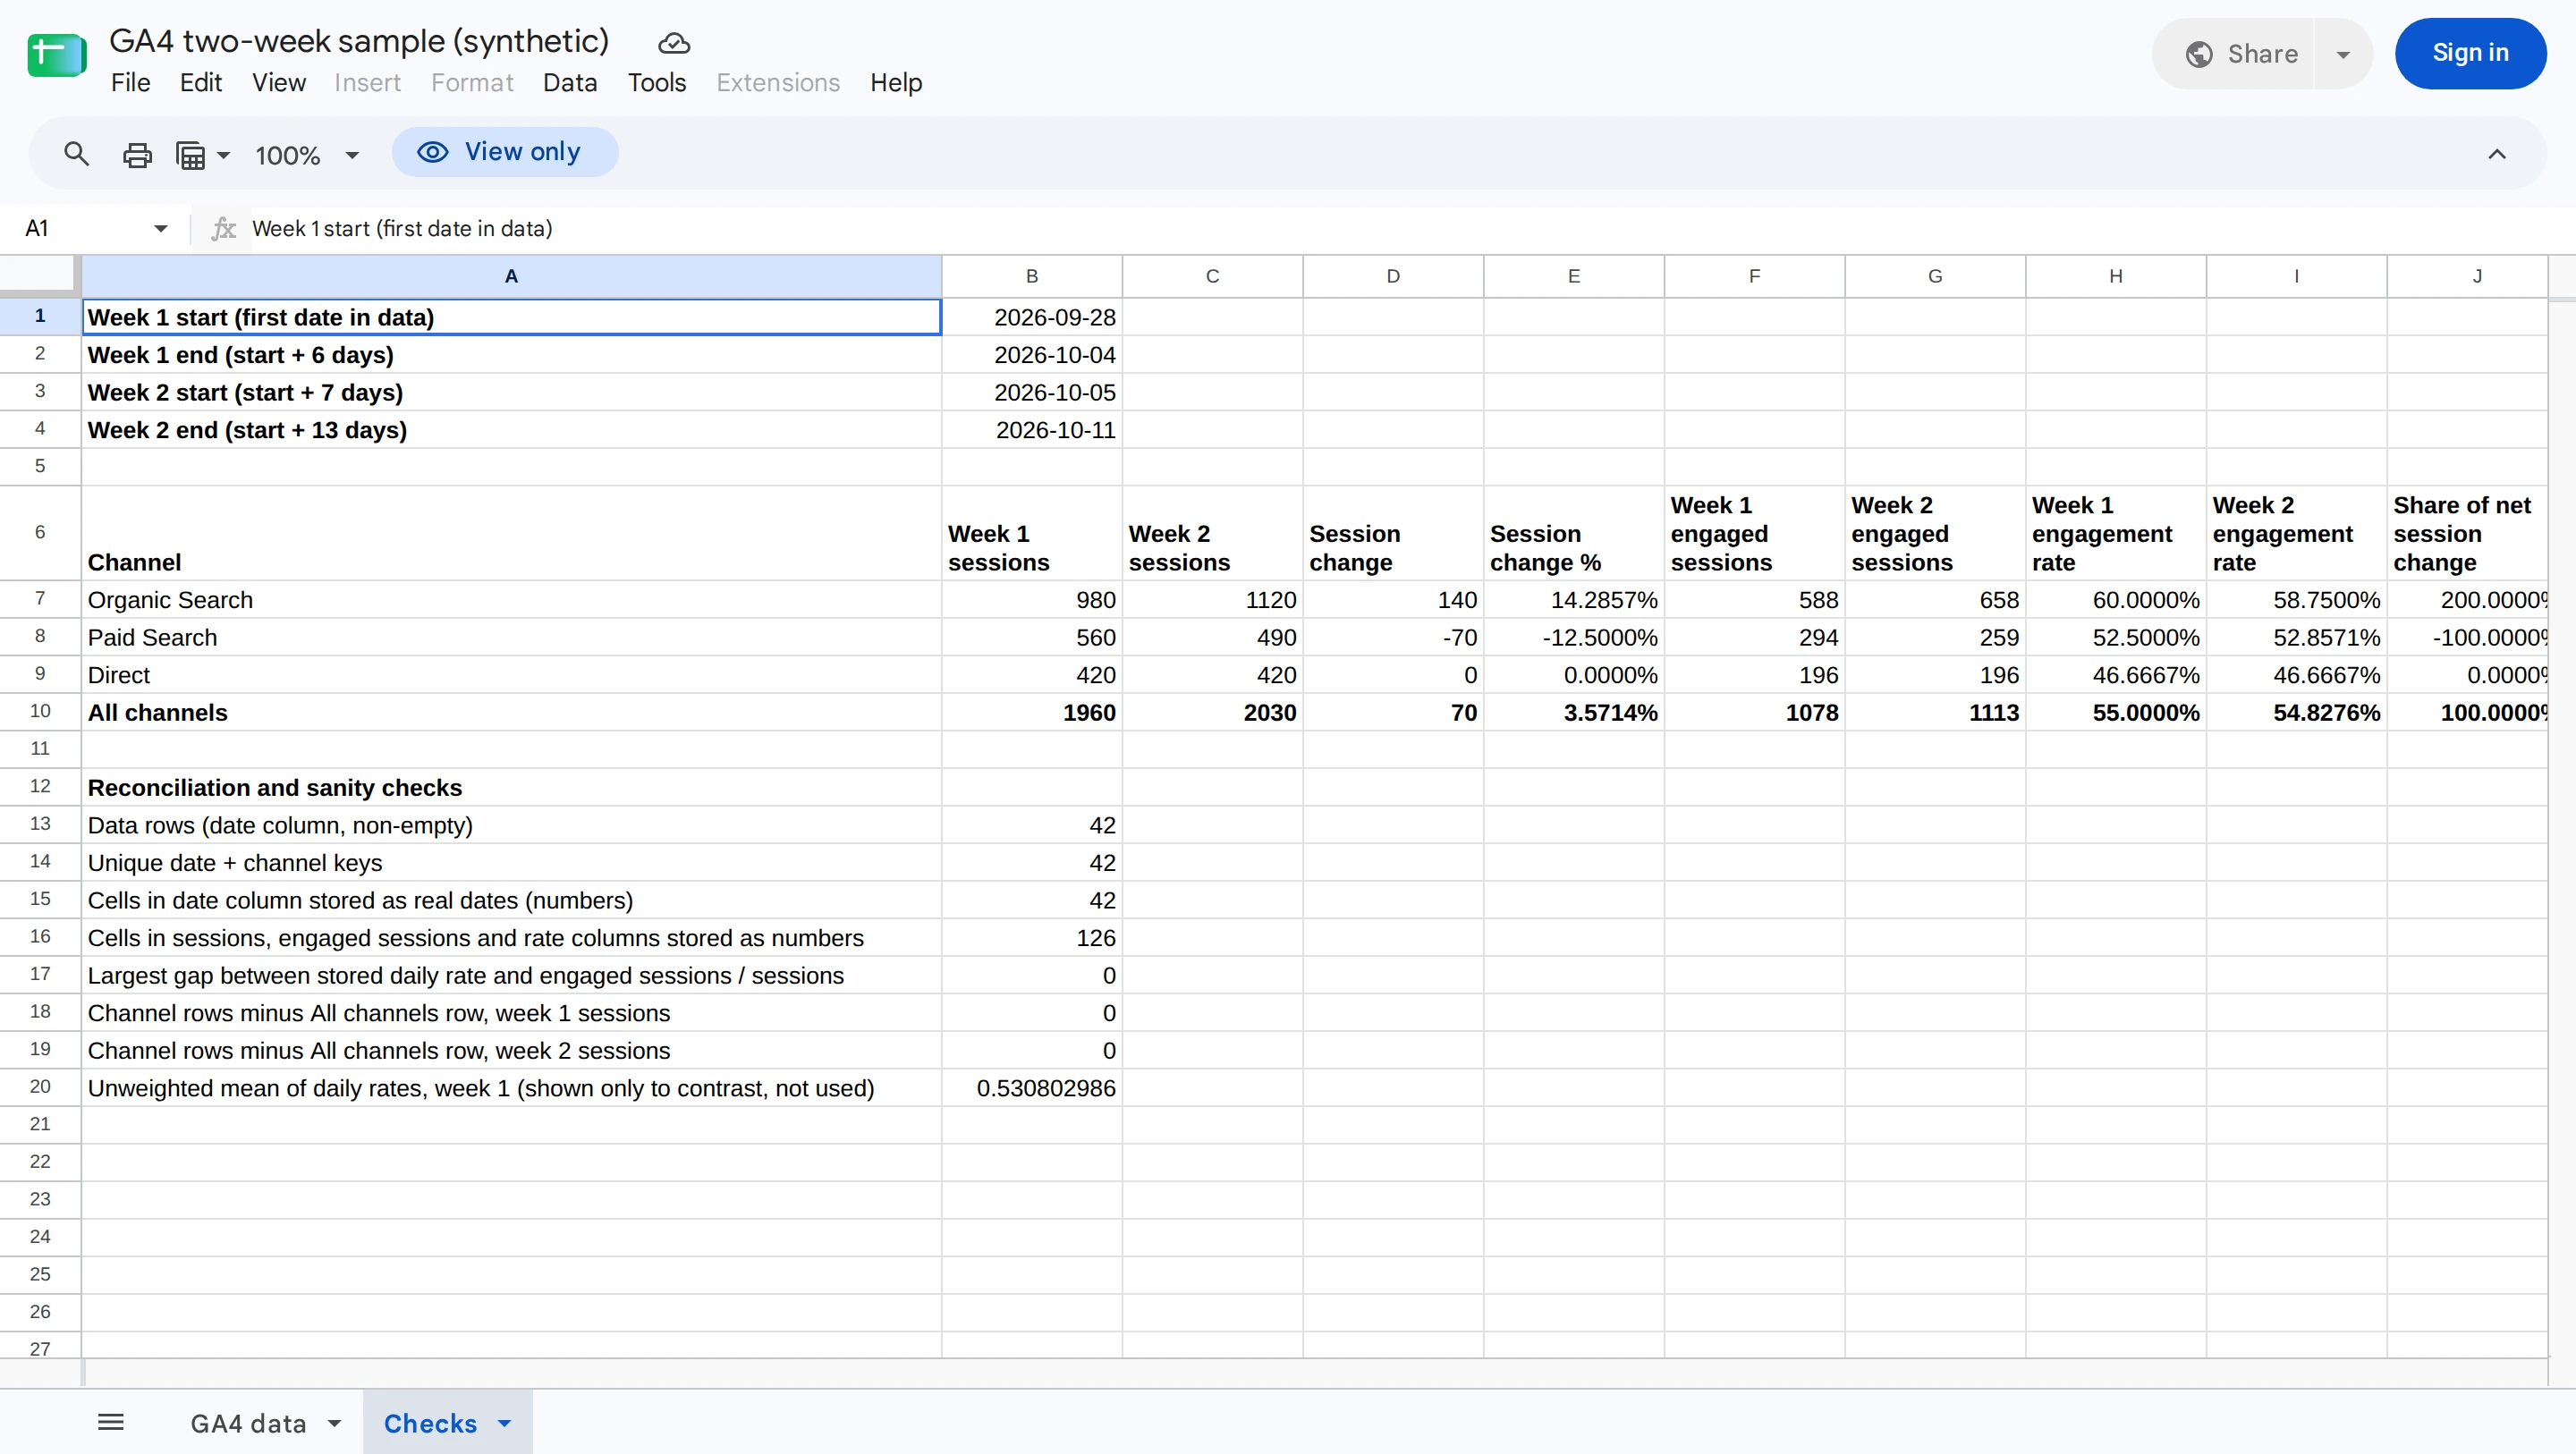
In our test, a sheet compared two weeks of website traffic across three channels. Its formulas showed sessions rising from 1,960 to 2,030, with one channel up 140 sessions and another down 70.
The formulas gave the right answers, and the sheet could be viewed publicly and exported. Making a copy required a Google sign-in.
That was a small sheet of 42 rows, so test your own file if it is much larger.
For this job, the deliverable is a shared spreadsheet with visible working. Check permissions and the copy/export path with the intended recipient before relying on it. The worked Sheets example explains the calculation in context.
Price: Google documents personal Sheets use with a Google Account. Workspace Starter lists a $7/user/month base price with a one-year commitment.
A small shared formula report
Effort: High: data model and DAX, about 1¼ hours in our test
Accuracy in our test: Correct after fixing a missing link and text dates
From: Desktop free; $14/user/mo
Power BI is a candidate for recurring reports that several colleagues need to filter using shared definitions. Microsoft’s Power BI overview distinguishes Desktop report creation from the online publishing and sharing service.
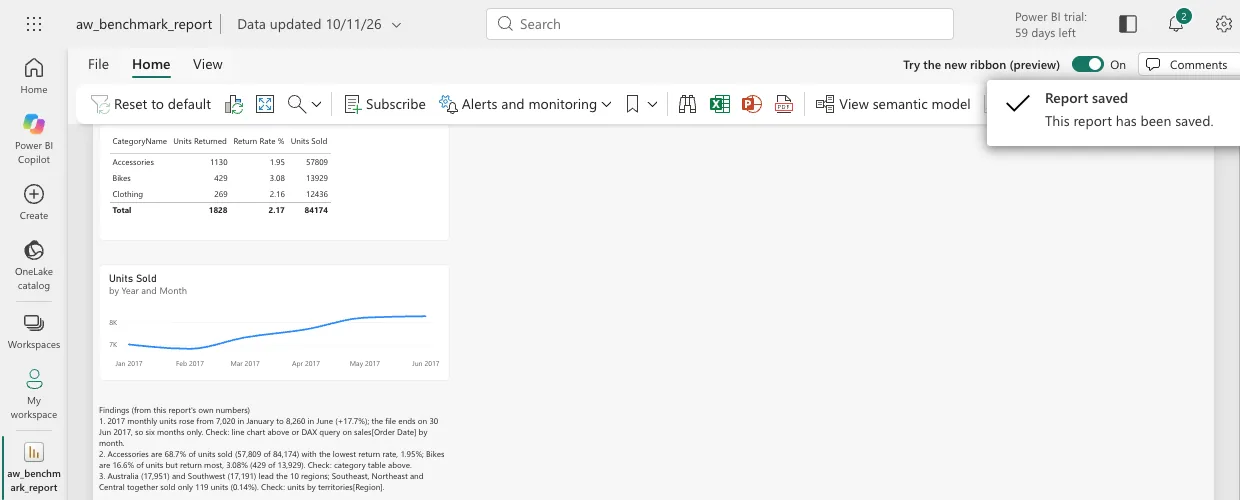
Getting to correct numbers took our tester about an hour and a quarter. In the browser, the workbook first had to be saved to OneDrive or SharePoint, and the free licence couldn't open the data model, so we started a 60-day trial. Power BI didn't link the territory table on its own, and the dates came in as text; we fixed both by hand and wrote DAX measures. After that, the totals, return rates and monthly figures were right, and the report exported as a PDF with a line chart.
The work includes more than arranging charts. Someone must define how tables relate and how measures, such as sales after refunds, are calculated. A measure is a saved calculation used by the report. A clear model makes those definitions reusable; a wrong relationship can repeat a transaction and inflate a total.
Choose it according to who will maintain that model and who receives the report. A business analyst owns the table relationships and measures; recipients need access to the intended views. Confirm that the source can refresh under your company’s rules, and include publishing and viewing in the buying check.
Price: Desktop is free; Pro is $14/user/month, paid yearly. Copilot needs separately paid qualifying Fabric or Power BI capacity; a Pro license alone does not include it. Budget for the actual publishing and viewing arrangement, not just the author’s installation.
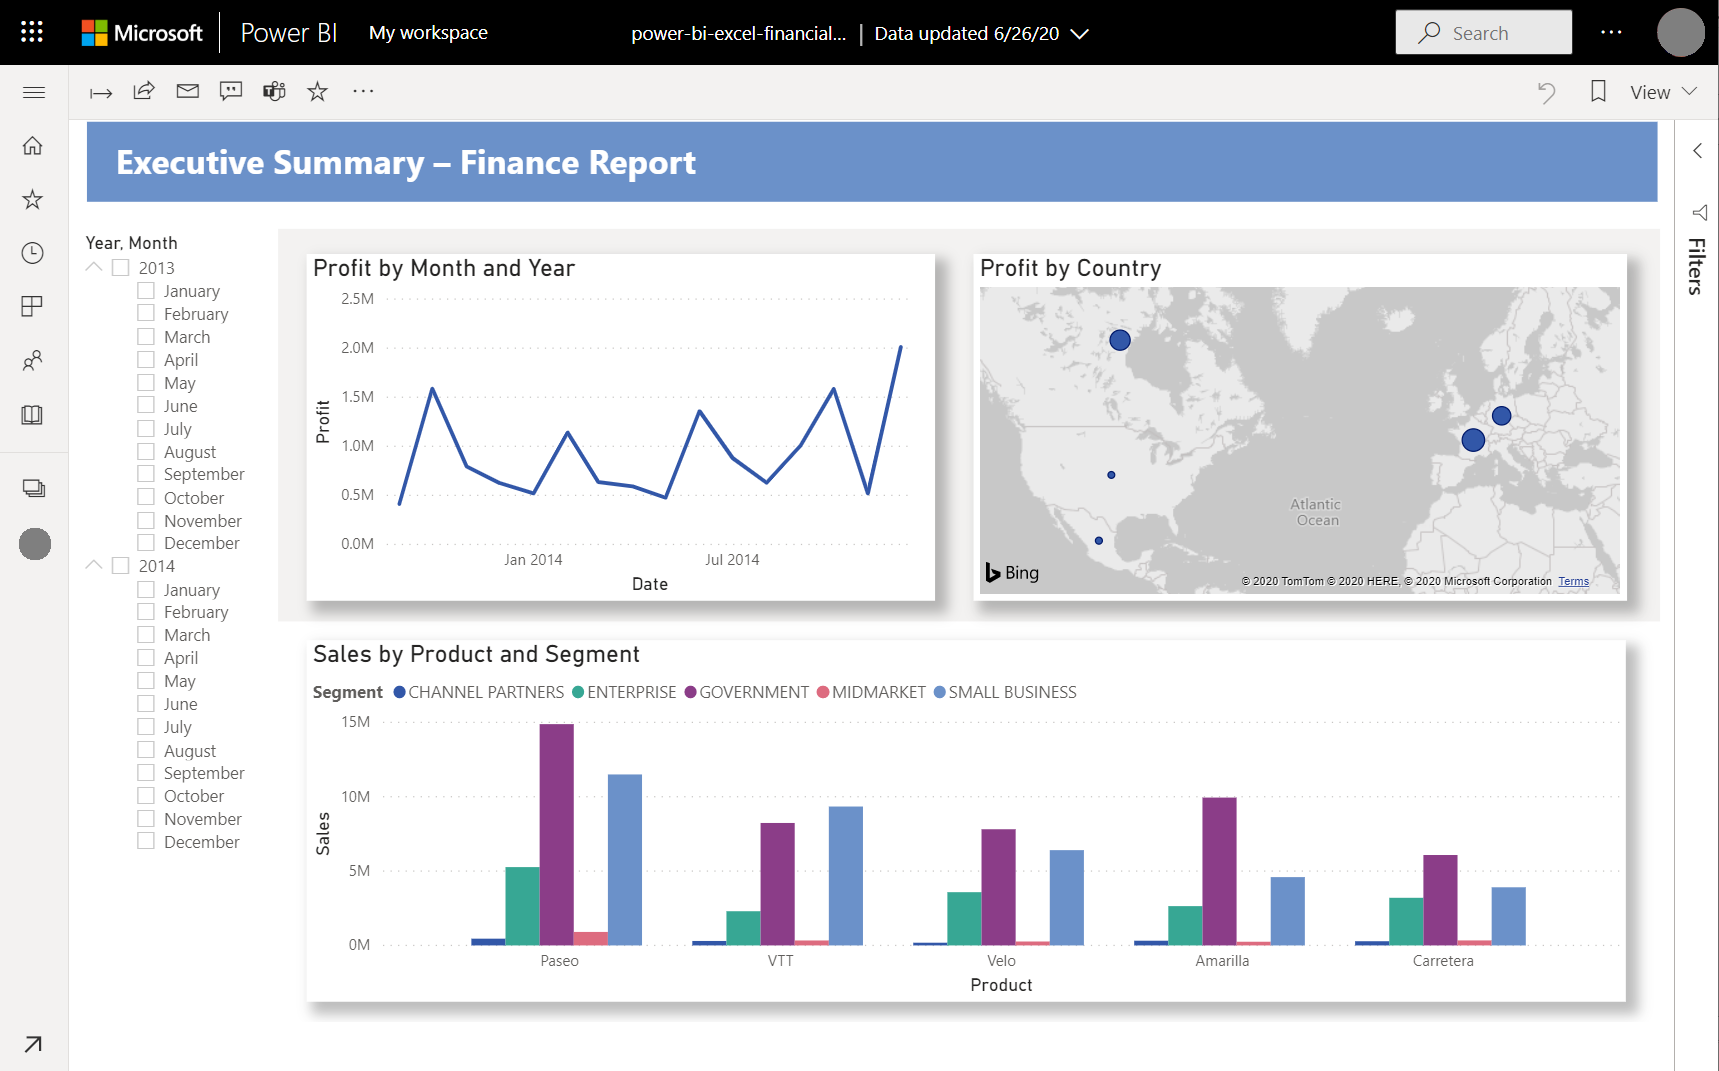
Power BI: a sample finance report
Power BI service: our monthly report
Effort: Medium: link tables and fix dates by hand, about 45 minutes in our test
Accuracy in our test: Correct after linking tables by hand
From: Free edition; $75/user/mo
Tableau is a candidate for analysts who explore relationships visually and turn useful views into reports others can navigate. Its Desktop and web-authoring documentation describes views, charts and maps.
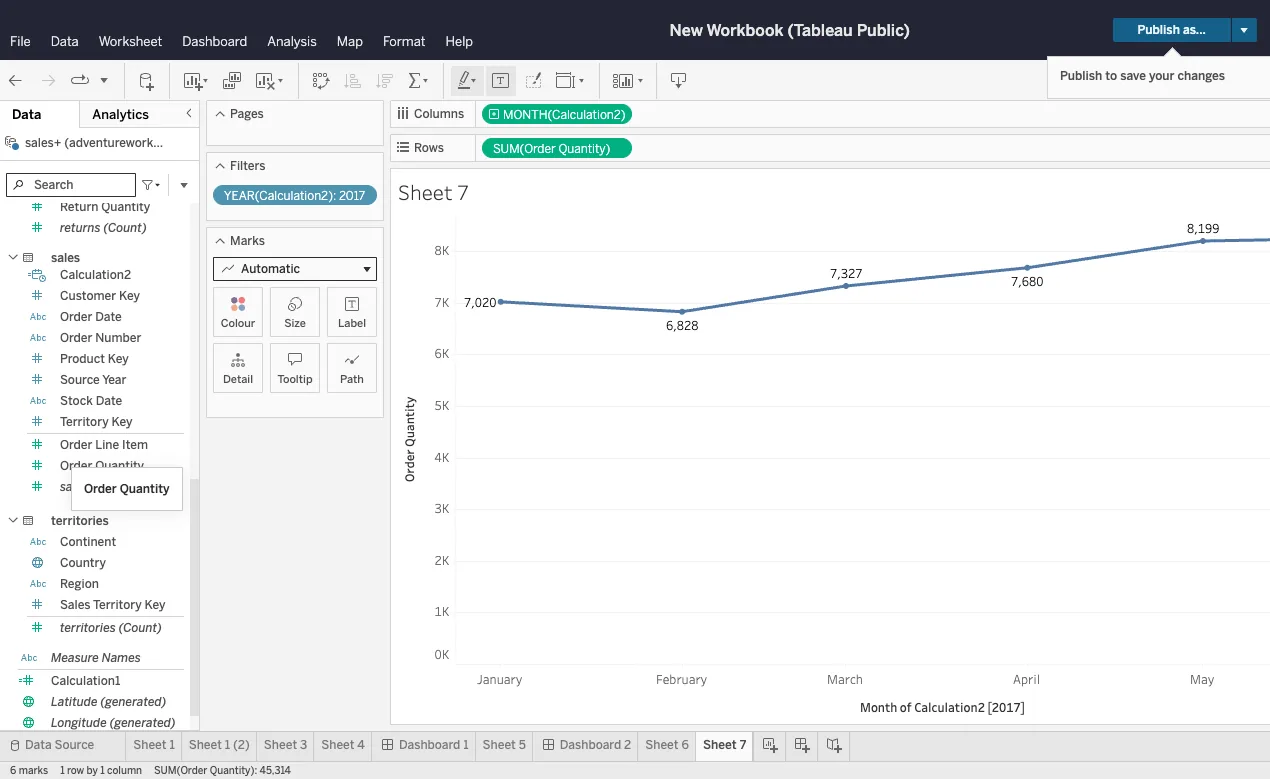
Getting to correct numbers took our tester about 45 minutes in Tableau Public's browser editor. Tableau didn't link sales to regions on its own because the key names differ, and the dates had to be converted by hand. After that we built category return rates, a monthly chart and a findings dashboard, and exported a PDF. Tableau Public saves by publishing to a public profile, so use a private product for confidential data.
The work includes data preparation, chart design and distribution. Can the analyst combine sales and returns without duplicating sales? Does a filter change every intended view? Can the recipient understand the units, date range and excluded records?
A useful buying exercise ends with the recipient opening and using the intended report. Identify who will maintain the source relationships and filters, then check the authoring and viewing roles required for that arrangement.
Price: Desktop Free Edition is free; Standard Creator is $75/user/month billed annually, with one Creator required. AI authoring access depends on the edition, role and site setup. Check the actual roles and deployment you intend to buy.
Tableau: the worksheet workspace
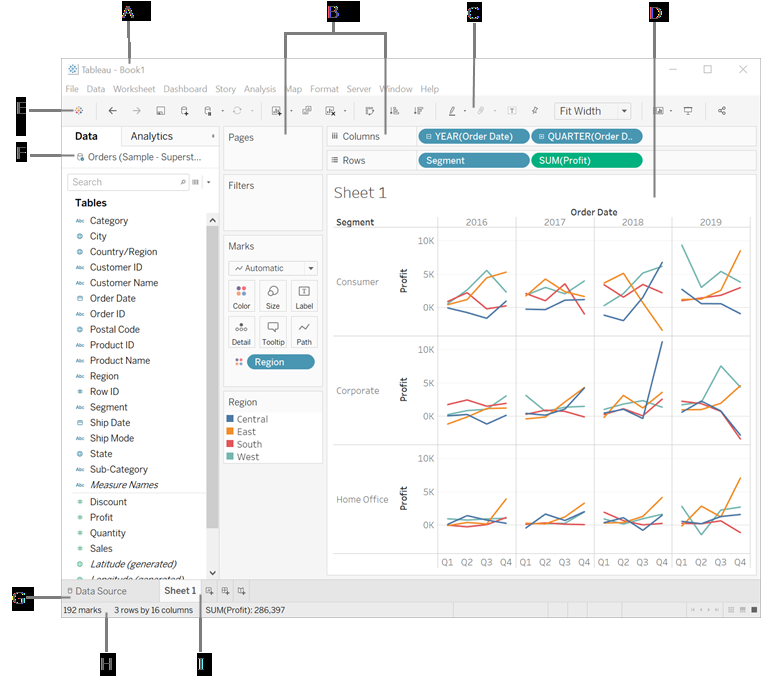
Tableau Public: our monthly chart and findings
Effort: High: write and maintain code
Accuracy in our test: Correct; depends on your code
From: Free
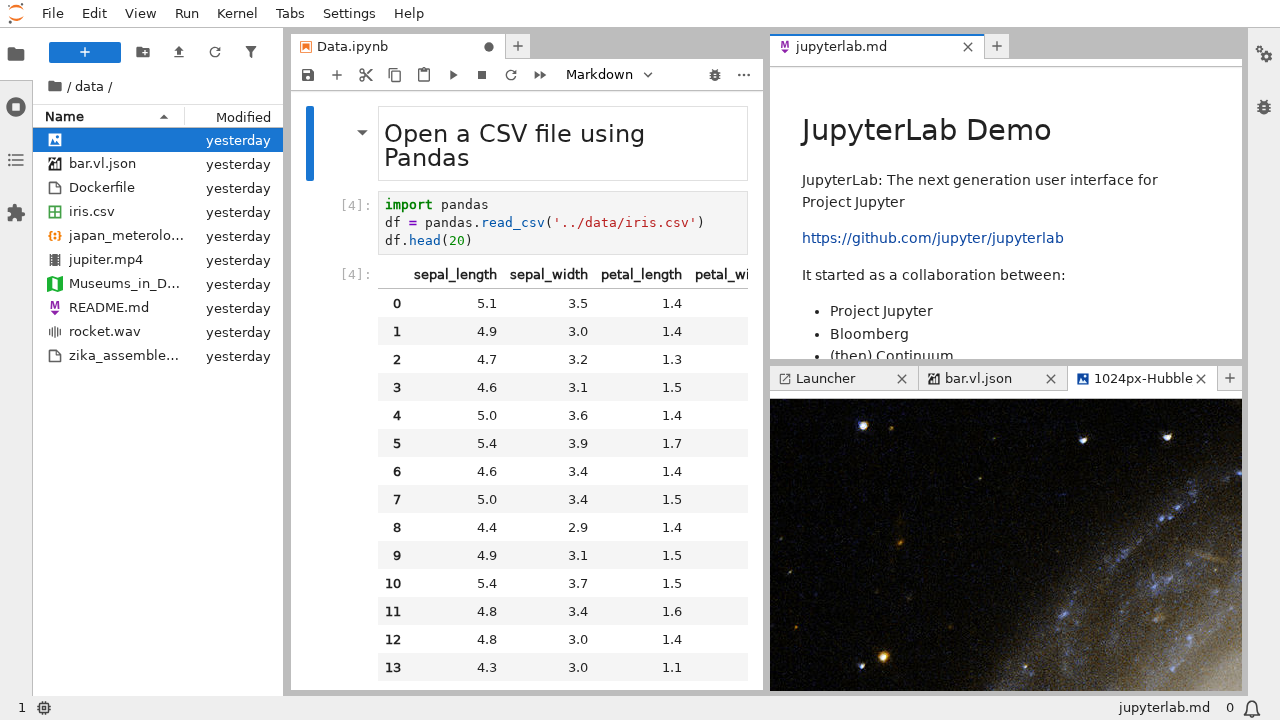
Jupyter combines code, explanatory text and outputs in a notebook. pandas is a Python data-analysis library. This route suits an analyst who needs to write calculation rules explicitly and rerun them on new files.
We ran the analysis as Python scripts with pandas. Every join, date conversion and total had to be written as code, and the scripts produced a monthly chart and five CSV files of answers. The risk is in the code rather than the tool: a join at the wrong level multiplies totals, so check one total by hand.
That control brings responsibility. A notebook can depend on a particular package version, a local file path or a cell executed earlier. A report that runs on its creator’s laptop is not automatically reproducible by a colleague. Keep the input, code, package requirements and execution order together.
The deliverable should include the notebook, input data, package requirements and instructions for running it from the beginning. Someone must know enough Python to maintain the calculations even when an AI assistant helped write them.
Before choosing local or hosted computing, check where files will live, what resources the job needs and who will keep the environment working.
Price: Jupyter and pandas are free software. Hosting, computing resources and analyst time are separate costs.
JupyterLab: code beside its output
Effort: High: code and statistics knowledge
Accuracy in our test: Correct; depends on your code
From: Free
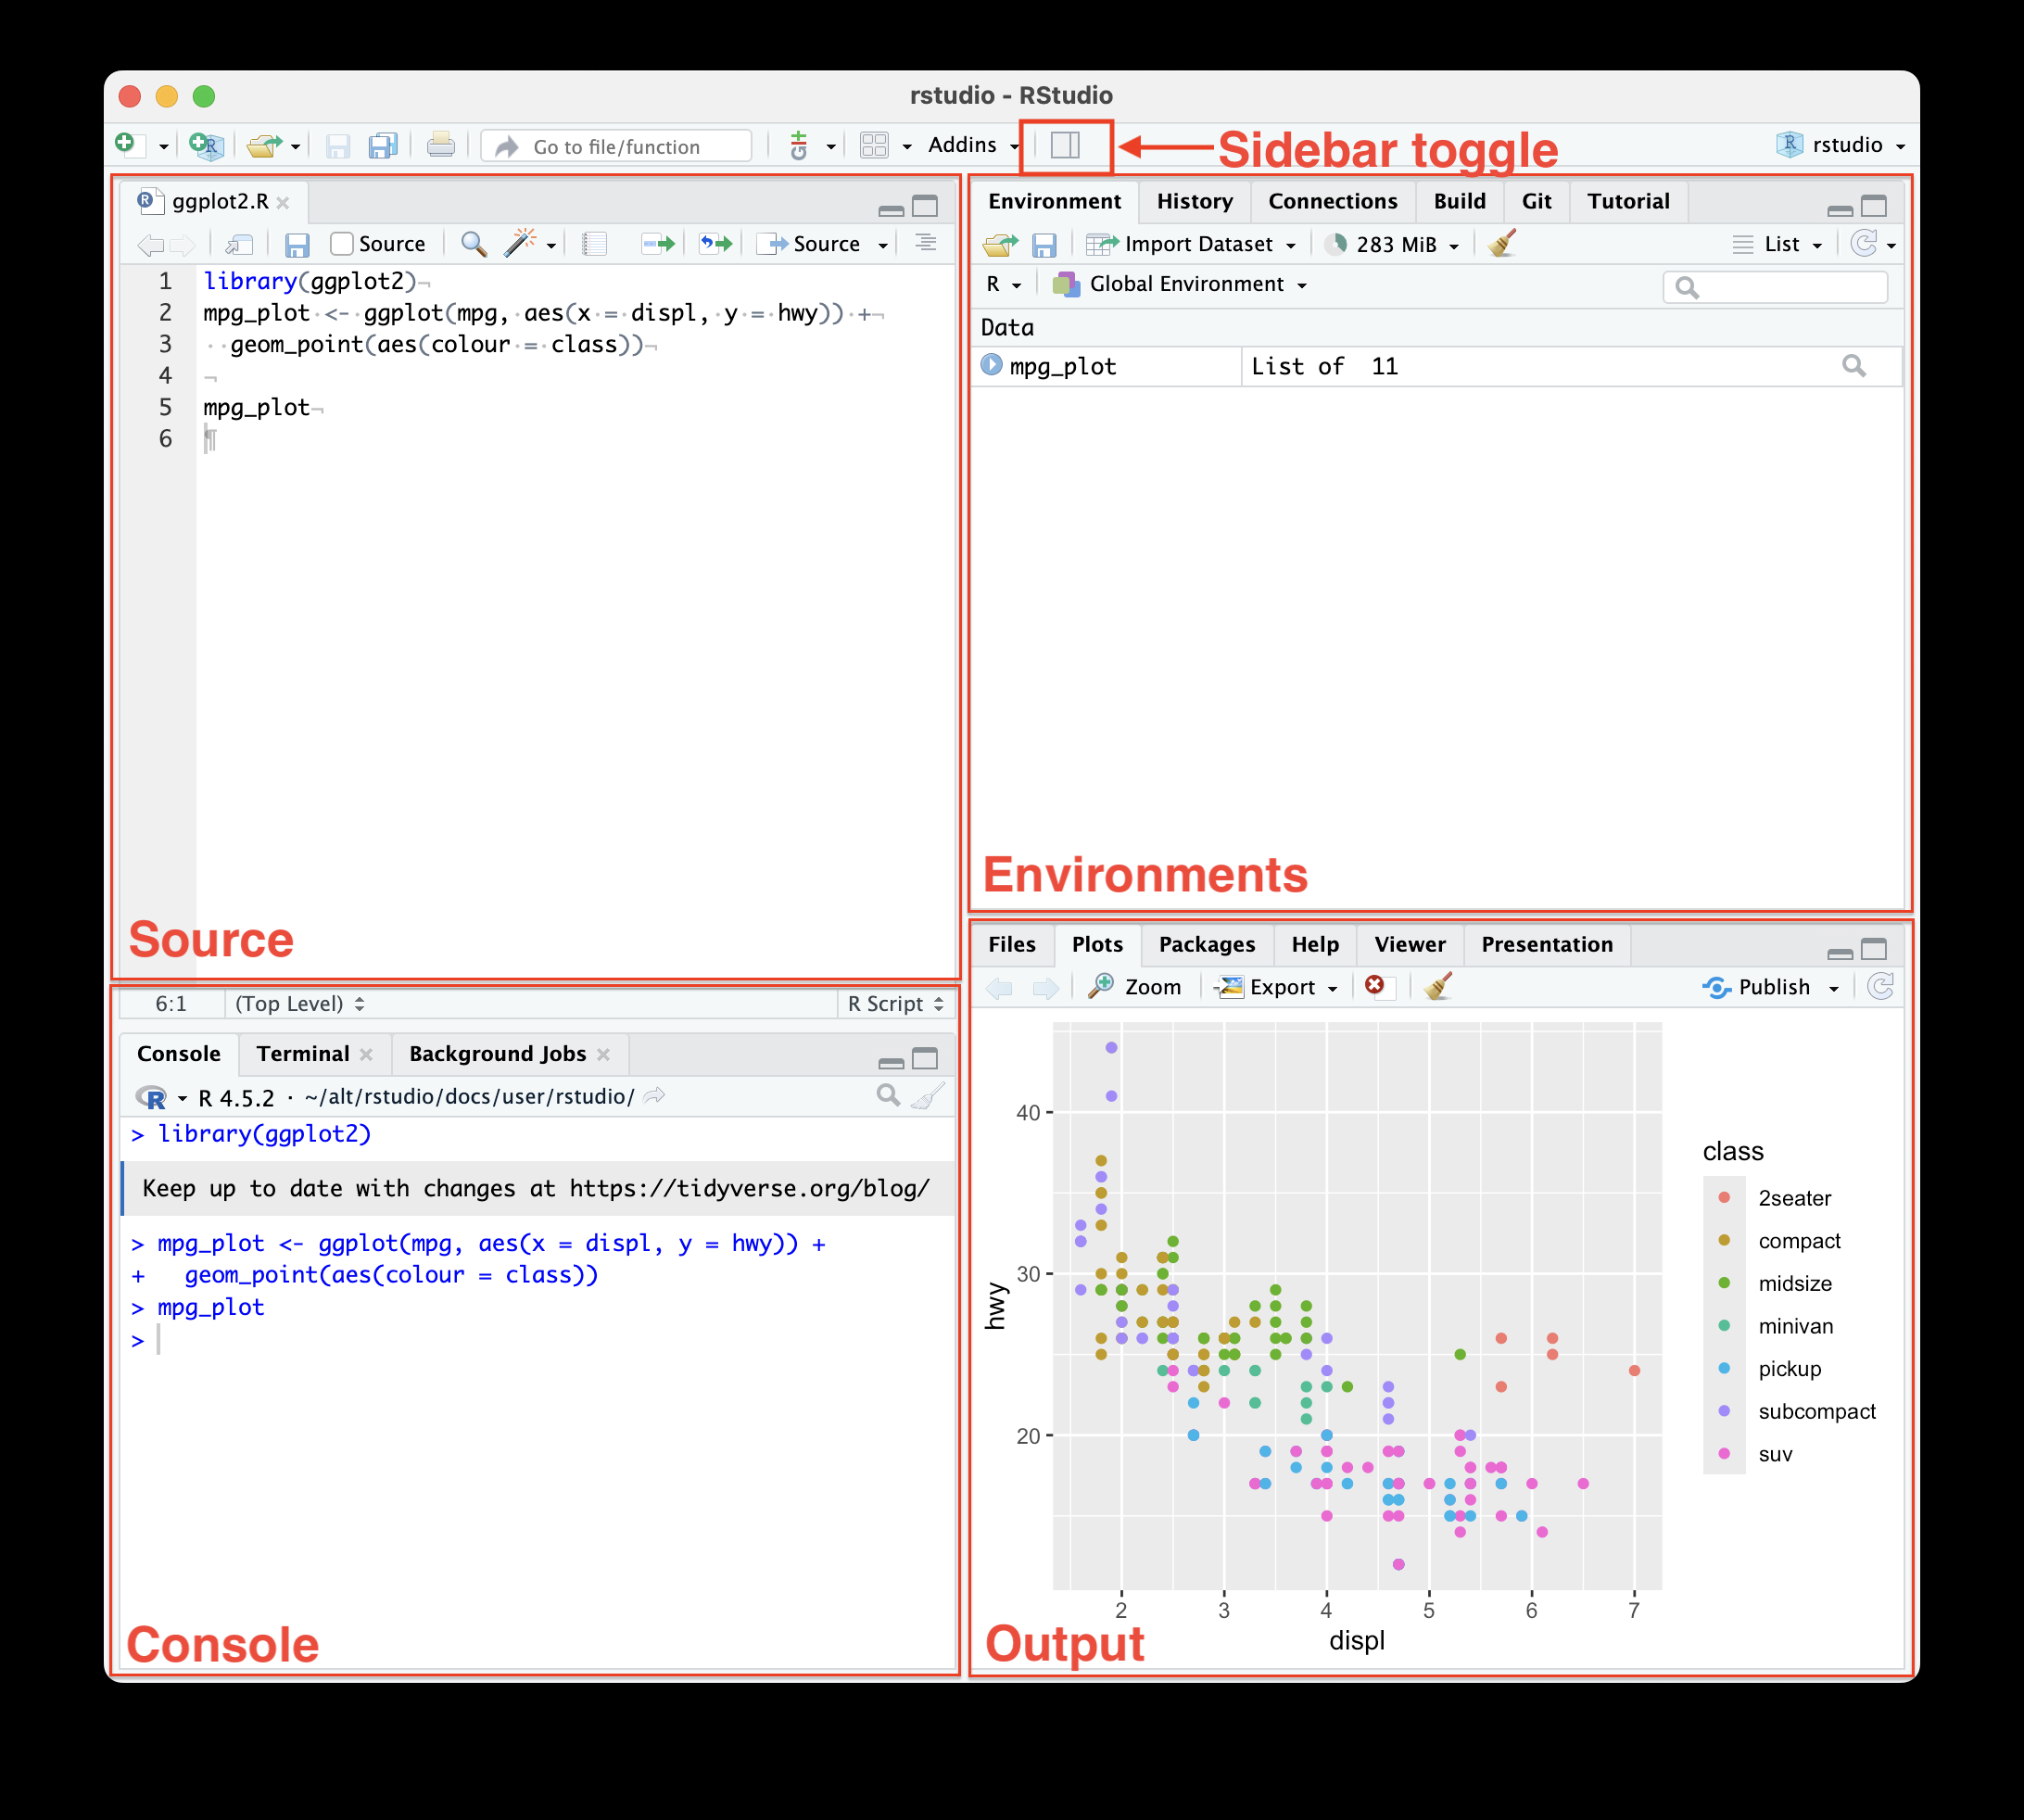
R is a free environment for statistical computing and graphics. RStudio adds an editor, data viewer and project tools around that code. Consider it when a statistically trained analyst needs to develop and explain a method.
We ran the analysis as R scripts: workbook joins, sales summaries, return rates and a monthly chart, with five CSV exports. As with Python, every step is code that someone writes and maintains.
For example, comparing two groups requires more than selecting a test name. The analyst must decide whether observations are independent, how missing values are treated and what an interval means. Code makes those choices inspectable; it does not make the choices correct by itself.
The recipient may need the analysis code, graphics and a written explanation of assumptions and uncertainty. The analyst must maintain methods and packages, not merely rerun a script. Our statistical analysis guide gives a small constructed example and its limits.
Price: R and RStudio Open Source are free. Commercial desktop, hosting and optional AI products have separate terms.
RStudio: source, console and output panes
SQL is the language for querying database tables, and it sits underneath much code and BI work.
SQL is useful when the data already sits in database tables or when you want saved queries to feed a report. It expresses filters, joins and grouped calculations directly. A BI tool or script can then turn those results into a chart or workbook.
In our test, we loaded the six Excel sheets into DuckDB tables and did every calculation in SQL, then exported the monthly table and answers as CSV files. Charts needed a separate step.
The important skill is joining at the right level. If several sale rows and several return rows share a product key, joining the raw tables can multiply the quantities. Aggregate sold and returned units separately before calculating the category ratio. Keep the original order identifier if you need to match a return to its purchase.
DuckDB is a free local SQL option for file analysis. PostgreSQL and commercial databases also support SQL; their hosting and administration costs vary. Choose the database and reporting interface according to where your data belongs and who will maintain them.
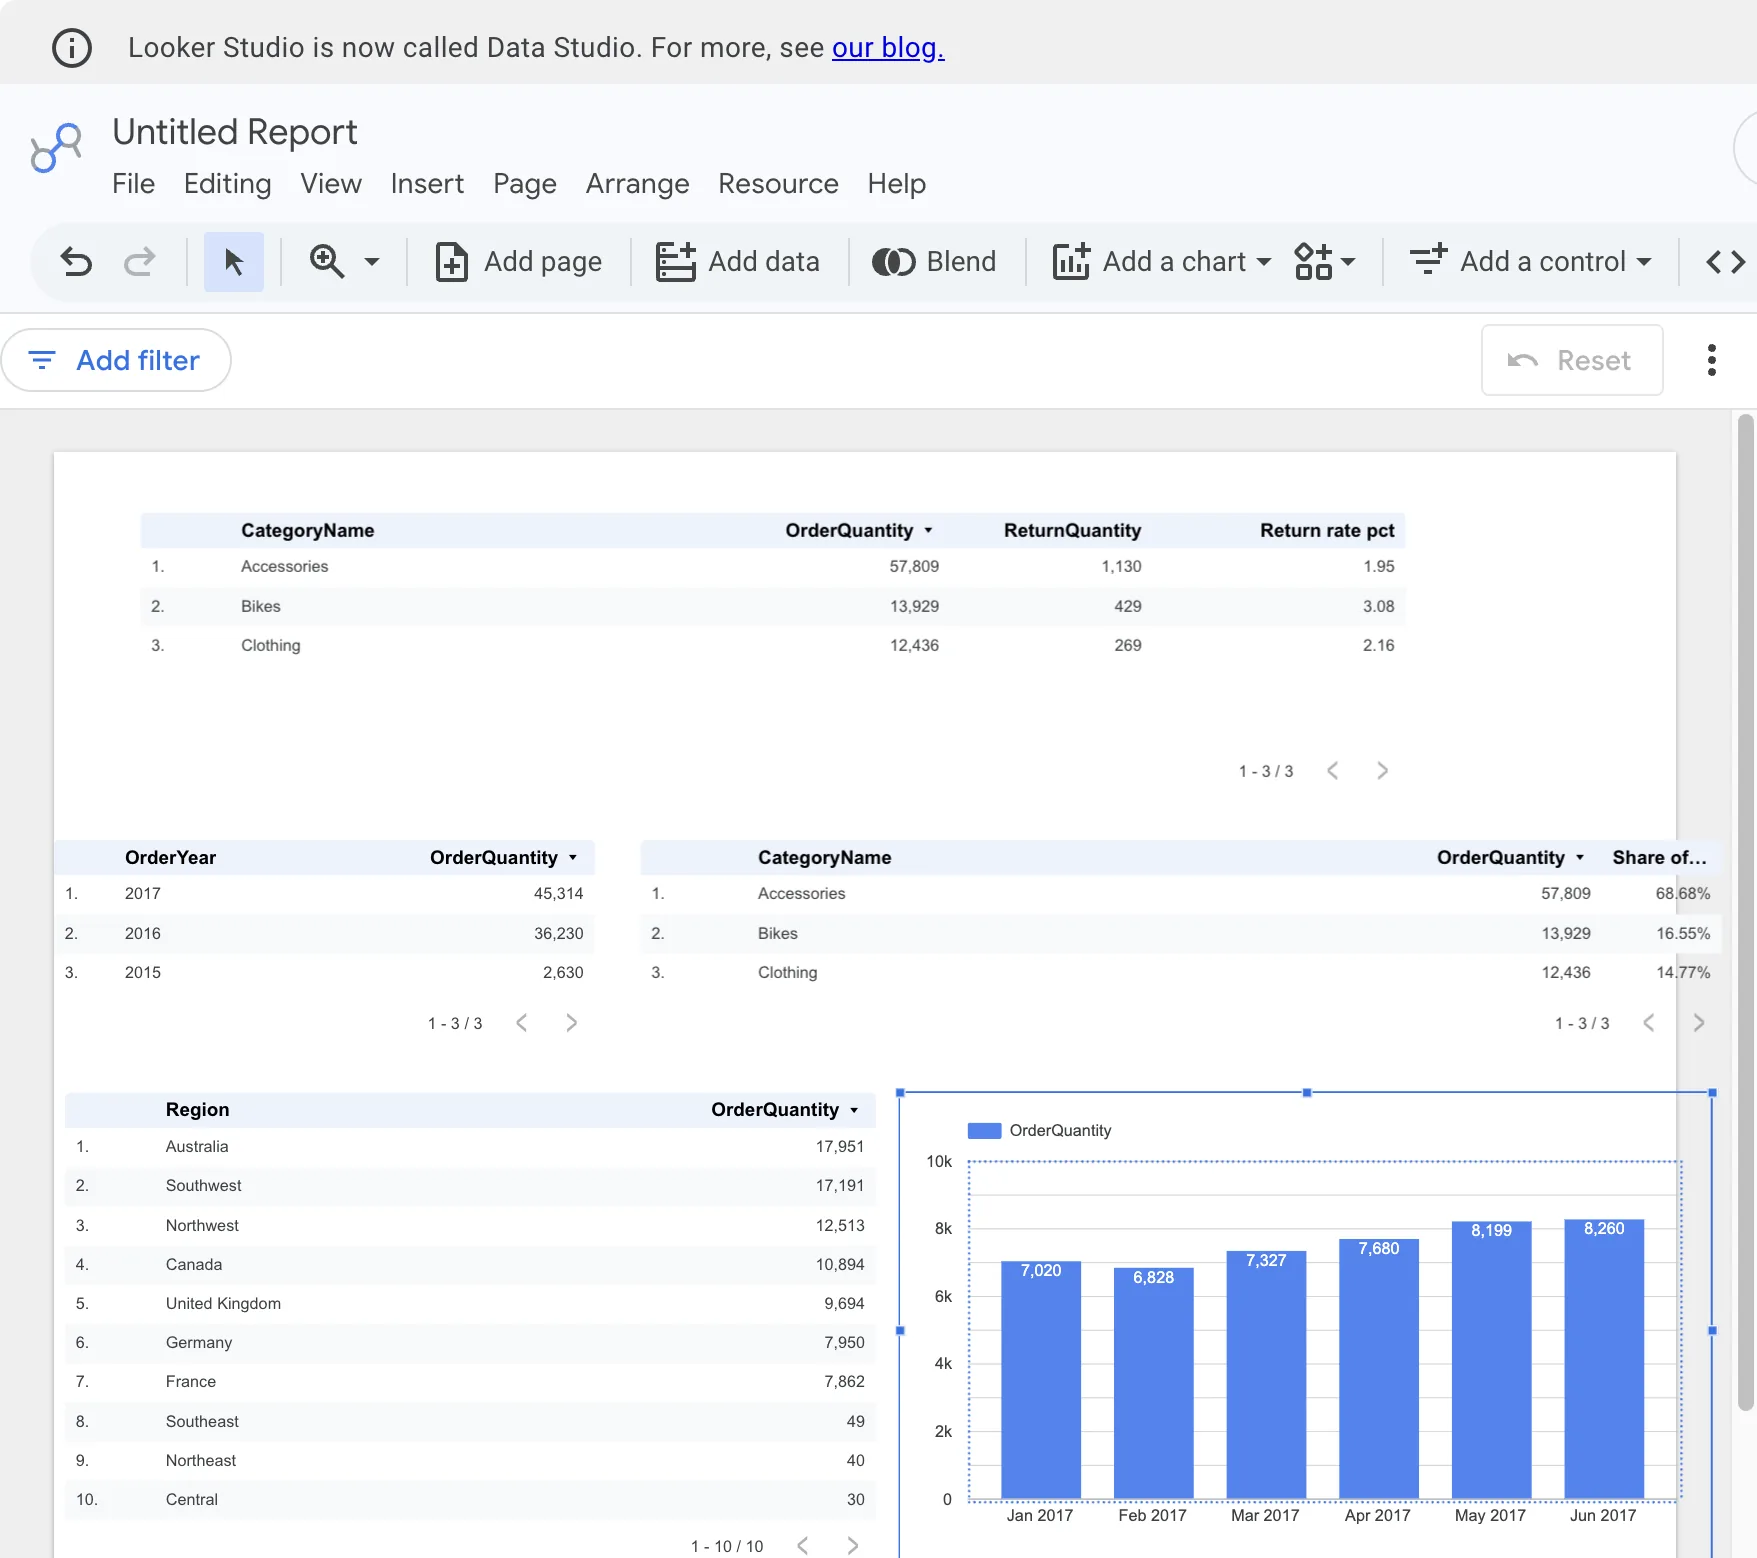
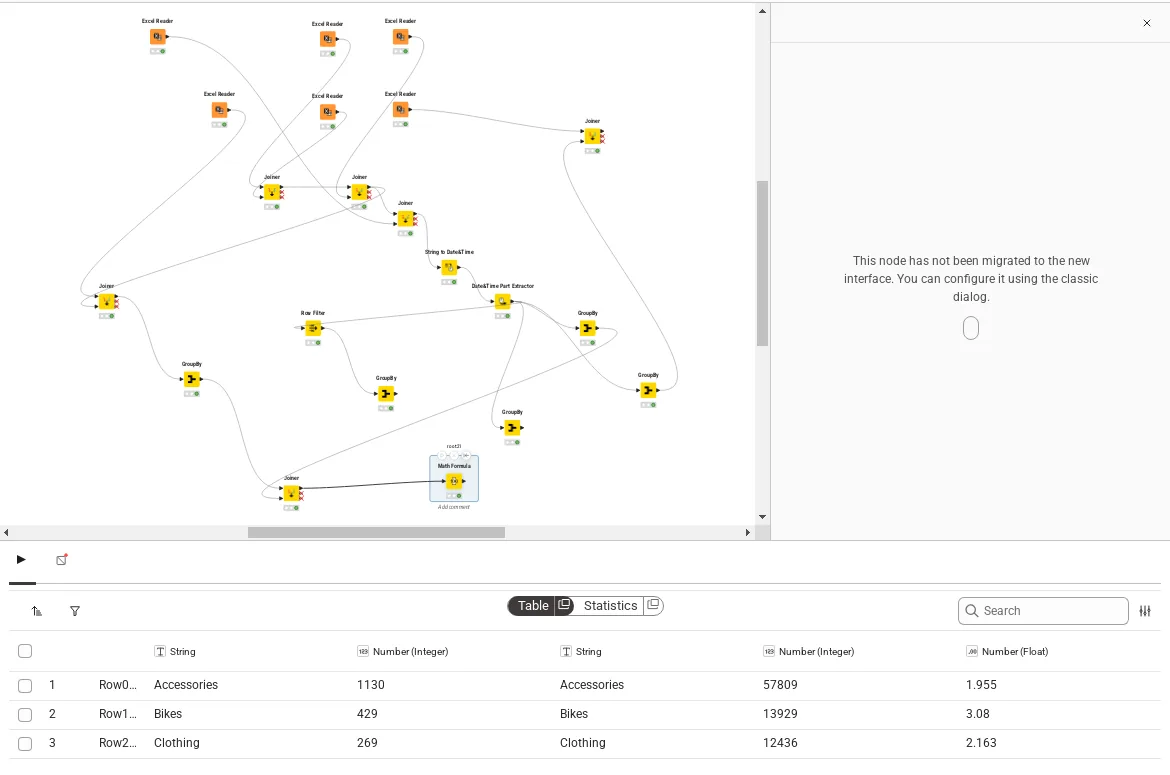
A free tool can be sufficient when its sharing and maintenance requirements fit. Beyond personal Sheets, local scripts and free desktop authoring, these three options serve different reporting jobs:
Free local authoring, public publishing and private team sharing have different costs. Check the recipient's access before treating a free installation as a free company reporting system.
Looker Studio: our monthly units report
KNIME: our monthly units chart
Effort: Low: upload or connect, ask in plain language
Accuracy in our test: Correct; one export needed a retry
From: Free; Pro $25/mo
Anomaly AI is a business data analysis workspace. It fits work where the dataset is too large or too messy to handle comfortably in a spreadsheet: you describe the analysis in plain language, and the workspace runs it while keeping the working behind each result available for review. Definitions, output review and repeat checks remain the owner’s responsibility.
What the workspace includes:
Try it on the five-sheet sample workbook before adding your own data. Analyse the sample workbook in Anomaly, then compare the result with the answers in the download.
We confirmed these features on a small sample file in November 2026. Workbook changes do not automatically update separate dashboards, and workbook edits need to finish saving before you download.
Price: The current pricing page lists Free, Starter at $15/month (shown in selected countries), Pro at $25/month, Analyst at $90/month and Team at $45/seat/month, with a two-seat minimum of $90/month. Annual plans for Pro, Analyst and Team are billed yearly at a stated 20% discount.
Anomaly’s original unfinished export attempt
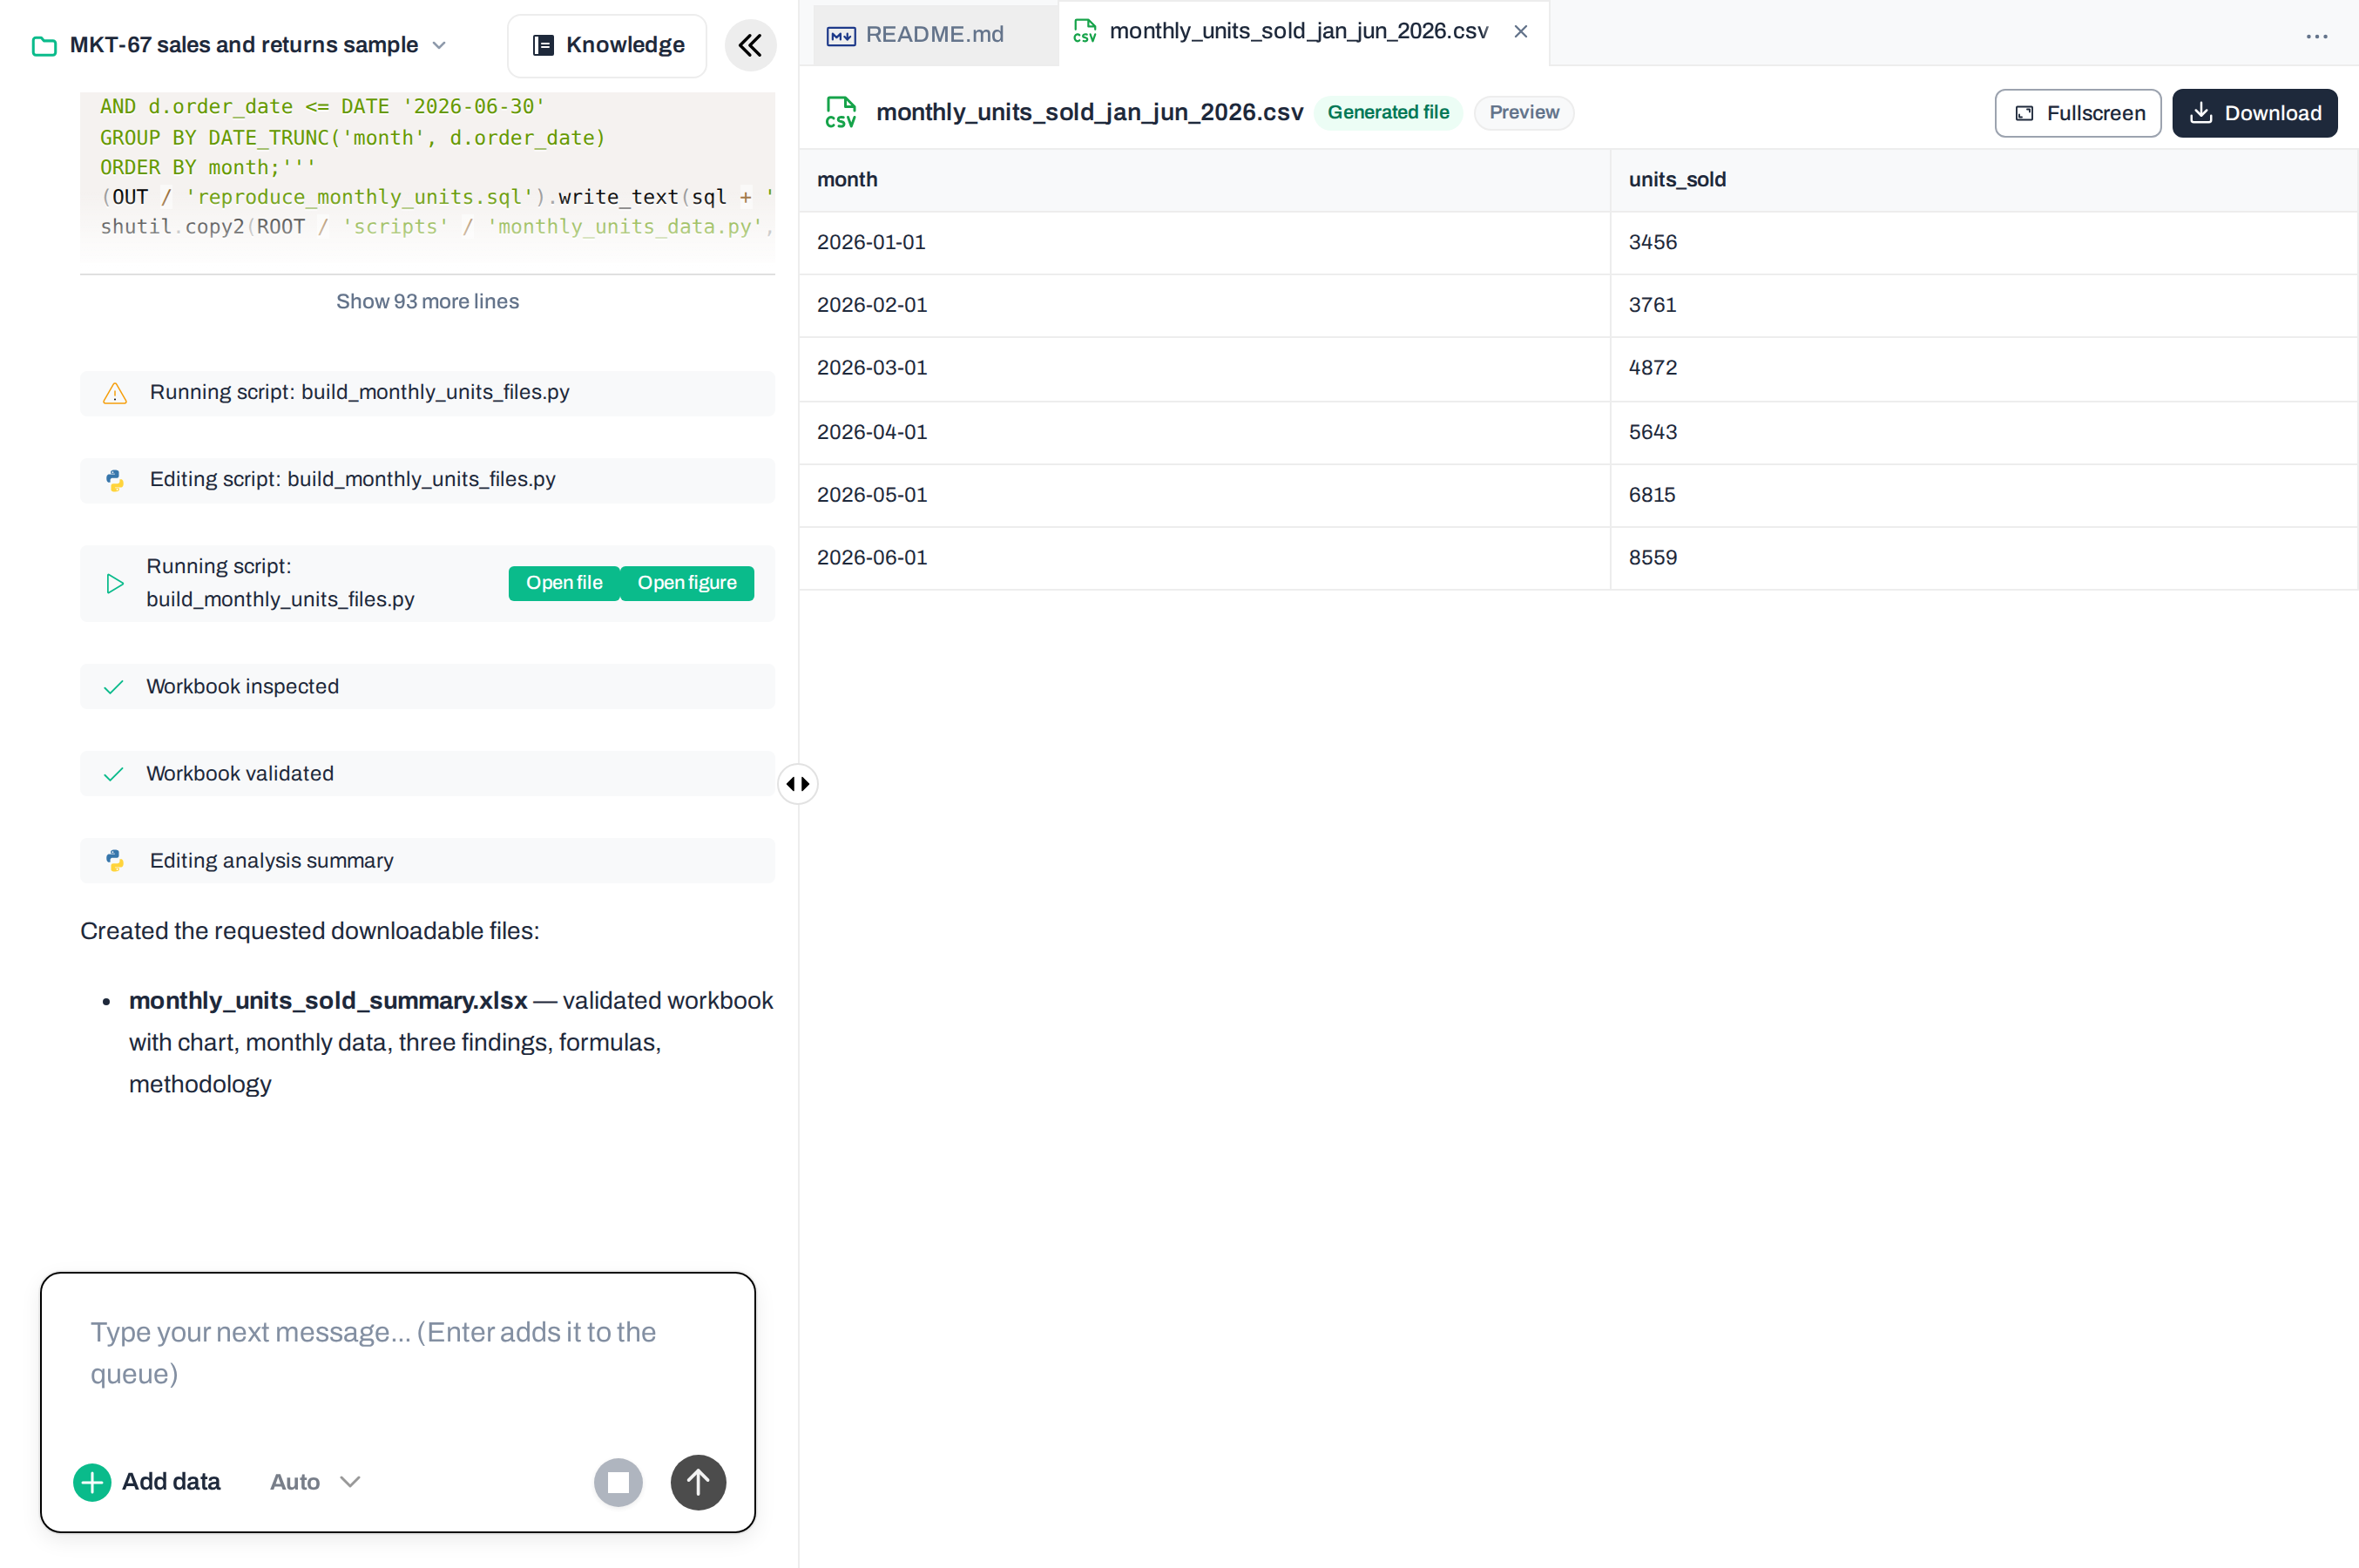
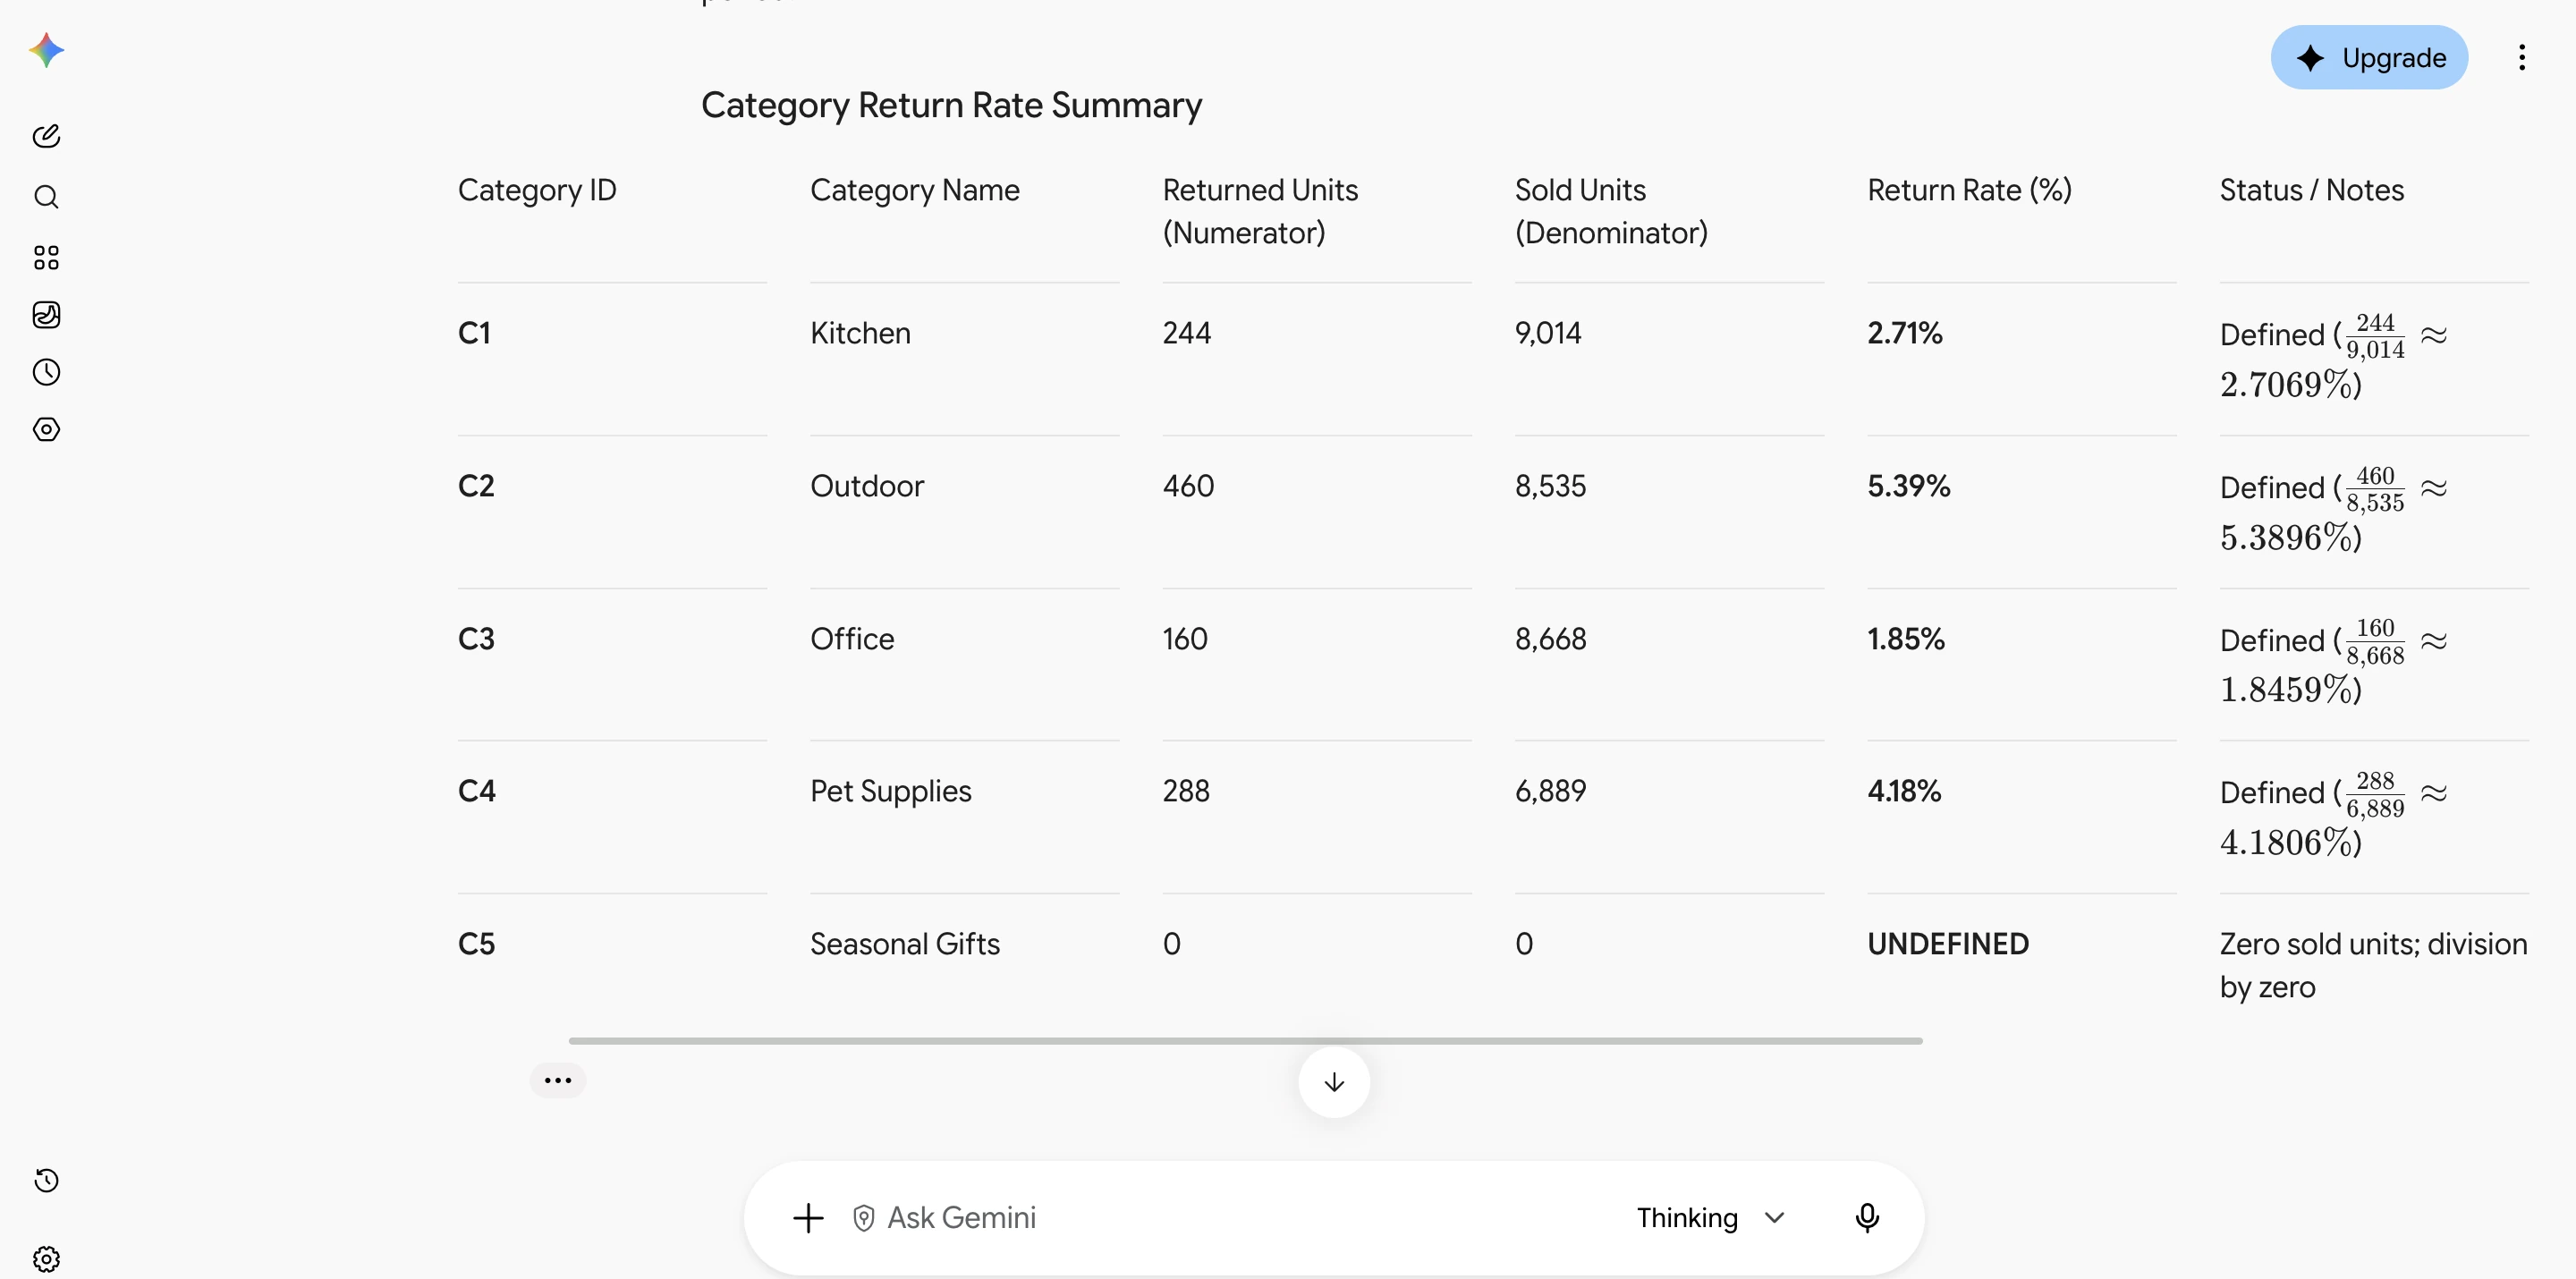
The chart from the recovered export
Effort: Low: ask in plain language
Accuracy in our test: Correct on paid; Free plan ranked a category wrong
From: Free; $20/mo
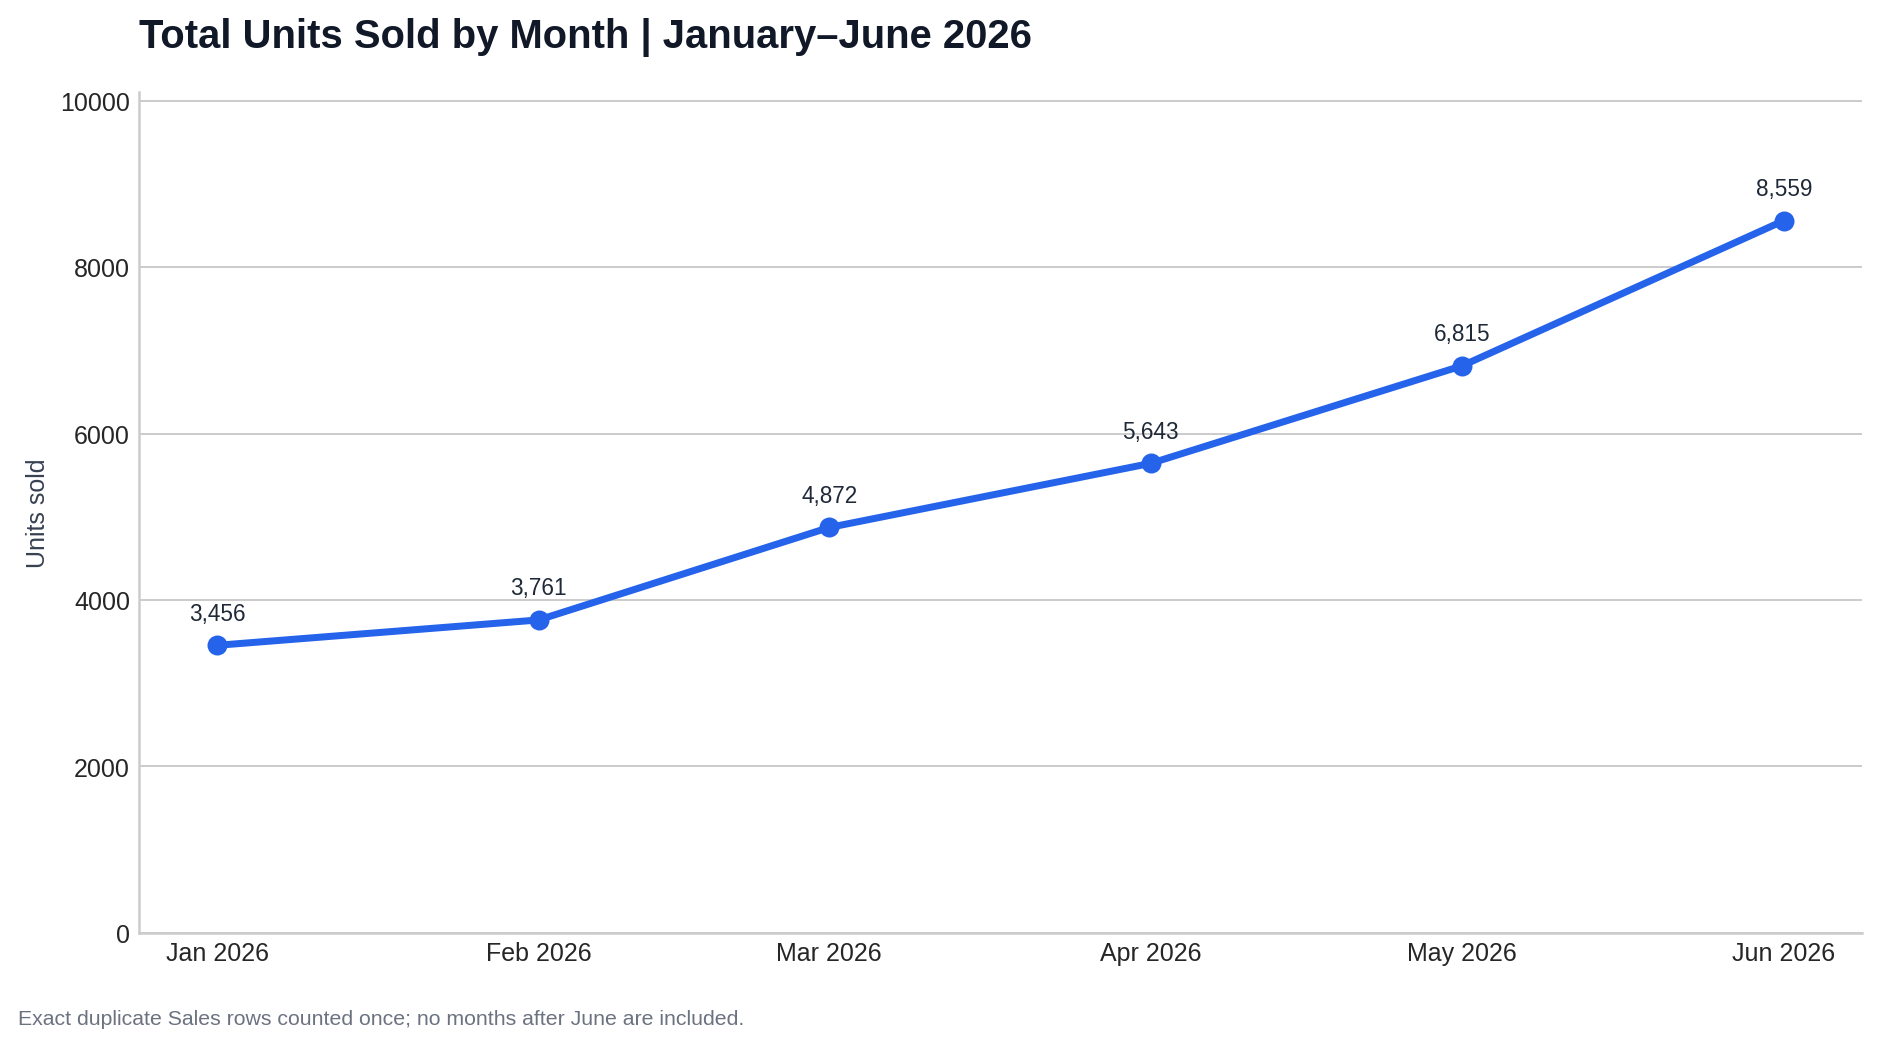
On a paid plan, ChatGPT produced the summaries and monthly files we asked for. Its Python code reproduced the CSV, and the workbook’s total and chart updated when we changed an input. On the Free plan it hit an analysis limit, and its growth ranking put a declining category above a flat one. Check the working and the exported file before sharing.
Price: Official OpenAI documentation lists Free, Plus at $20/month and Pro from $100/month. Usage limits depend on the plan.
ChatGPT: the unfinished export
Effort: Low: ask in plain language
Accuracy in our test: Correct
From: Free; $20/mo
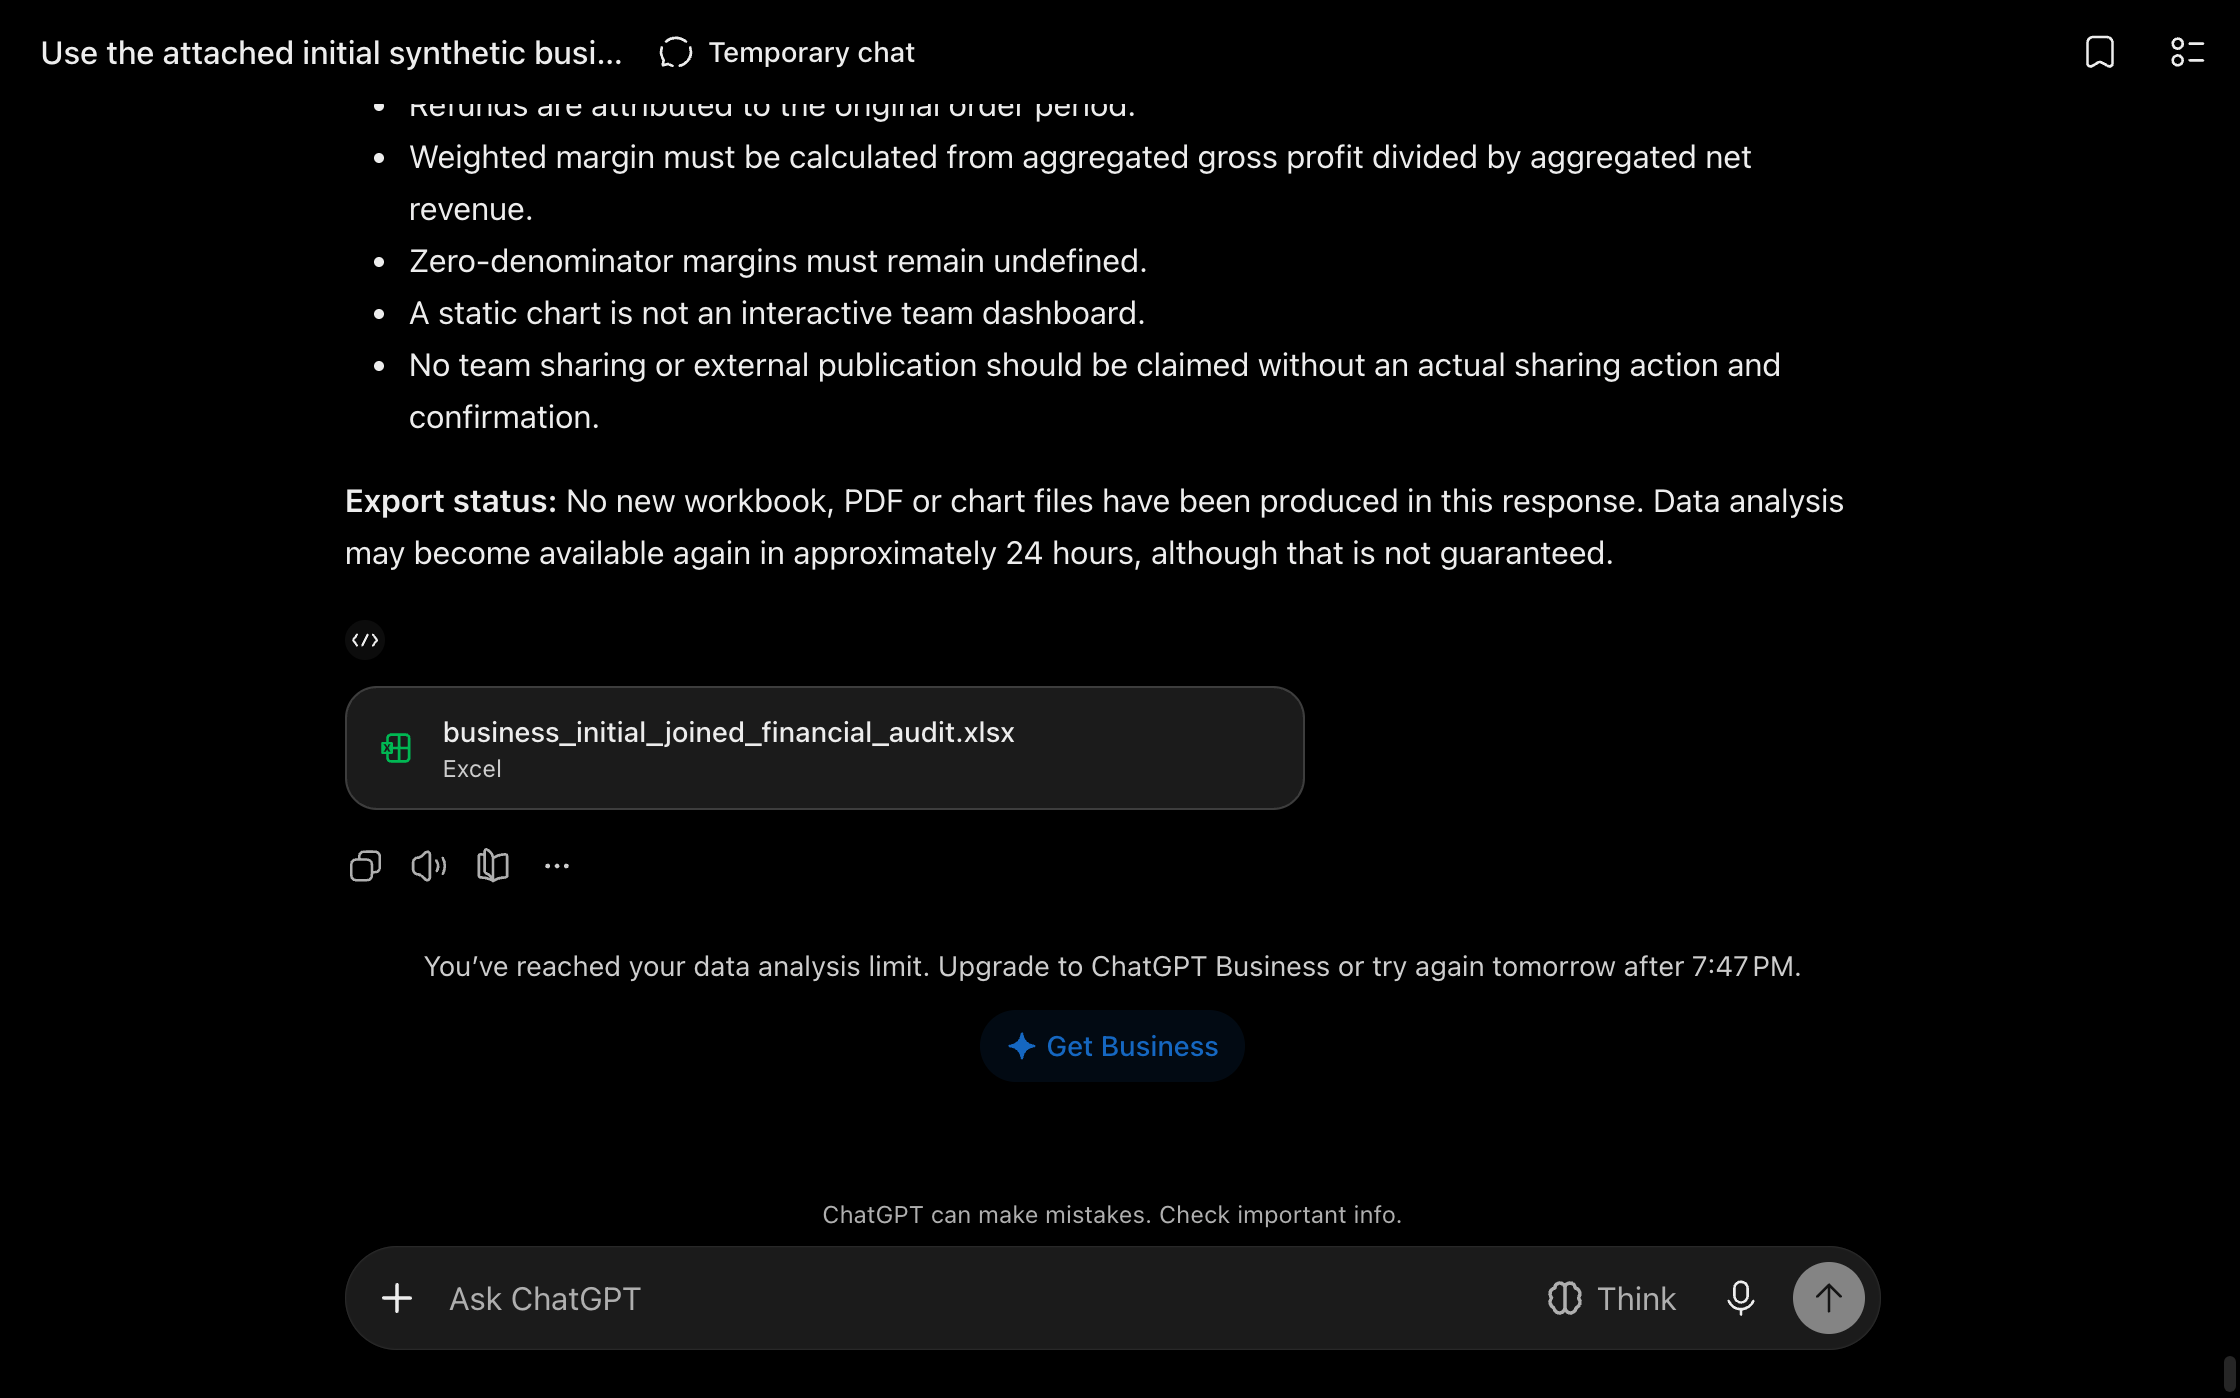
Claude returned a workbook with formulas linked to the source data and an editable chart. Its summaries and category return rates were correct, and changing a source quantity updated the totals and chart. Its suggestion that recent orders understated the return rate still needed business context; inspect the interpretation as well as the cells.
Price: Current plans include Free, Pro at $20/month or $200 billed annually, and Max at $100/month.
Claude’s returned and sold units
Effort: Low: ask in plain language
Accuracy in our test: Two figures wrong
From: Free; $19.99/mo
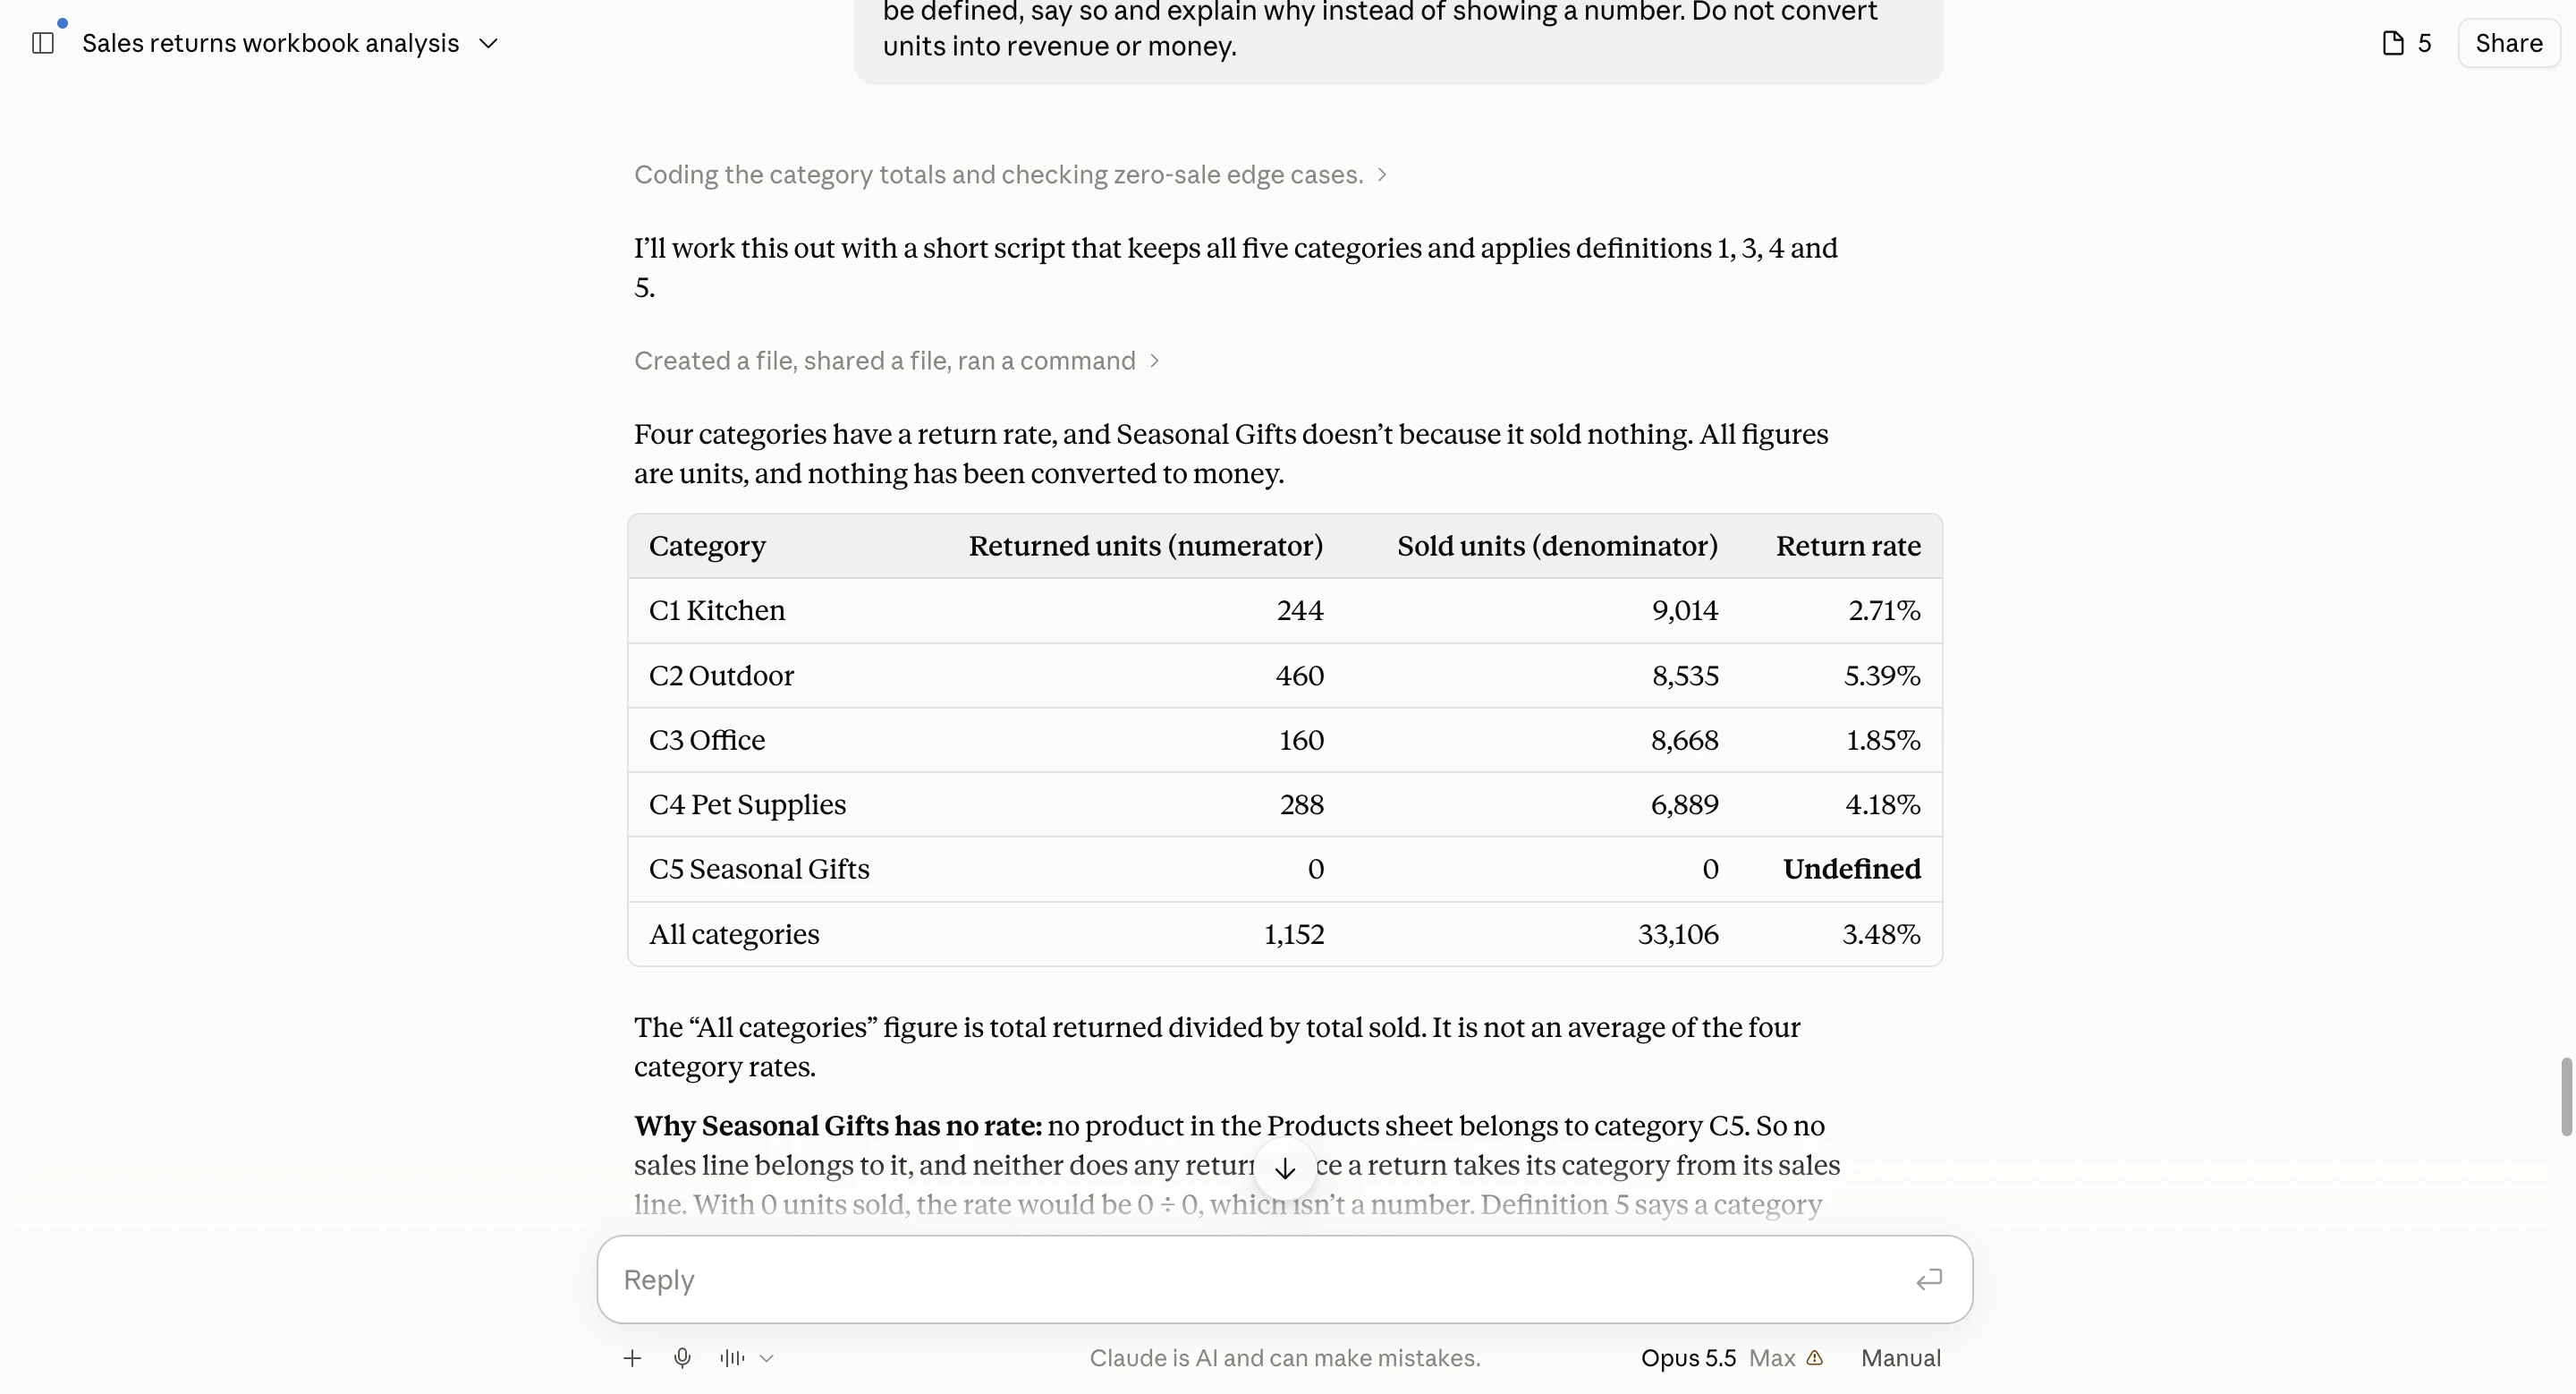
On a work account, Gemini produced the sales summaries, category rates, chart and workbook we asked for. It also reported raw sales volume as 33,439 units instead of 33,436 and got the rounded growth figure wrong. The workbook was mostly fixed numbers, with a formula only for the total. In earlier tries it double-counted returns, or showed a table that didn’t match its own code. Check the table, the commentary and the file against each other.
Price: The US personal offer includes Free and Google AI Pro at $19.99/month. Work accounts have separate terms.
Gemini: the category-rate table
Effort: Low, on an eligible Microsoft 365 plan
Accuracy in our test: Not tested; from Microsoft’s docs
From: $21/user/mo add-on
Microsoft describes Copilot’s assistance with formulas, charts and analysis inside Excel. Inspect the resulting cells and formulas, then change a known input to check the result. Consumer access is included in eligible Microsoft 365 subscriptions with usage limits; Personal requires the subscriber’s workbook saved to OneDrive with AutoSave on.
Price: The Business add-on standard price is $21/user/month paid yearly, plus an eligible Microsoft 365 Business license. Its first-year offer is $18 through 31 December 2026.
Effort: Low: ask in plain language
Accuracy in our test: Hit a usage limit
From: Free; $20/mo
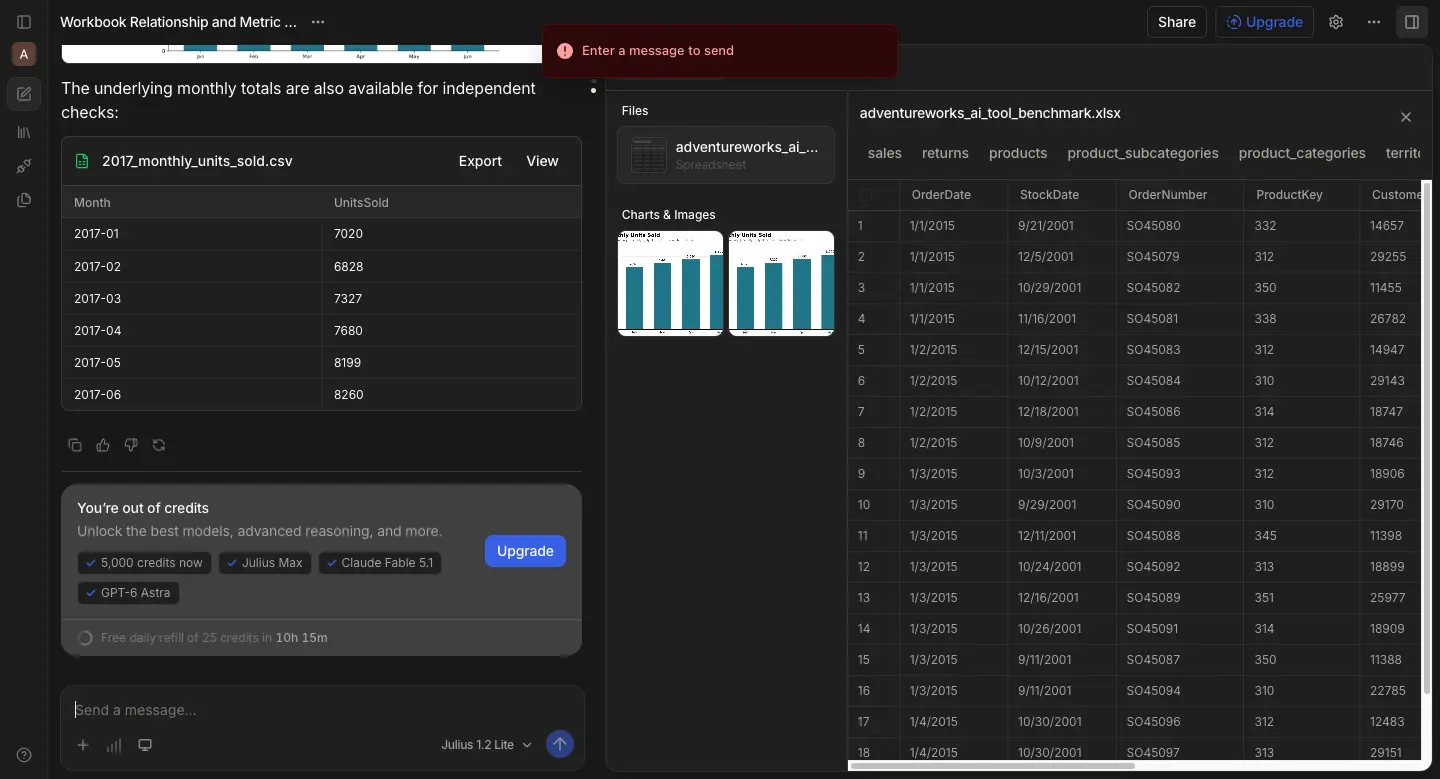
Julius offers a dedicated analysis conversation for files, charts and reports. On the Free plan, it produced a six-month sales table and charts before showing a usage-limit notice. The Python code it displayed needed fixing. Check today’s allowance and the export you need before committing to a report handoff.
Price: The official pricing page lists Plus $20/month ($16/month billed yearly), Pro $45/month ($37/month billed yearly) and Business $450/month ($375/month billed yearly). Monthly allowances are 2,000, 5,000 and 60,000 credits.
Julius’ result and allowance limit
The right tools for data analysis depend on the job and the deliverable. Each shortlist below still needs your own file and buying checks.
For financial reporting and recurring calculations, evaluate Excel/Power Query for a workbook colleagues review in cells, or Sheets for a small shared report. For help inside the workbook you already use, try Copilot in Excel. If the files are too large or messy for Excel, or the same report has to be rebuilt every month, evaluate Anomaly. A formula owner must maintain definitions, preparation steps and permissions. Expect a reconciled workbook with visible working. Check edition features and recipient access, and test Sheets on your own file if it is large.
Evaluate Power BI or Tableau for visual exploration and shared, filterable reports. Someone owns table relationships, metric definitions and the update process. Expect a report colleagues can use. Check author/viewer arrangements and refresh responsibility.
For a specific question or a file you will review, evaluate a general-purpose assistant such as ChatGPT or Claude. For a dedicated business-analysis workspace and a report or dashboard handoff, evaluate Anomaly. A person still owns definitions and reconciliation. Expect working and usable outputs; check allowances, export access and recipient permissions for either route.
Evaluate Python/pandas in Jupyter when you will maintain code, Excel/Power Query for spreadsheet preparation, or a BI tool for distribution. An AI assistant such as ChatGPT or Claude can draft the Python or SQL, but someone still has to review it. The owner maintains inputs, calculation rules and the environment. Expect code or saved preparation steps plus a report. Check hosting, package requirements and recipient access.
Evaluate R/RStudio or Python/Jupyter for statistical modelling maintained by someone with programming and statistical skills. That person owns assumptions, missing-data treatment and validation. Expect analysis code, graphics and an explanation of uncertainty. Check computing and package needs.
For campaign and channel performance, evaluate Sheets for a small report, Power BI or Tableau for a shared reporting model, or Anomaly when the data comes from GA4, Google Ads, Search Console or Meta and TikTok ads and the report repeats. Maintain channel definitions, calculations and permissions. Expect a spreadsheet, dashboard or report matched to the recipient. Check data access and sharing terms; see the worked Sheets example.
A common core is a spreadsheet, SQL and one BI tool, with Python or R for repeatable or statistical work. If you are starting out, learn Excel first, because most business data arrives in spreadsheets; then SQL for data stored in databases; then Power BI or Tableau for dashboards; then Python when you need custom analysis you can rerun. AI assistants help at every stage, but you still need to understand the calculations to check their answers.
Choose one small disputed group and trace its source records. Check duplicate handling, date boundaries, missing keys and refund treatment before asking for another summary. Keep both original answers. A third tool agreeing with one answer is not a substitute for reconciling the records and definitions.
Send the exact input version, definitions and working with the output. For code, include package requirements and the order to run it. For a workbook, identify which cells are inputs and which are formulas. Ask the recipient to repeat one known calculation; opening the file alone proves less.
Do not infer that from the author’s access. List the intended recipients, whether they are inside your organisation, and whether they need to view or edit. Verify the exact vendor arrangement for those people. A successfully exported PDF also does not establish that a private interactive link will work for them.
A local installation can be part of that plan, but inspect the whole workflow. Hosted notebooks, connected services, optional AI assistants and shared output folders can send or expose data elsewhere. Decide which components are approved and who can access the outputs before loading confidential records.
Treat it as a changed input, not a routine successful refresh. Save the old file and result. Check the new columns and whether values are still read as dates, numbers or text, then repeat the reconciliation. Keep the definitions stable unless the business meaning changed. Record manual changes so the next analyst can explain the difference.
Excel, Google Sheets, Power BI and Tableau support graphical workflows and formulas or calculated fields without general programming. Anomaly, ChatGPT, Claude, Gemini, Copilot in Excel and Julius also accept plain-language requests. Python and R require code. Someone still needs to understand the calculations and review the result.
Power Query, Power BI and Tableau have source connectors. Anomaly connects to GA4, ad platforms, databases, Shopify, QuickBooks and HubSpot. Julius also offers direct connectors, including Postgres, BigQuery and Snowflake, on its Business plan. Check the connector, plan, credentials and refresh requirements for your actual source.
Yes. Configured scheduled refreshes, scripts and report delivery can run without a person approving every result. Power BI can refresh on a schedule, and Anomaly can send scheduled reports. Separate reporting from actions such as changing an order or making a payment. Set access permissions, input checks and failure notifications before relying on unattended work.
Experience AI-driven data analysis with your own spreadsheets and datasets. Generate insights and dashboards in minutes with our AI data analyst.
Founder, Anomaly AI (ex-CTO & Head of Engineering)
Abhinav Pandey is the founder of Anomaly AI, an AI data analysis platform built for large, messy datasets. Before Anomaly, he led engineering teams as CTO and Head of Engineering.
LinkedInContinue exploring AI data analysis with these related insights and guides.
Learn bank reconciliation step by step with downloadable practice files. Match transactions, calculate adjusted balances, and investigate differences.

Check a business comparison from the source rows through averages, a t-test that compares two groups, and correlation and regression for two linked measures. Follow the synthetic example and reproduce the calculations.

Build a sales workbook (an Excel file) with three sheets, editable formulas and numbers you can check. Follow the example from source records to the downloaded file.