AI Data Analyst for Recurring Business Reports
Turn large business data from spreadsheets, GA4, ad platforms, and databases into trusted dashboards, insights, and refreshable reports. Every number stays traceable to source.


 Excel
Excel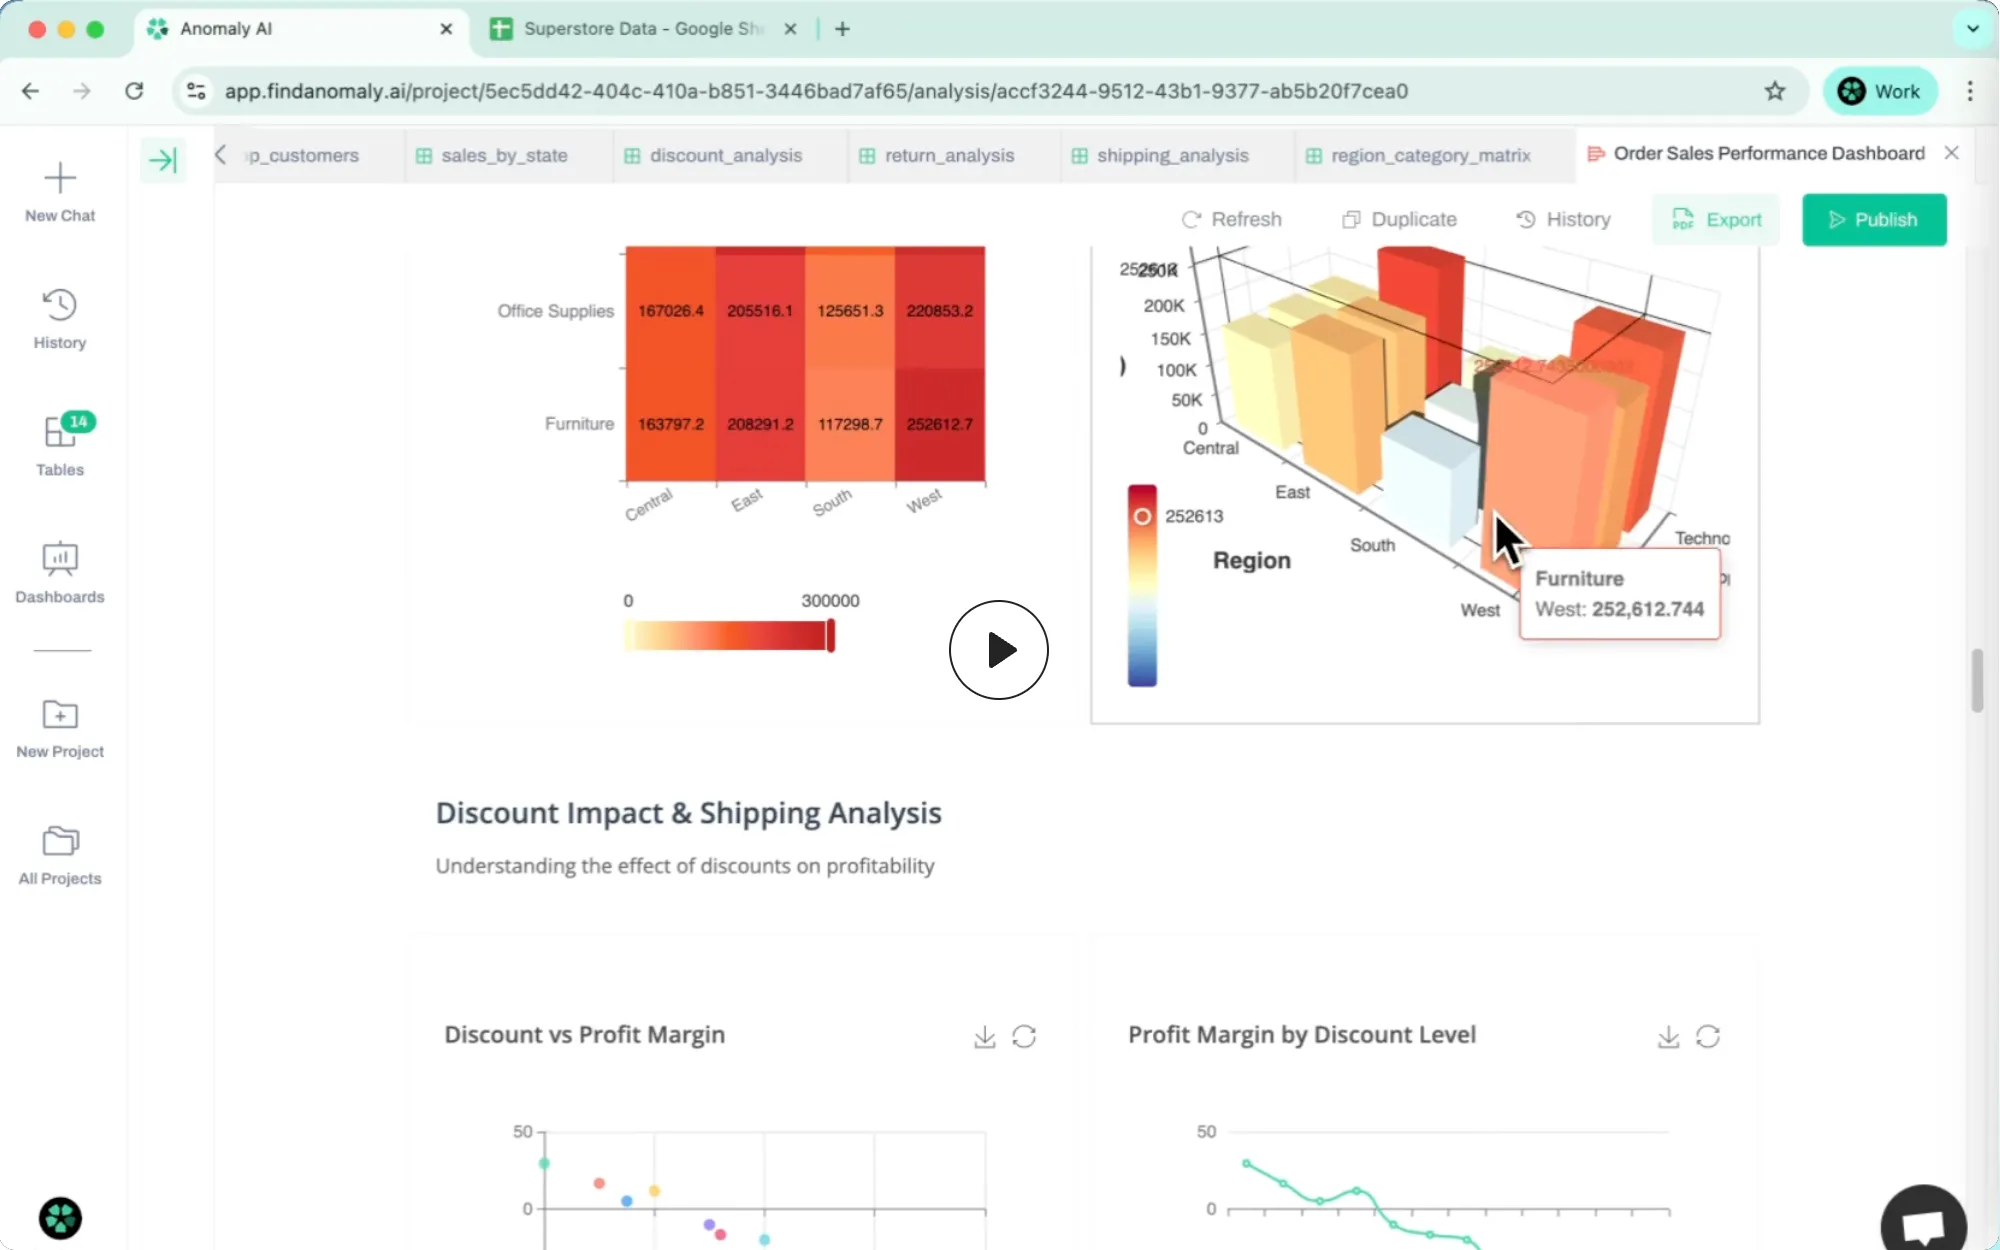
Connect the Data Behind Your Reports
Use the spreadsheets, GA4 properties, ad platforms, sheets, warehouses, and databases you already rely on, then turn them into repeatable dashboards and reports.
How It Works
Connect recurring business data, ask the question, get a dashboard or report, then refresh the workflow when new data arrives.
Connect your business data
Start with Excel, GA4, ad accounts, spreadsheets, or databases. Anomaly handles large datasets with automatic validation, type detection, and a workspace built for recurring reporting.
AI automatically prepares your data
The AI scans your data for quality issues, inconsistencies, duplicates, date formats, missing values, and outliers so the analysis starts from a cleaner, more reliable foundation.
Apply definitions and calculations
Turn raw data into source-backed calculations, KPIs, metric definitions, business rules, trends, and summaries that can be reviewed and reused across future reporting cycles.
Generate dashboards and reports
Create interactive dashboards, refreshable business reports, and stakeholder-ready summaries with traceable logic, source data, assumptions, and calculations.
Use Cases
Built for post-Excel analytics: teams that still think in spreadsheet workflows but need a more reliable layer for larger, messier data.
Weekly Marketing Performance
Turn GA4, Search Console, and ad-platform exports into a repeatable report that explains what moved, which channel changed, and what to do next.
Finance and Margin Reviews
Refresh revenue, cost, margin, and budget reports from recurring spreadsheets so every board or operating review starts with a defensible view.
Customer and Product Reports
Track retention, feature usage, cohorts, and customer behavior without rebuilding the same dashboard every week.
People and Team Reporting
Create recurring workforce, productivity, and service-quality reports from HR, support, and operations data.
Operations Dashboards
Review production, inventory, service levels, and cost movement from large operational datasets that no longer fit cleanly in spreadsheets.
Client and Stakeholder Packs
Move from raw exports to client-ready dashboards, findings, and refreshable reports with the evidence kept close to the numbers.
Ready to make reporting repeatable?
Start with the spreadsheets, GA4 exports, ad data, and databases you already use. Anomaly turns them into dashboards, insights, and reports you can refresh and defend.