
AI Data Analyst for GA4
Connect a Google Analytics 4 property and ask questions in plain English. Anomaly analyzes acquisition, campaigns, landing pages, and conversions, then turns the answer into a dashboard, report, or export you can check before you share it.
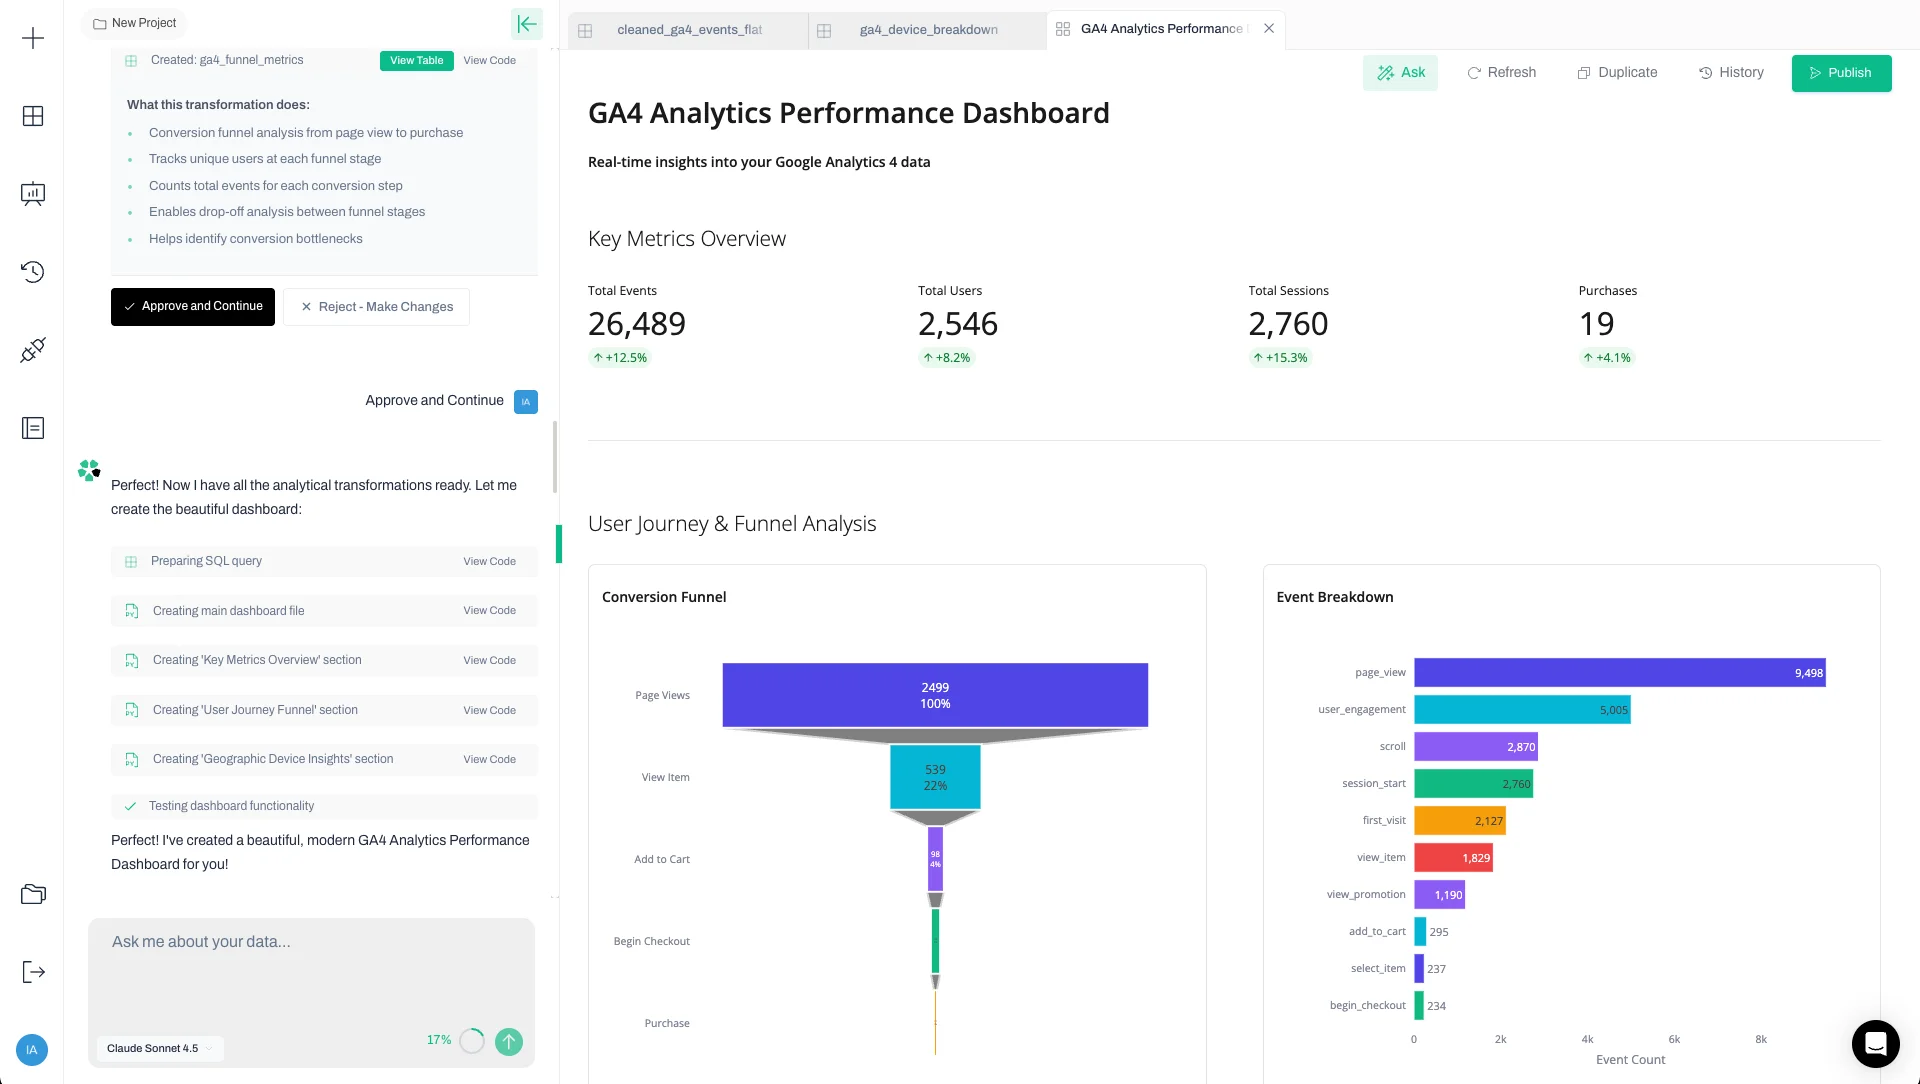
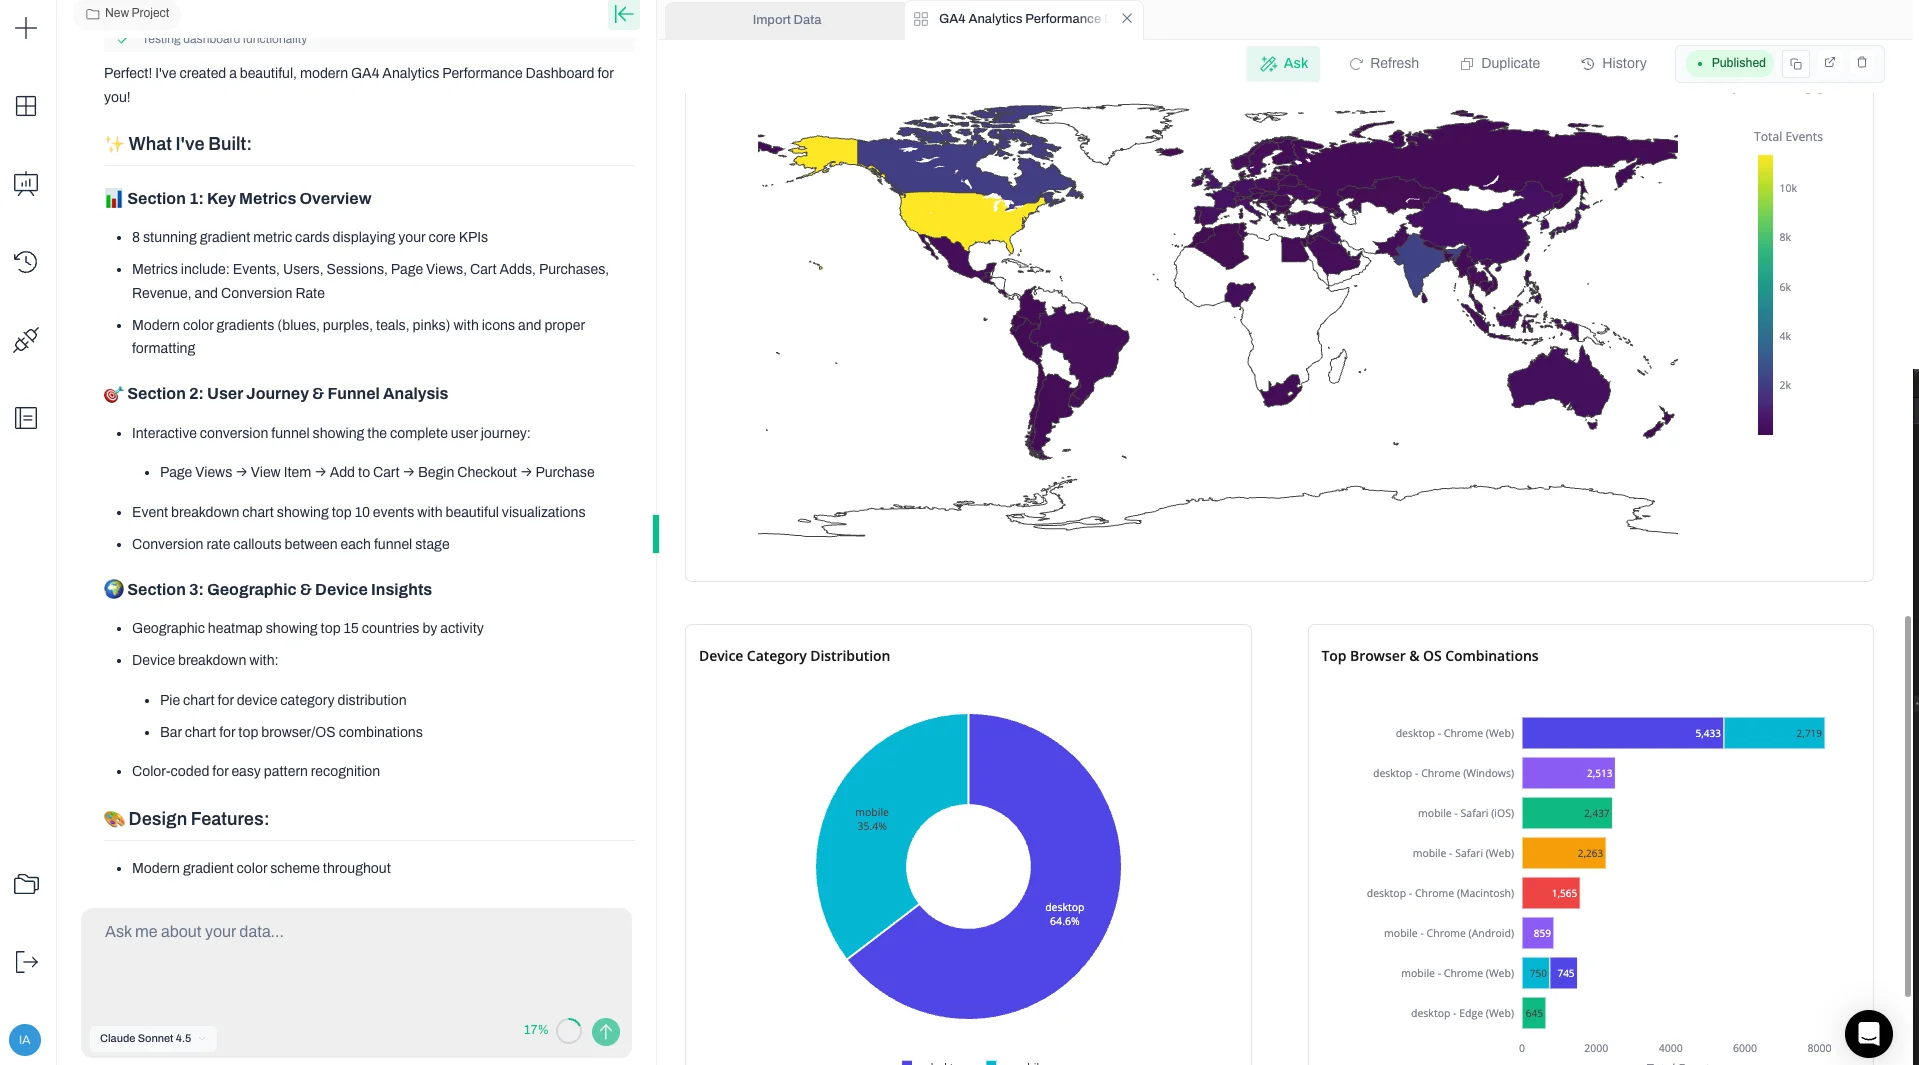
Analyze GA4 Data With AI
Connect GA4, ask for the analysis you need, and turn the answer into a dashboard, report, spreadsheet, slide deck, or PDF you can check before sharing.
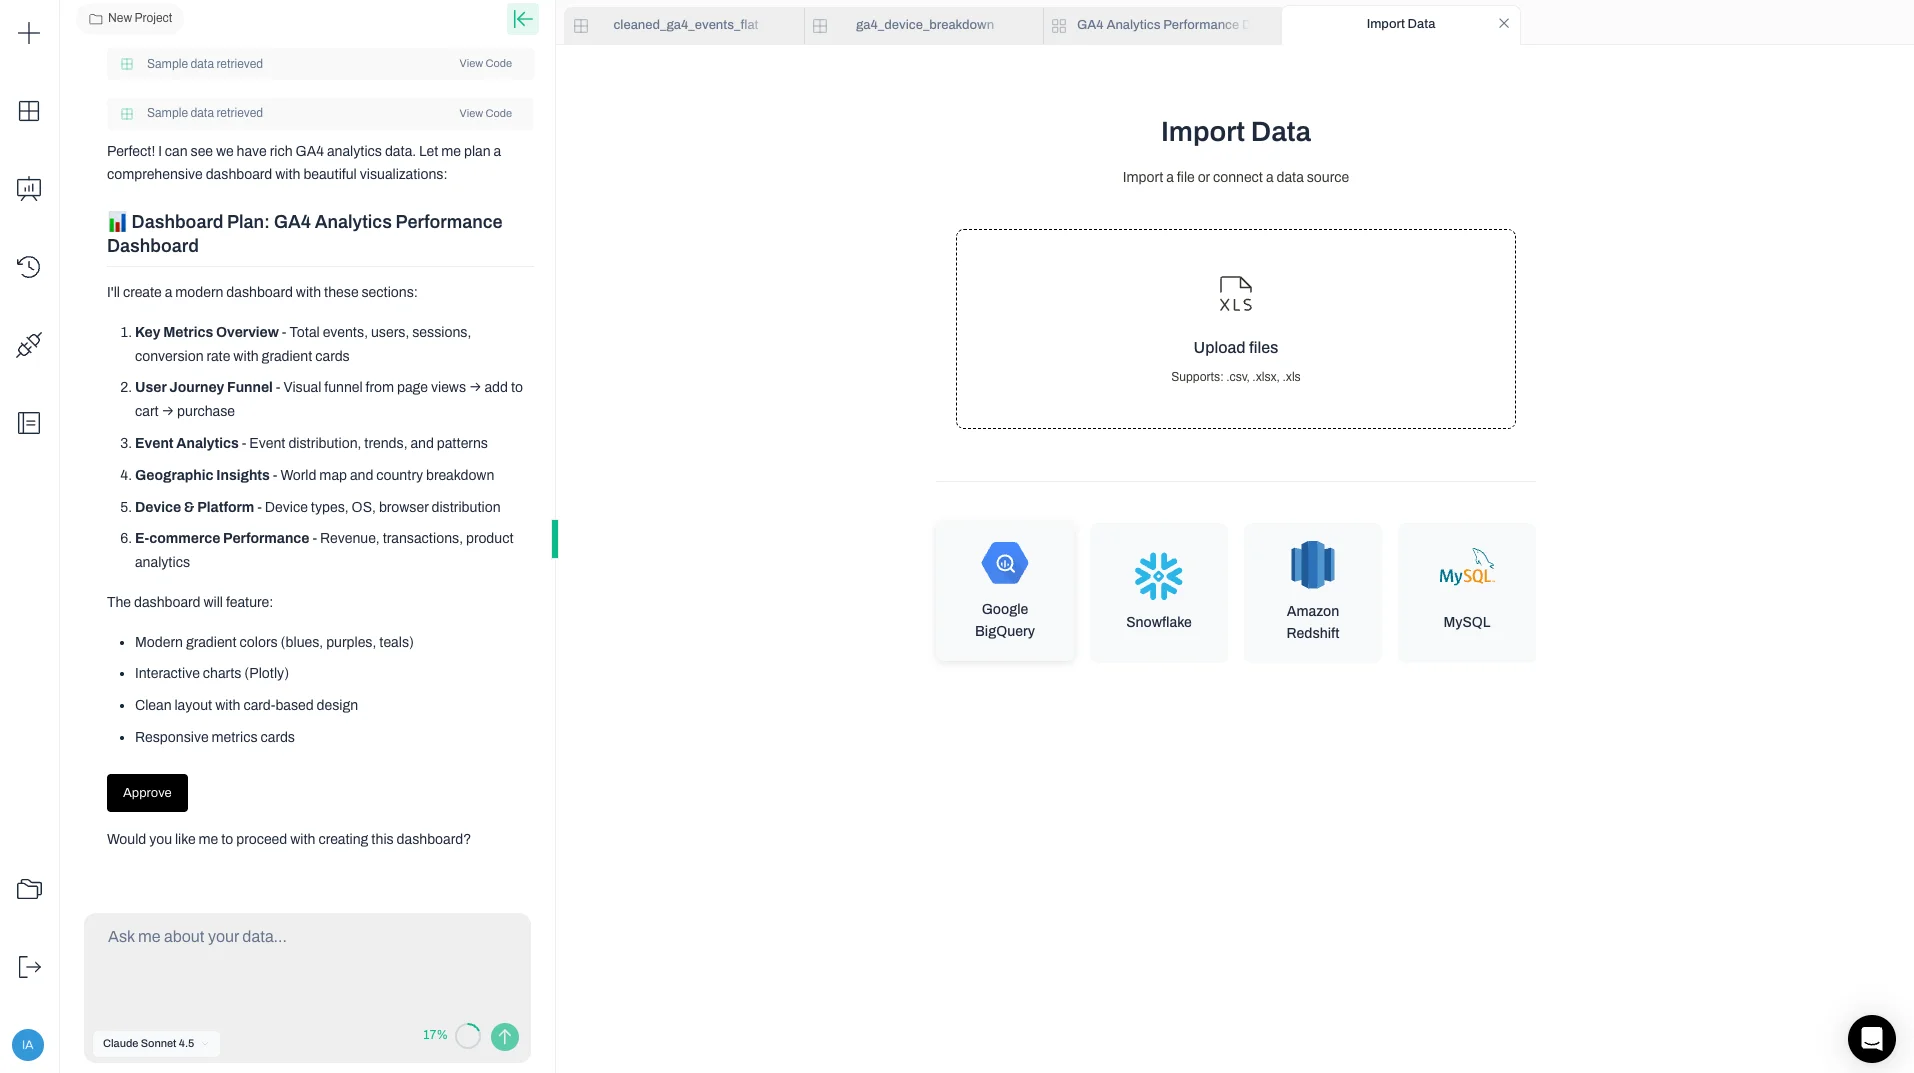
Connect GA4
Use the GA4 connector for current reporting, or point Anomaly at your GA4 BigQuery export when you need raw event rows.
Ask in plain English
Ask about acquisition, campaigns, landing pages, conversion rate, key events, or revenue without building the report by hand.
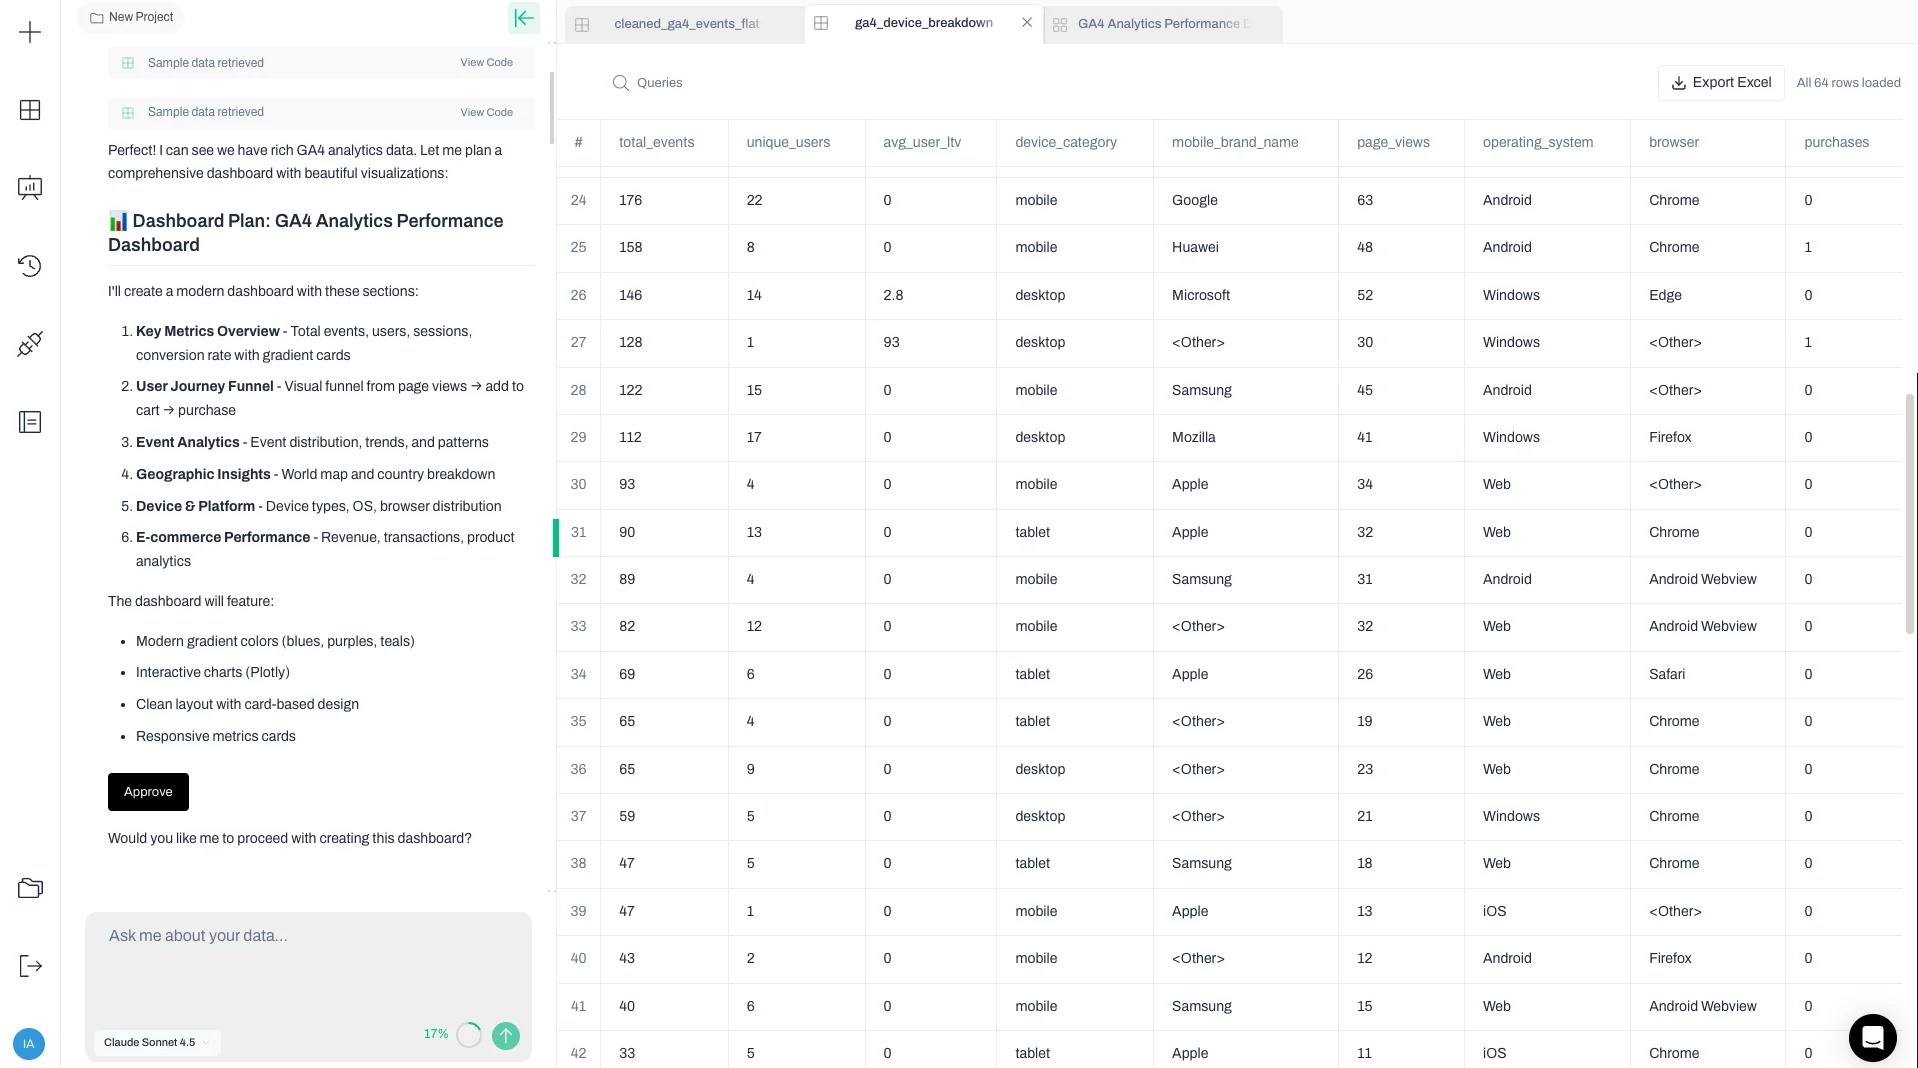
Check and share
Inspect the query, filters, source rows, and assumptions, then share the dashboard or export a stakeholder-ready report.
How It Works
Connect recurring business data, ask the question, get a dashboard or report, then refresh the workflow when new data arrives.
Connect Your GA4 Property
Connect a GA4 property through the GA4 API, or point Anomaly at your GA4 BigQuery export if you already have it enabled. Choose the property you want to analyze.
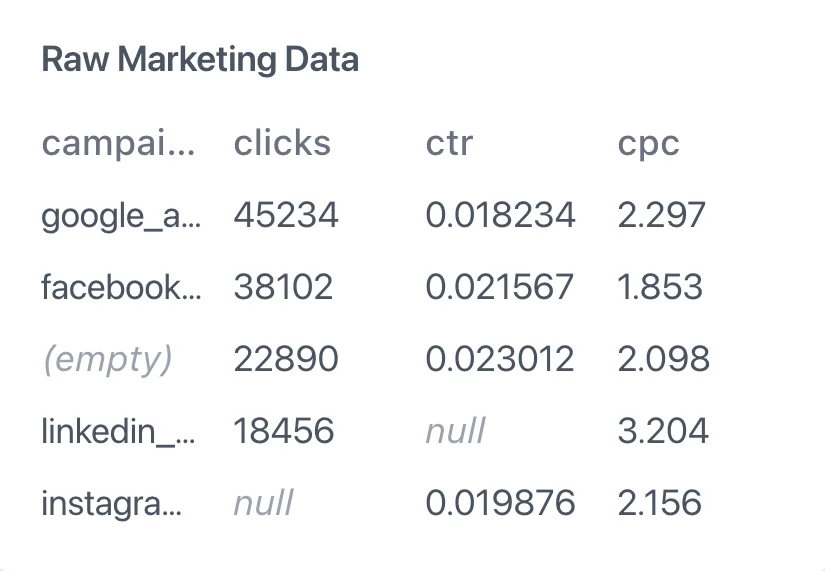
AI Analyzes Your Marketing Data
Anomaly examines your events, key events, traffic sources, and engagement metrics to work out how the property is structured and how your campaigns and landing pages are performing.

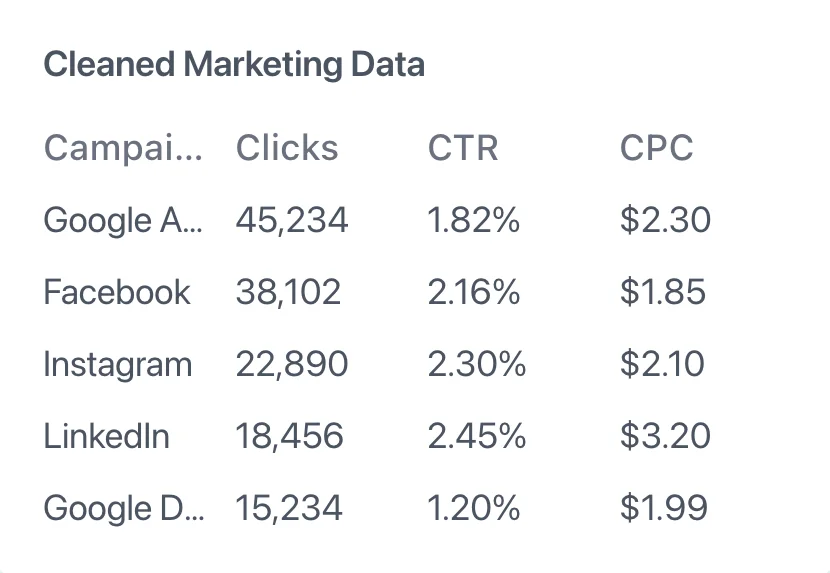
Generate Marketing Insights
Get automated insights about campaign performance, key events, and audience behavior. Ask questions in natural language about your marketing data.
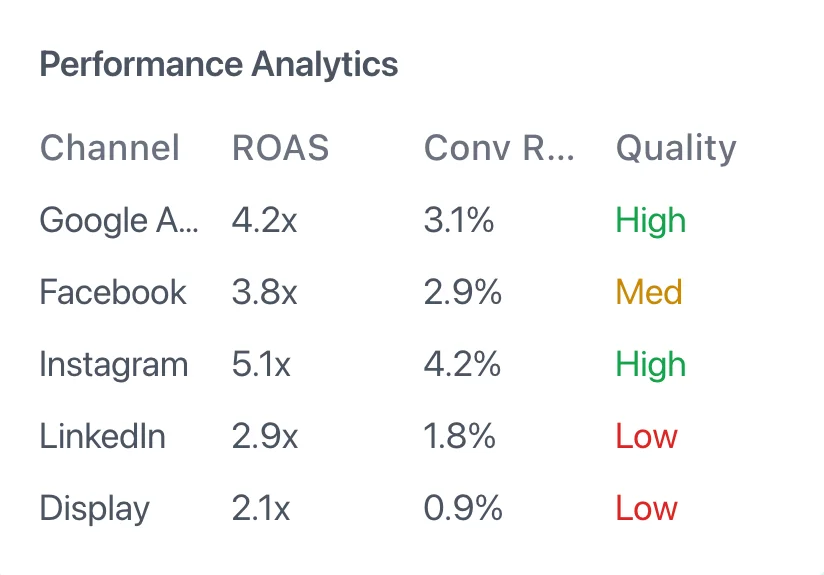
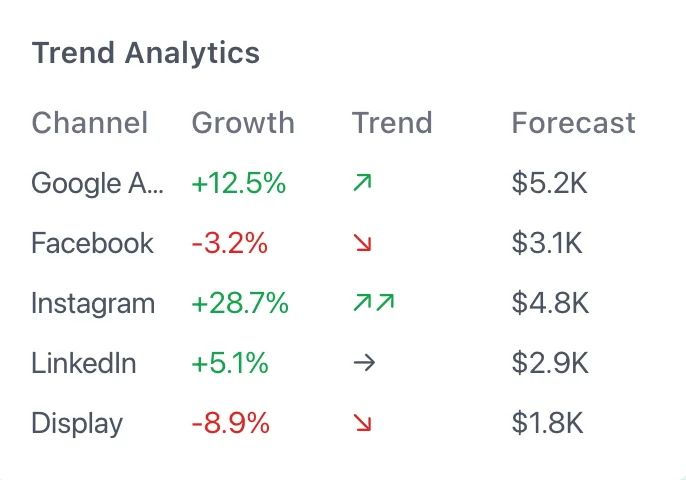
Share Marketing Reports
Share dashboards with your marketing team, export to Excel, PowerPoint, or PDF, and schedule the report as a recurring email with the PDF attached.
Powerful Features for GA4 Analytics
Connect GA4 through the GA4 API or your BigQuery export, alongside Excel and CSV uploads up to 1GB, Google Sheets, BigQuery, and MySQL. Ask in plain English and get dashboards, Excel reports, PowerPoint, Word docs, and PDFs, with repeatable calculations and scheduled email delivery when you need the same report every week.

Recurring Marketing Analysis
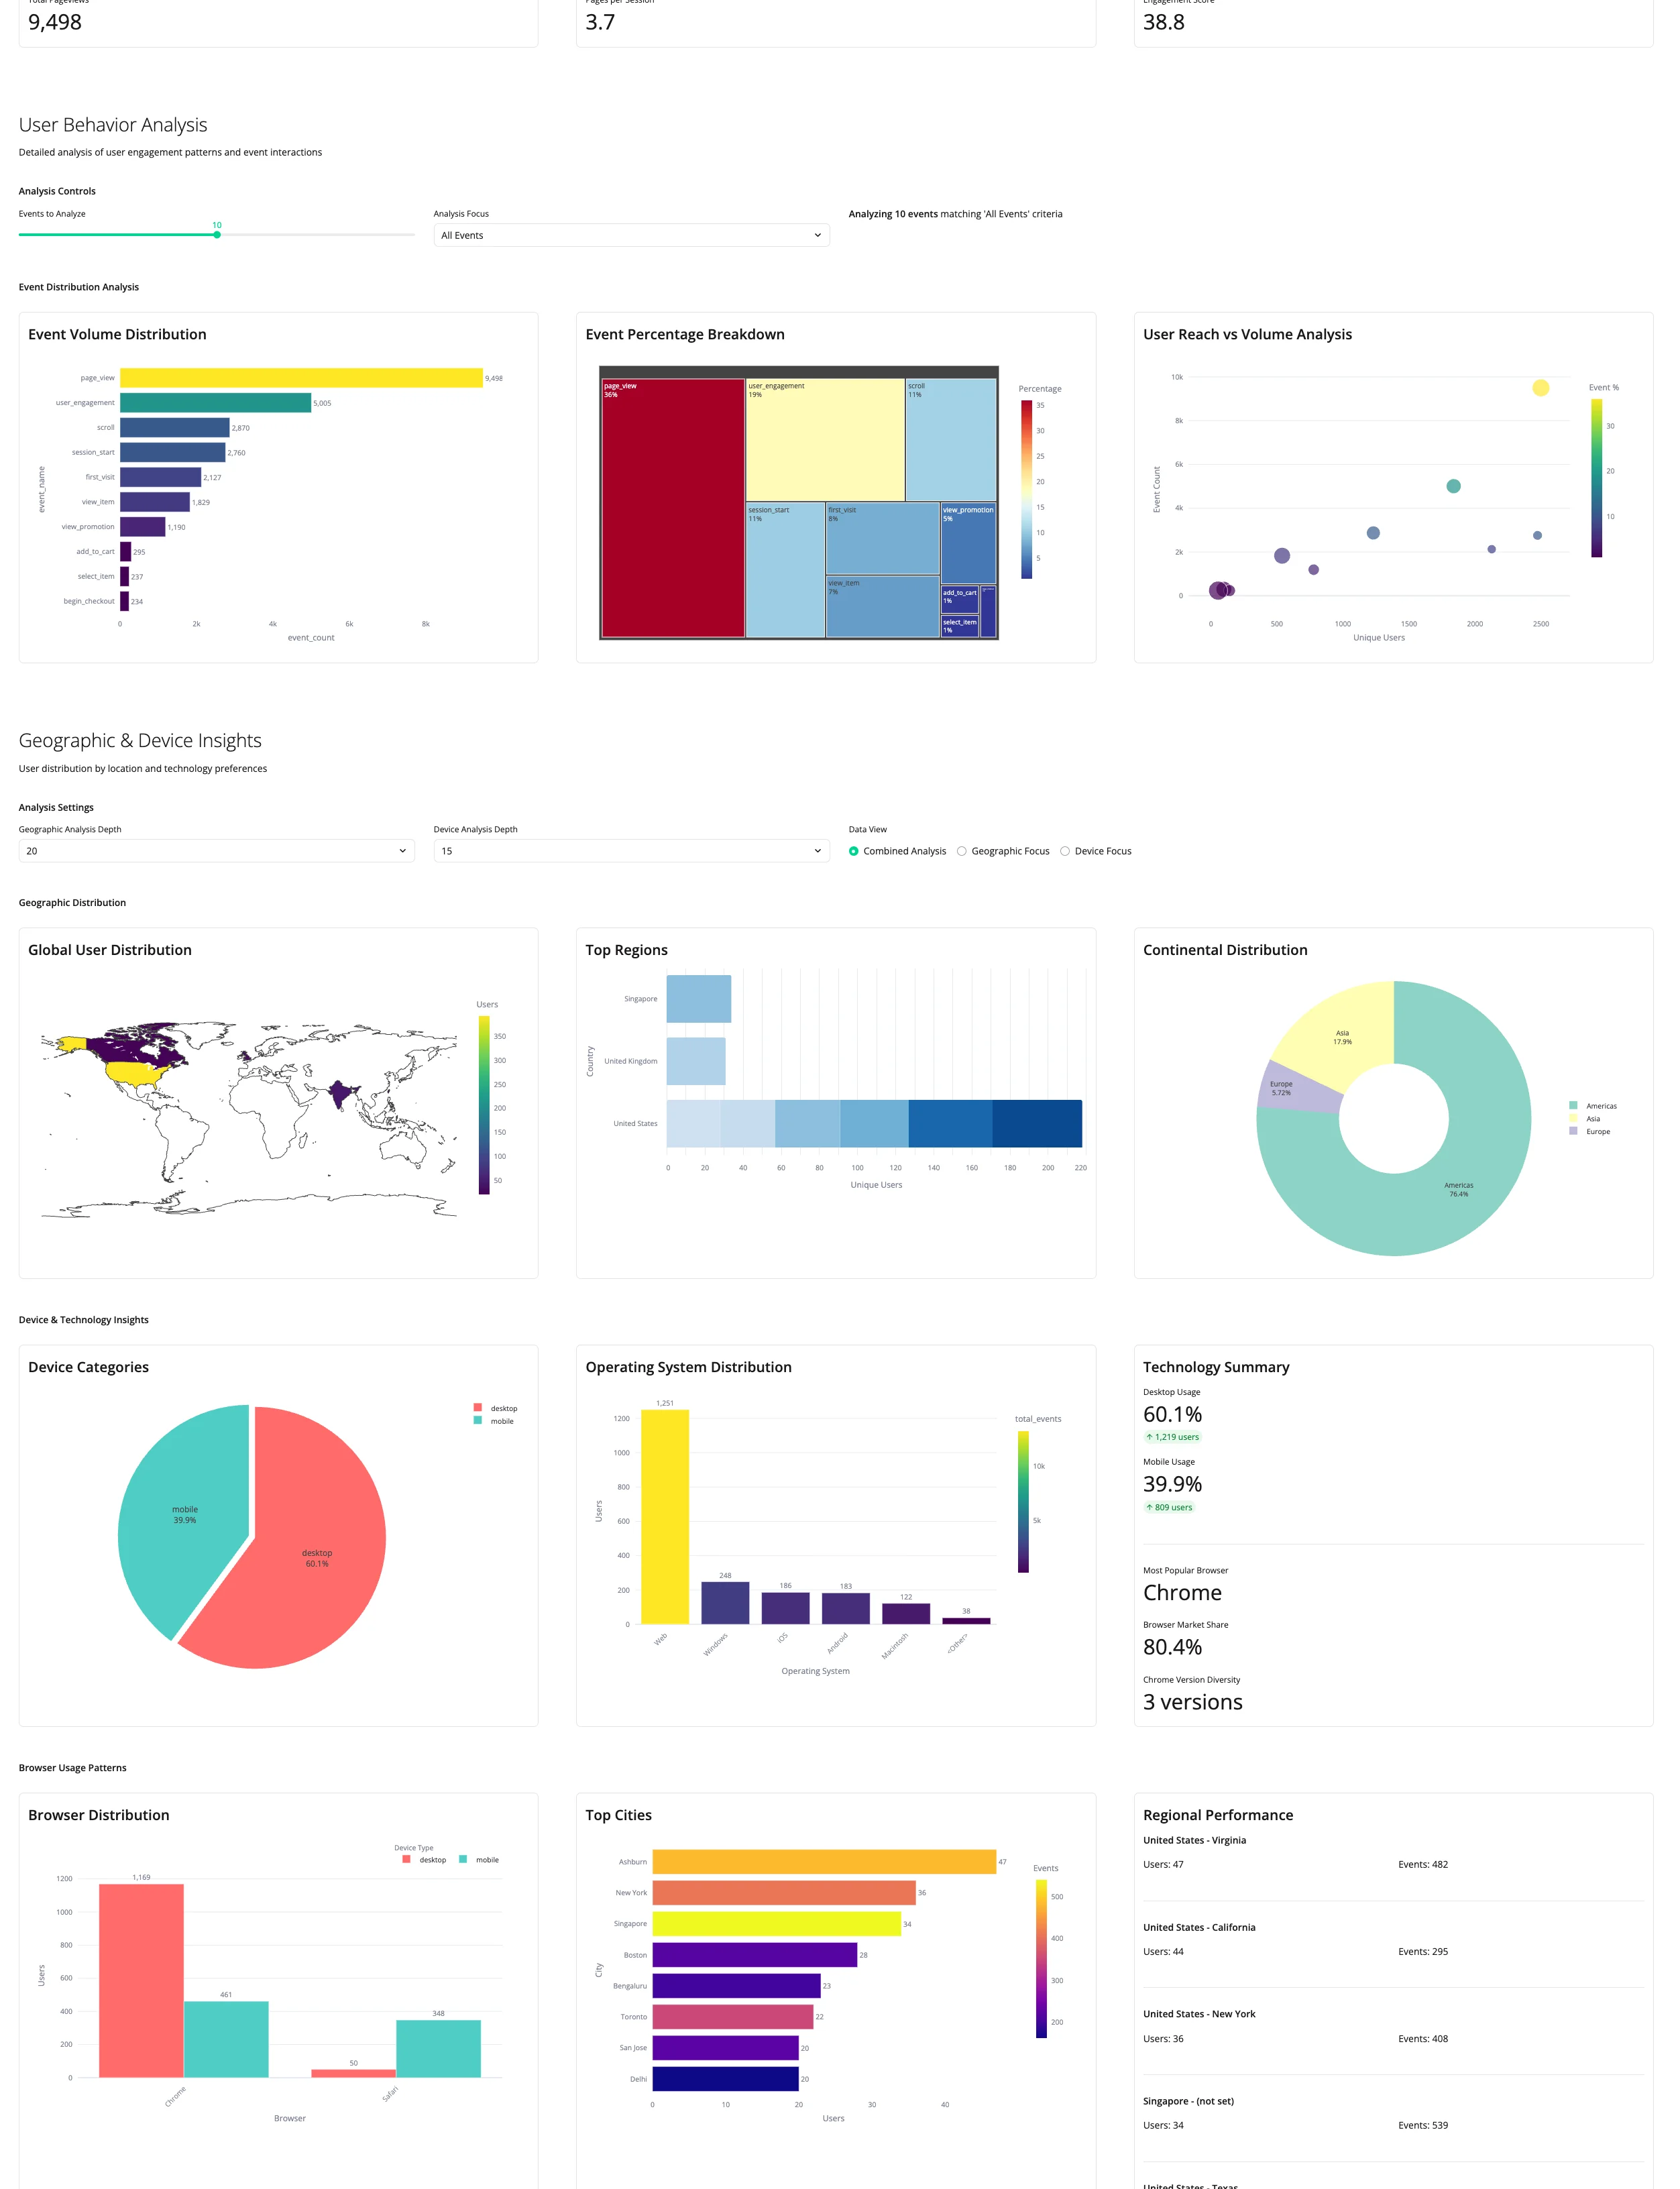
AI analyzes GA4 traffic sources, campaigns, landing pages, and key events so weekly reporting starts with the movement that matters.
Refreshable Marketing Dashboards
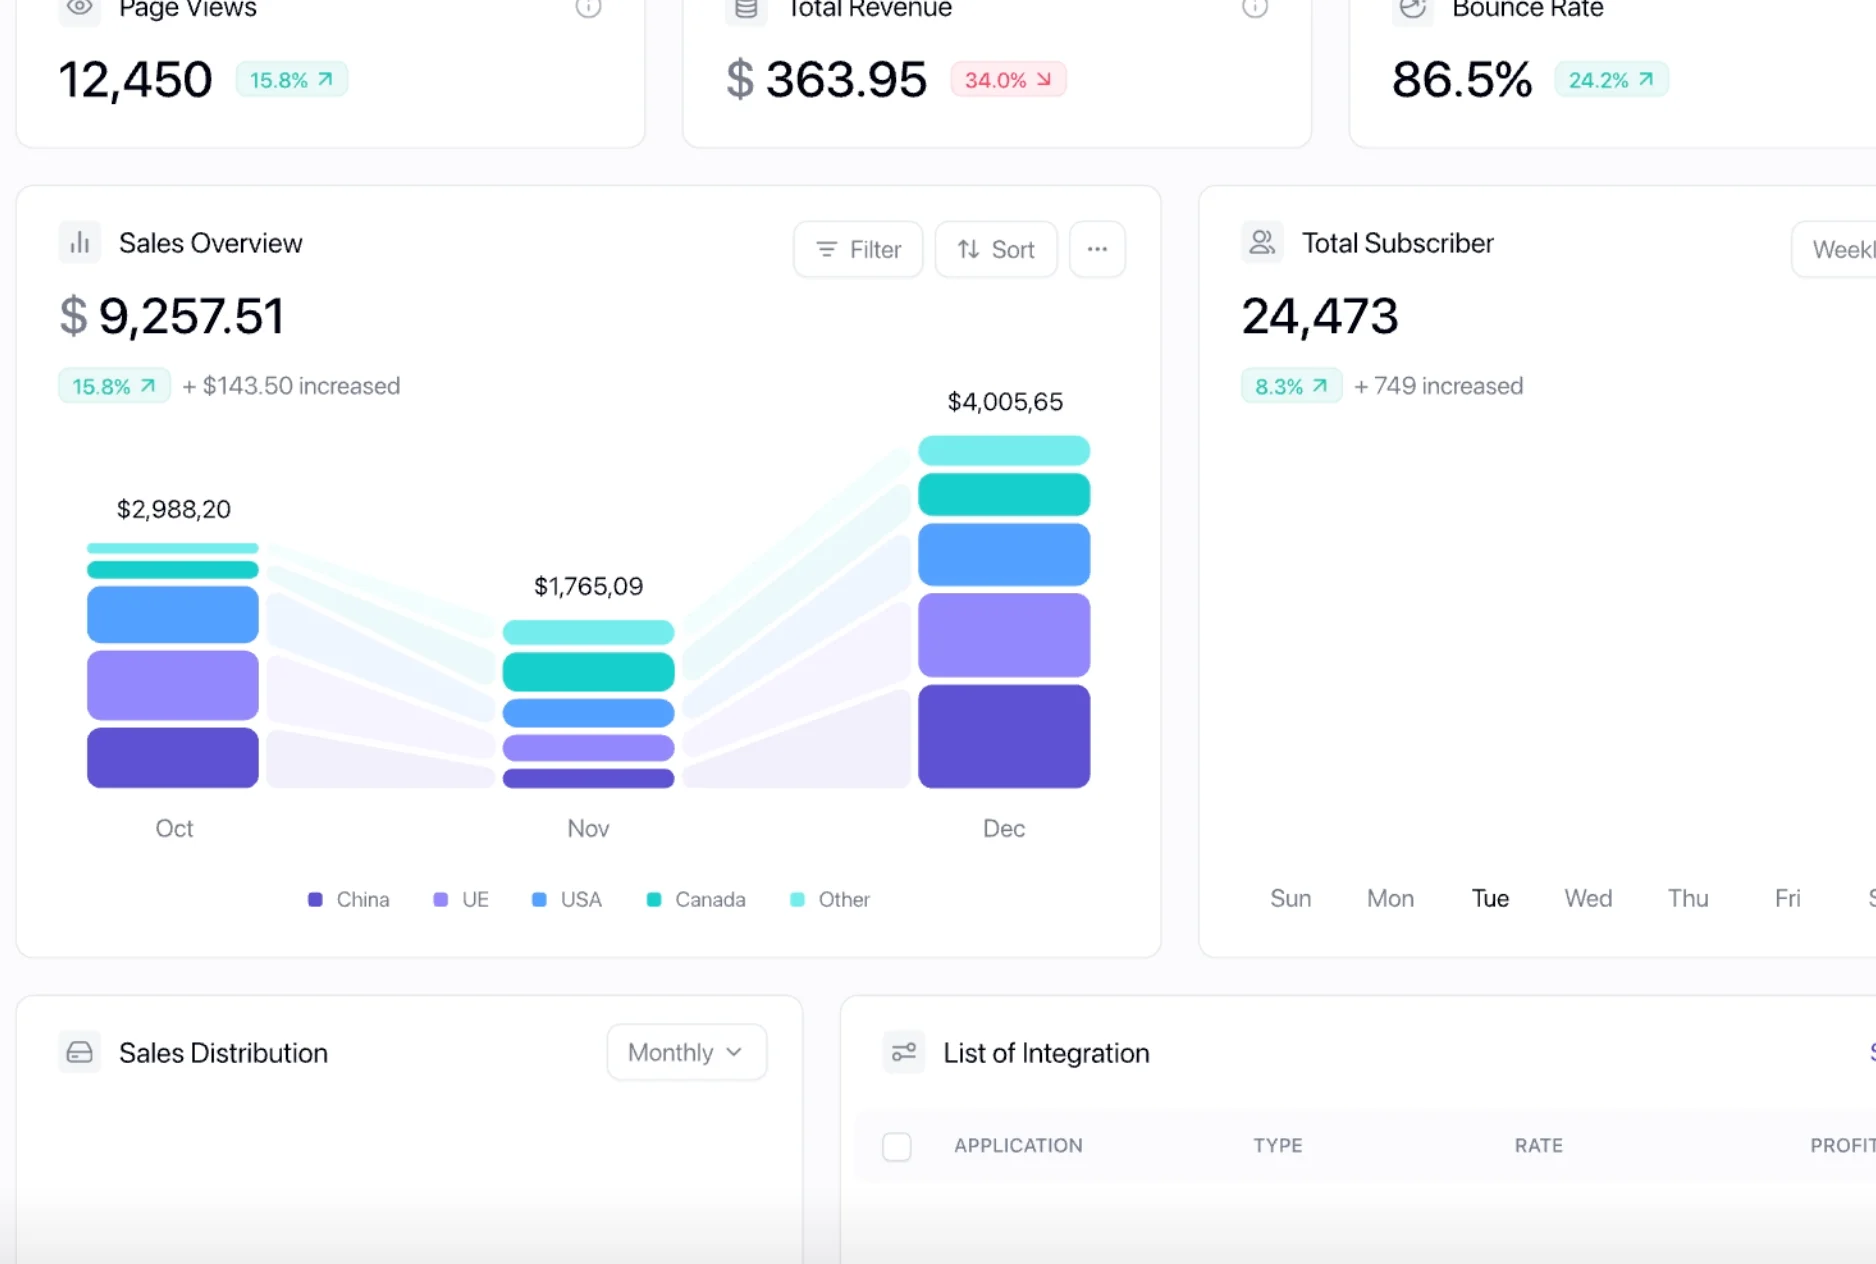
Build marketing dashboards and recurring reports from GA4 data, then re-run them on demand or on the schedule you set instead of rebuilding the export by hand.
Conversion and Funnel Analysis
Analyze key events and conversion performance across campaigns, devices, and landing pages. Step-by-step funnel and drop-off analysis runs on a connected GA4 BigQuery export, where the raw event rows live.

GA4 + BigQuery Integration
Connect your GA4 BigQuery export to query raw event rows directly, across the dates that have been exported since you linked it and are still retained.

Attribution Analysis
Compare channel and campaign performance, and see the conversion credit GA4 assigns under your configured attribution model.
Conversion and Funnel Analysis
Recurring Marketing Analysis
AI analyzes GA4 traffic sources, campaigns, landing pages, and key events so weekly reporting starts with the movement that matters.
Refreshable Marketing Dashboards
Build marketing dashboards and recurring reports from GA4 data, then re-run them on demand or on the schedule you set instead of rebuilding the export by hand.
GA4 + BigQuery Integration
Attribution Analysis
Frequently Asked Questions
How do I analyze GA4 data with AI?
Can AI build a GA4 dashboard for me?
Is there an AI tool for Google Analytics?
How does GA4 integration work?
Can I analyze historical GA4 data?
Do I need to know GA4 reporting?
Can I customize the marketing dashboards?
How often does GA4 data update?
How is this different from GA4's built-in Explorations?
Can I analyze GA4 data alongside other marketing data?
Do I need GA4 BigQuery export enabled?
More GA4 guides
Step-by-step walkthroughs for the narrower GA4 jobs that come up around this work.
Dashboards and recurring reports
- Build a GA4 dashboard people actually check
Which metrics belong on a GA4 dashboard, how to lay it out, and what to leave off.
- Build a custom GA4 report
Working inside GA4's own report builder: dimensions, metrics, filters, and saved reports.
- Send the same GA4 report every week
A repeatable weekly reporting structure for stakeholders and clients.
Getting GA4 data into Excel
- Export GA4 to Excel: five methods
Setup and trade-offs for each way of getting Google Analytics 4 data into a spreadsheet.
- Export safely and check the file before you share it
Preserving scope and sampling when you pull larger exports past the UI limits.
- Reconcile an export that doesn't match GA4
Total users, year-over-year comparisons, and double counting: why the numbers diverge.
GA4 BigQuery export
- Set up the GA4 BigQuery export
Schema, SQL examples, cost control, and the pitfalls that catch people first.
- Query raw GA4 event data without writing SQL
Analyzing and validating event-level data when you would rather not hand-write queries.
When the numbers move unexpectedly
- GA4 anomaly detection methods
How the available detection and monitoring approaches compare, and what each one costs you.
- Work through a traffic drop, step by step
A triage checklist for the week traffic falls and you need an answer quickly.
- Investigate a drop without Python
Validating and segmenting a change, then explaining it to a client in plain language.
GA4's own AI features
- What GA4's predictive metrics actually do
Purchase probability, churn probability, and where Google's built-in AI stops.
Explore Other Data Connectors
Connect multiple data sources and centralize your analytics

BigQuery
Connect BigQuery and create dashboards, reports, and review packs with traceable logic

Excel
Upload Excel files up to 1GB and create dashboards, Excel reports, PDFs, slides, and docs

MySQL
Connect MySQL databases and turn operational data into dashboards and reports
Ready to get started with GA4?
Connect your GA4 data and turn it into refreshable dashboards, insights, and recurring reports.