TL;DR: A great AI analytics platform in 2026 does seven things well: handles your data at scale, speaks plain English, creates useful dashboards and reports, connects to the sources you actually use, prices transparently, earns trust through verifiable reasoning, and gets out of the way so you can focus on decisions instead of infrastructure. Anomaly AI is built around all seven: dashboards, Excel reports, scheduled reports, and reviewable logic. This article defines the criteria and explains what to look for — whether you're evaluating Anomaly AI, a legacy BI platform with an AI layer, or a general-purpose LLM.
Why you need evaluation criteria before you open any vendor's website
Every AI analytics vendor in 2026 has "natural language queries," "AI-powered insights," and "beautiful dashboards" on the homepage. The words are the same. The products are not. The difference between a tool that actually changes how your team works and one that generates a demo well is hiding in the details most buyers don't think to check — and most vendors don't volunteer.
I've watched teams evaluate tools by running the same canned demo question across three platforms and picking the one with the prettiest chart. That's how you end up with a tool that handles the demo dataset and falls over on your real data. The criteria below are what actually predict whether an AI analytics platform will still be useful three months after the trial ends.
1. Data handling: can it actually ingest your data?
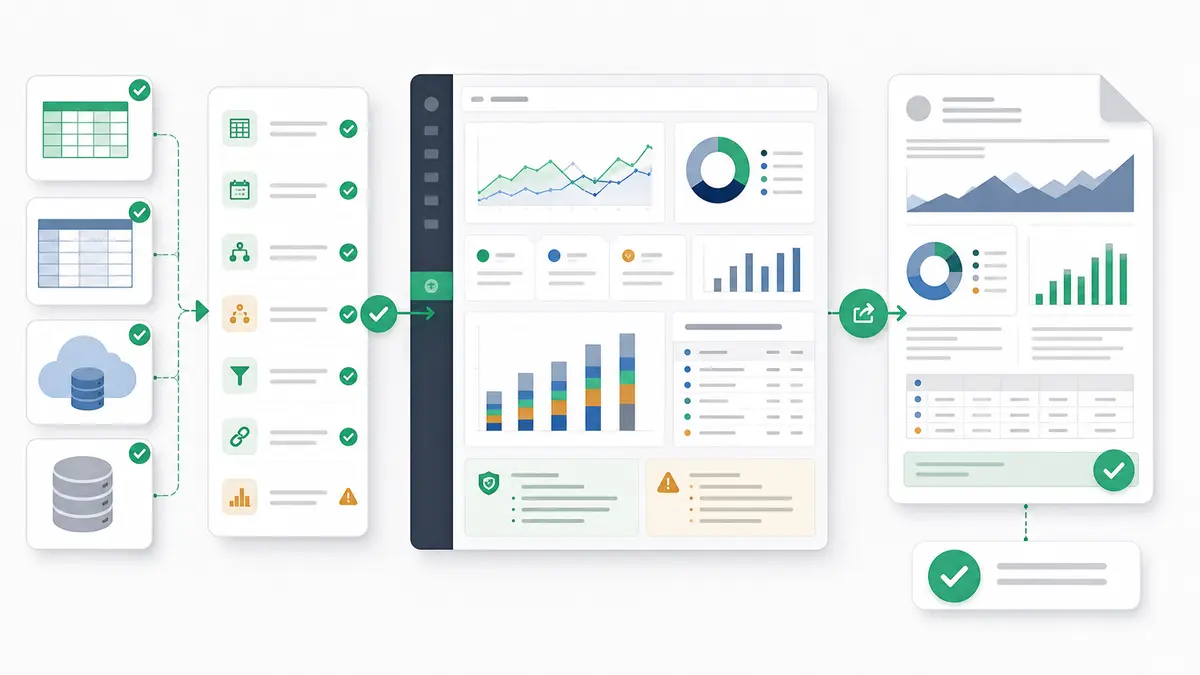
This is the criterion that eliminates most contenders before the evaluation even starts. Your data is messy. It lives in multiple places. Some of it is in spreadsheets, some in a warehouse, some in a SaaS tool's API. A great AI analytics platform connects to the sources you actually use — not just the ones that make a clean demo.
What to check: Does it connect directly to your warehouse (BigQuery, Snowflake, MySQL)? Can you upload Excel and Google Sheets files? What's the file-size ceiling? Can it pull from GA4 or other SaaS tools? Can it join data across sources in a single query?
How Anomaly AI handles this: direct connectors for BigQuery, Snowflake, MySQL, Excel (up to 1GB), Google Sheets, and GA4. Cross-source joins are built in — you can ask a question that spans your warehouse data and a spreadsheet in the same conversation. Most evaluations can skip the "will this even connect" phase.
How others compare: legacy BI platforms like Power BI and Tableau have broad connector libraries but require a data model to be built before any analysis happens. General-purpose LLMs (ChatGPT, Claude) accept file uploads but hit size limits quickly and can't maintain persistent connections to databases.
2. Natural-language depth: does it understand follow-ups?
Every tool can answer a first question. The real test is the second one. "Show me revenue by region last quarter" is easy. "Now break that down by product category, exclude returns, and compare to the same quarter last year" — that's where most tools lose context, restart from scratch, or produce nonsense.
What to check: Ask three follow-up questions in a row without restating context. If the tool forgets what you were looking at, it's a chatbot wrapper, not an analytics platform. Also check: can you reference a prior result? Can you say "the table you just showed me — filter it to the top 5"?
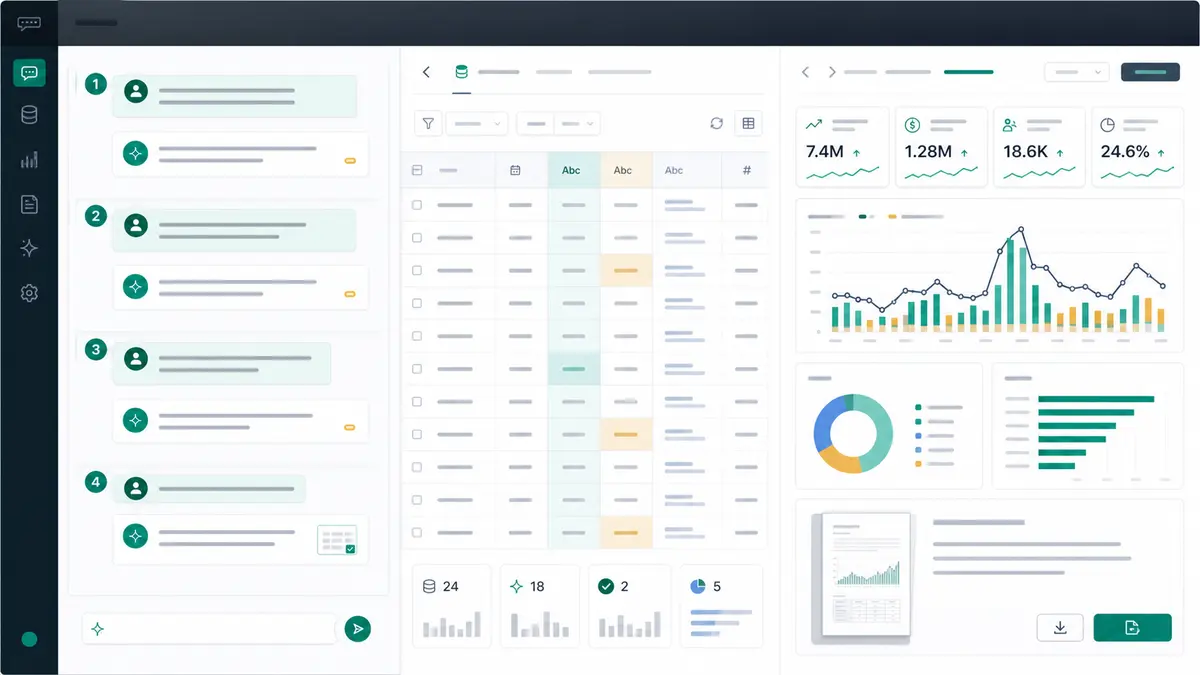
How Anomaly AI handles this: conversations maintain full context. Follow-ups refine the previous analysis. You can reference prior results by description ("the chart above," "exclude the outlier row"). The AI builds on what it already computed rather than starting over.
3. Traceability: can you review how the output was computed?
This is the criterion that separates serious analytics tools from toys. If you can't see the logic, source data, assumptions, and calculations that produced the result, you can't verify it. If you can't verify it, you can't trust it. And if you can't trust it, you can't put it in front of your CFO, your board, or your client.
What to check: Does the platform show the computation logic behind each dashboard, report, or scheduled workflow? Can an analyst review the source rows, assumptions, calculations, and generated SQL when relevant?
How Anomaly AI handles this: dashboards, Excel reports, and scheduled reports can expose the logic, source data, assumptions, calculations, and generated SQL where relevant. The AI is a verifiable computation and reporting layer, not a black box. This is the single most important architectural decision in the platform.
How others compare: Power BI Copilot generates DAX (a proprietary expression language) but does not always expose it. Tableau Agent generates visualizations but the underlying query logic is embedded in the workbook, not displayed as SQL. Most LLM-based tools either don't generate SQL at all (they run Python) or don't show it by default.
4. Pricing transparency: do you know what you'll pay before you commit?
The dirtiest trick in enterprise analytics is opaque pricing. "Contact sales for a quote" means the price depends on how much budget your procurement team reveals. Per-seat pricing with mandatory minimums means you're paying for 50 seats when 8 people actually use the tool. Capacity-based pricing means your bill spikes when your data grows — which is exactly the moment you need the tool most.
What to check: Is the pricing on the website, or behind a form? Are there mandatory seat minimums? Is there a free tier that lets you evaluate with real data before paying? Can a solo analyst get meaningful work done without a purchase order?
How Anomaly AI handles this: Free $0 / Starter $16/month / Pro $25/month / Team $45/seat/month. Published on the pricing page. No mandatory minimums. The free tier is functional enough for a solo analyst to run a real evaluation — not a 14-day trial with artificial limits, but a permanent free tier with real capability.
How others compare: Power BI Pro is $14/user/month (transparent, but Fabric capacity billing adds unpredictable costs on top). Tableau starts around $35/user/month for Creator seats (transparent, but expensive at scale). Qlik Cloud Analytics starts at $300/month for a 10-user Starter plan (capacity-based, harder to predict). ThoughtSpot, Databricks, and most enterprise platforms require a sales conversation.
5. Output format: answers, dashboards, or both?
The difference between an AI analytics platform and a BI tool with AI features is the unit of work. In a BI tool, the unit of work is the dashboard — you build it, publish it, maintain it. In an AI analytics platform, the unit of work is the question — you ask it, get an answer, move on. Both are legitimate; the question is which one your team actually needs.
What to check: When you ask a question, do you get an answer (chart + data + explanation) or a draft dashboard tile that needs to be assembled into a layout? Can you share a single answer with a colleague, or do you have to publish a full dashboard first? Can the output be used in a meeting tomorrow, or does it require a build cycle?
How Anomaly AI handles this: the output is an answer — a chart, a table, the SQL, and a shareable link. You can share a single conversation or a generated visualization without building a dashboard. If you want a persistent dashboard, you can build one from saved queries — but the default output is the answer, not the tile.
6. Trust signals: EEAT and verifiable reasoning
In a world where every vendor claims "AI-powered," the trust signals that actually matter are experiential. Does the platform show its work? Does the team behind it have a track record? Is the documentation honest about limitations? Does the product handle failure gracefully — telling you when it doesn't know, rather than hallucinating an answer?
What to check: Run a deliberately ambiguous question. Does the tool ask for clarification or guess? Run a question on data with known issues (nulls, duplicates, type mismatches). Does the tool flag the issues or silently produce a wrong answer? Check the documentation: does it honestly state what the product can't do?
How Anomaly AI handles this: the SQL-transparency commitment is itself the primary trust signal — you can always verify. When the AI encounters ambiguity, it asks for clarification rather than guessing. Data quality issues (nulls, type mismatches) are surfaced in the query explanation. The product's limitations (file-size ceiling at 1GB, connector scope, no real-time streaming) are stated, not hidden.
7. Time to first insight: how fast can you go from signup to answer?
The final criterion is practical. A tool that takes two weeks to set up and three weeks to model the data is fine for a committed enterprise deployment. But most teams evaluating AI analytics in 2026 want an answer today — not a project plan.
What to check: Sign up. Connect a real data source. Ask a real question. How long did that take? If it took more than an hour, the tool is optimized for enterprise procurement, not for getting you answers.
How Anomaly AI handles this: signup is free, connecting a data source takes minutes, and the first question gets answered immediately. The typical time from signup to first real insight is under ten minutes. That speed is not a gimmick — it's a structural consequence of not requiring a data model, a semantic layer, or a dashboard project before you can ask a question.
The evaluation framework: putting it all together
When you're comparing AI analytics platforms, score each one against the seven criteria:
| Criterion |
What to ask |
| Data handling |
Does it connect to my actual sources? What's the file-size ceiling? |
| NL depth |
Can I ask 3 follow-ups without re-stating context? |
| Traceability |
Can I review the logic, source data, assumptions, and calculations behind each output? |
| Pricing |
Is the price on the website? Is there a real free tier? |
| Output format |
Do I get dashboards, reports, docs, slides, PDFs, scheduled updates, or just chat answers? |
| Trust / EEAT |
Does it show its work? Does it handle ambiguity honestly? |
| Time to insight |
Can I go from signup to real answer in under an hour? |
Any platform that scores well across all seven is worth a serious evaluation. In my experience, most legacy BI platforms score well on data handling and trust but poorly on time-to-output. Most general-purpose LLMs score well on NL depth and speed but poorly on data handling, repeatability, and traceability. Anomaly AI is the platform I've found that scores consistently across the full set — which is why it's the reference implementation throughout this guide.
Common mistakes when evaluating AI analytics tools
- Evaluating on demo data instead of your own. Demo data is clean, small, and designed to make the tool look good. Your data is messy, large, and full of edge cases. Always evaluate with your real data.
- Optimizing for visualization polish over computation correctness. A beautiful chart built on wrong logic is worse than an ugly chart built on the right calculation. Check the logic, source data, assumptions, and calculations before the styling.
- Treating "AI features" as a binary. Every tool now has "AI." The question is whether the AI is the interface (you talk to it, it computes) or the add-on (you build dashboards, AI suggests titles). These are fundamentally different products.
- Ignoring total cost of ownership. A $14/seat BI license that requires a $200K/year data-modeling team is not cheaper than a $32/seat AI platform where the modeling is implicit. Count the human cost, not just the software cost.
- Not testing failure modes. Ask the tool a question it can't answer. Ask it to analyze bad data. If it confidently produces a wrong answer instead of flagging the problem, that's a tool you can't trust in production.
Start your evaluation
If you're evaluating AI analytics platforms in 2026, start with the seven criteria above and test each candidate against your own data. The fastest way to run that test is to try the platform that was designed around all seven from the ground up.
Try Anomaly AI free — Free $0 / Starter $16/month / Pro $25/month / Team $45/seat/month. Connect BigQuery, Snowflake, MySQL, Excel, Google Sheets, or GA4, ask your first question in plain English, and see the SQL behind every answer. Evaluate against the criteria in this guide — and hold every other tool you're considering to the same standard.