
Budget vs actual variance analysis in Excel: how to explain the gap
Budget vs actual variance analysis compares what you planned to what happened, line by line, so you can explain the gap and act on it. The arithmetic is simple; the parts people get wrong are the sign convention and the zero-budget line. Here are the formulas, both traps, and how to drill into the lines driving the number.
Quick answer — budget vs actual variance
For each line, variance = actual − budget and variance % = variance ÷ budget. Then apply the sign convention: for a revenue line, actual above budget is favourable; for a cost line, actual above budget is unfavourable. The two mistakes almost everyone makes are treating every positive variance as good (it depends on the line type) and dividing by a zero budget — for an unbudgeted line, show the variance in currency and its variance % as N/A, not 0% or infinity.
For finance, FP&A & operators·Excel, or upload your budget/actual file
What it is, and the formulas
A variance is the difference between an actual result and its budget, per line and per period. Two numbers describe it. The absolute variance (actual − budget) is the size of the gap in money. The variance percentage (variance ÷ budget) scales it, so a line that is small in dollars but 100% off plan stands out next to a big line that is 2% off. Report both — the dollars for materiality, the percentage for surprise.
The sign is where judgment enters, and it depends entirely on the line type. On a revenue line, beating budget is favourable; on a cost line, coming in under budget is favourable and overspending is unfavourable. A raw "+500" means opposite things on Revenue and on COGS, which is why a good variance report carries a favourable / unfavourable column instead of leaving you to read plus and minus signs. That convention is something you decide from your chart of accounts; it is not something to guess.
On the downloadable sample the columns are A line, B type, C budget, D actual. These copyable formulas reproduce the whole report — fill each down all five rows:
- — Variance in E2:
=D2-C2 - — Variance % in F2 (zero-budget guard):
=IF(C2=0,"N/A",E2/C2) - — Favourable / unfavourable in G2, from the supplied type:
=IF(B2="revenue",IF(E2>=0,"Favourable","Unfavourable"),IF(E2<=0,"Favourable","Unfavourable")) - — Signed favourable impact in H2, for ranking and the net:
=IF(B2="revenue",E2,-E2); then=SUM(H2:H6)gives the net (+1,700 on this sample).
The type column is an input you supply — the formulas read it rather than guessing revenue versus cost from an account name.
A budget variance analysis report and example
Here is a small report across five lines. Read down the F/U column, not the raw variance: COGS is the only unfavourable cost line, and NewInitiative — spend with no budget behind it — is flagged N/A on percentage but still counts in full.
| Line | Budget | Actual | Variance | Variance % | F / U |
|---|---|---|---|---|---|
| Revenue | 10,000 | 11,000 | +1,000 | +10% | Favourable |
| COGS | 4,000 | 4,500 | +500 | +12.5% | Unfavourable |
| Marketing | 2,000 | 1,500 | −500 | −25% | Favourable |
| Travel | 1,000 | 0 | −1,000 | −100% | Favourable |
| NewInitiative | 0 | 300 | +300 | N/A | Unfavourable |
| Net operating result | 3,000 | 4,700 | +1,700 | Favourable |
Across these five sample lines the net operating result is 1,700 favourable (budget 3,000, actual 4,700): Revenue beat plan by 1,000 and Travel spent none of its 1,000 budget, partly offset by COGS overspending 500 and 300 of unbudgeted NewInitiative spend. Notice how the story lives in three or four lines, not the total. Download the file and follow along:
Download the sample budget vs actual file
b3_budget_actual.csv — five lines with a budget, an actual, and a line type, including one unbudgeted line. It produces the variance report above. Synthetic data.
Flexible budget and budget-vs-forecast variance
Flexible budget variance answers a fair objection to a plain comparison: if you did more business than planned, of course you spent more. A flexible budget restates the budget at the activity level you actually reached — budgeted for 1,000 units, sold 1,200, so flex the variable lines to 1,200 — before comparing. What is left is the variance that is not just about doing more, which is the part worth investigating.
Budget vs forecast variance is a different comparison: your latest in-period forecast against the original budget. Budget-vs-actual grades how the period turned out against the plan; budget-vs-forecast shows how your own expectations have moved since you set it. Both are useful, and they answer different questions — this page is about the budget-vs-actual view.
Drill into the lines driving the gap
Building this in Excel means a variance column, a percentage column with a guard against dividing by zero, a sign rule per line, and a sort by impact. You can also describe it once and let an AI data analyst like Anomaly compute it and show its working. Import the file (New project → Import Data), then state the rules — including which lines are revenue versus cost, so the favourable/unfavourable labels are yours, not a guess:
From b3_budget_actual, compute variance = actual − budget and variance % = variance ÷ budget per line. Treat the type column as revenue or cost: for revenue, actual over budget is favourable; for cost, under budget is favourable. Show variance % as N/A where budget is 0. Give me a table with a favourable/unfavourable impact column, ranked by impact, and the net.
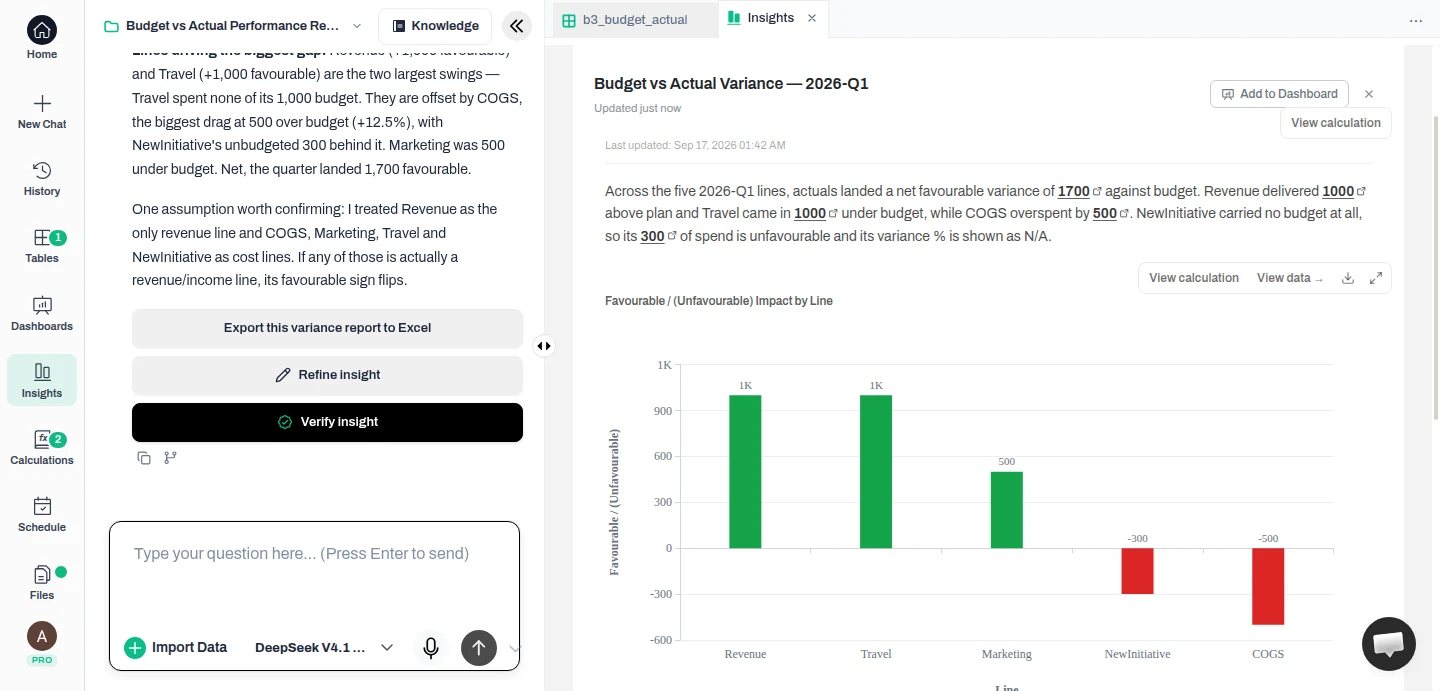
Result — It returned the ranked table and the impact-by-line chart, reconciled to +1,700 favourable, with NewInitiative’s variance % correctly shown as N/A rather than a divide-by-zero. It applied favourable/unfavourable from the line types you supplied — and noted the assumption in words (Revenue as the only income line, the rest as costs), so you can flip any line if your chart of accounts differs. Every number has a View calculation behind it.
The value is the ranking and the traceability, not a verdict on why: it surfaces the few lines that moved the total and shows the figures behind them, and you supply the cause — a delayed hire, a price change, a pulled campaign. Because you state the sign convention and the zero-budget rule, the output is one you can defend, and re-running it next period is the same short request.
A variance chart and dashboard
A table proves the numbers; a chart makes the gap obvious to a room. The most useful variance chart is the impact-by-line view above — one bar per line, favourable above the axis and unfavourable below — because it shows both the direction and the size of each swing at a glance. In Excel you build it as a bar chart off the variance column; in Anomaly the same request that produced the table can produce the chart, and you can pin it to a dashboard that refreshes when you upload the next period’s figures. On paid plans you can schedule a recurring version to go out as an email report; scheduled runs use credits.
Budget variance analysis for startups
For a startup, a monthly budget-vs-actual review is a practical option against a plan that changes fast — the goal is not a heavy FP&A process but a repeatable check on the two or three lines that actually moved the burn. Keep the budget and actuals in the same simple shape each month, watch the unbudgeted lines closely (they are where new spend hides), and treat the percentage as a flag rather than a verdict when the base numbers are small. The point is to catch surprises early, not to explain every dollar.
FAQ
What is the budget vs actual variance formula?
Variance = actual − budget. Variance percentage = variance ÷ budget, shown as a percent. The absolute variance tells you the size of the gap in currency; the percentage tells you how big it is relative to what was planned, which is what makes a small line with a huge percentage stand out. When the budget is zero, do not divide — report the percentage as N/A and keep the absolute variance.
Is a positive variance good or bad?
It depends on whether the line is revenue or a cost. For a revenue line, actual above budget (a positive variance) is favourable; for a cost line, actual above budget is unfavourable — you overspent. That is a common mistake: labelling every positive number as good. Decide the sign convention by line type first, then read the variances. A consistent "favourable / unfavourable" column, rather than raw +/−, keeps everyone honest.
How do you handle a line with no budget?
A line that had no budget but has actual spend — an unbudgeted initiative — has a real absolute variance (all of its spend) but no meaningful percentage, because dividing by zero is undefined. Report its variance in currency and show its variance % as N/A rather than 0% or infinity. Leaving it as a divide-by-zero error, or hiding it, is how unbudgeted spend goes unnoticed.
What is flexible budget variance analysis?
A flexible budget restates your budget at the activity level you actually reached before comparing. If you budgeted for 1,000 units but sold 1,200, comparing actual cost to the original fixed budget mixes up two things: spending more because you did more, and spending more per unit. Flexing the budget to 1,200 units removes the activity-volume effect, so the residual variance — which can still reflect price, efficiency, mix, or timing — is the part you then investigate.
What is the difference between budget vs actual and budget vs forecast?
Budget vs actual compares what happened against the plan you approved at the start of the period — the difference from that plan. Budget vs forecast compares your latest in-period forecast against that original budget — how your expectations have shifted since. They answer different questions, and many teams look at both: the budget for accountability against the plan, the forecast for where the year is now heading.
Explain the gap, line by line
Upload your budget and actuals, state your sign convention and zero-budget rule, and get a ranked variance table and chart — with the calculation you can inspect behind every number.