Last Updated: February 2026
A marketing analytics dashboard is a centralized visual platform that
consolidates data from multiple marketing channels, enabling teams to
monitor performance, analyze campaigns, and optimize strategies in
real-time.
Modern marketing dashboard solutions have evolved significantly.
Today's platforms leverage AI to automate data preparation, detect
anomalies, and surface insights that would traditionally require hours of
manual analysis. The shift from static reports to intelligent,
interactive dashboards represents a fundamental change in how marketing
teams operate and make decisions.
What Makes a Modern Marketing Dashboard Essential
Marketing teams generate massive amounts of data across channels—paid
advertising, social media, email campaigns, website analytics, and CRM
systems. The challenge isn't data availability; it's transforming
fragmented information into actionable intelligence.
A marketing dashboard consolidates key elements: data sources
(where information originates), metrics (quantitative measurements),
KPIs (goal-aligned indicators), and visualizations (charts and graphs).
Platforms like Tableau, Power BI, and Anomaly AI now automate
the entire workflow—from data ingestion to interactive dashboard
creation—eliminating most of the manual data wrangling that traditionally
consumed the bulk of analyst time.
Real-time visibility enables teams to identify overspending, capitalize
on viral content, and pause underperforming campaigns before budgets are
exhausted. Marketing teams that operate from real-time dashboards tend to
catch wasted spend sooner and reallocate within the current campaign cycle
rather than after it.
7 Essential Features in Marketing Dashboard Software
When evaluating marketing dashboard software, prioritize capabilities
that directly impact workflow efficiency and decision quality:
1. Multi-Source Data Integration
Your marketing dashboard should connect seamlessly with major
platforms: Google Analytics, Facebook Ads, LinkedIn, email
marketing tools, and CRM systems. Leading solutions offer 15+ native
integrations with automatic data syncing. Anomaly AI extends this further
by accepting any data source—upload CSV/Excel files or connect SQL
databases directly without platform limitations.
2. Real-Time Data Updates
Stale data leads to poor decisions. Marketing reporting dashboard
systems should refresh frequently enough for daily optimization—hourly
updates or real-time syncing for paid campaigns. This enables immediate
detection of budget overruns, performance anomalies, or emerging
opportunities.
3. Customizable Visualizations
Different stakeholders require different views. Executives need
high-level ROI summaries; campaign managers need channel-specific
performance metrics. Effective marketing dashboard software should
support multiple chart types (line graphs, bar charts, pie charts, heat
maps) with drill-down capabilities for detailed analysis.
4. Automated Data Cleaning & Preparation
Marketing data contains duplicates, inconsistent formats, missing
values, and naming convention errors. Manual cleaning consumes valuable
analyst time. Advanced platforms employ AI agents that automatically
identify quality issues, remove duplicates, standardize formats,
normalize text fields, and handle missing data—transforming dirty
datasets into analysis-ready information without human intervention.
5. Cross-Channel Attribution
Understanding which touchpoints drive conversions is critical for
budget allocation. Multi-touch attribution models let you track customer
journeys across channels. For example, you might discover that email
nurtures leads initially captured via paid search, or that social
channels support conversions closed through organic search. This prevents
overinvestment in last-click channels and ensures proper credit for
awareness-building activities.
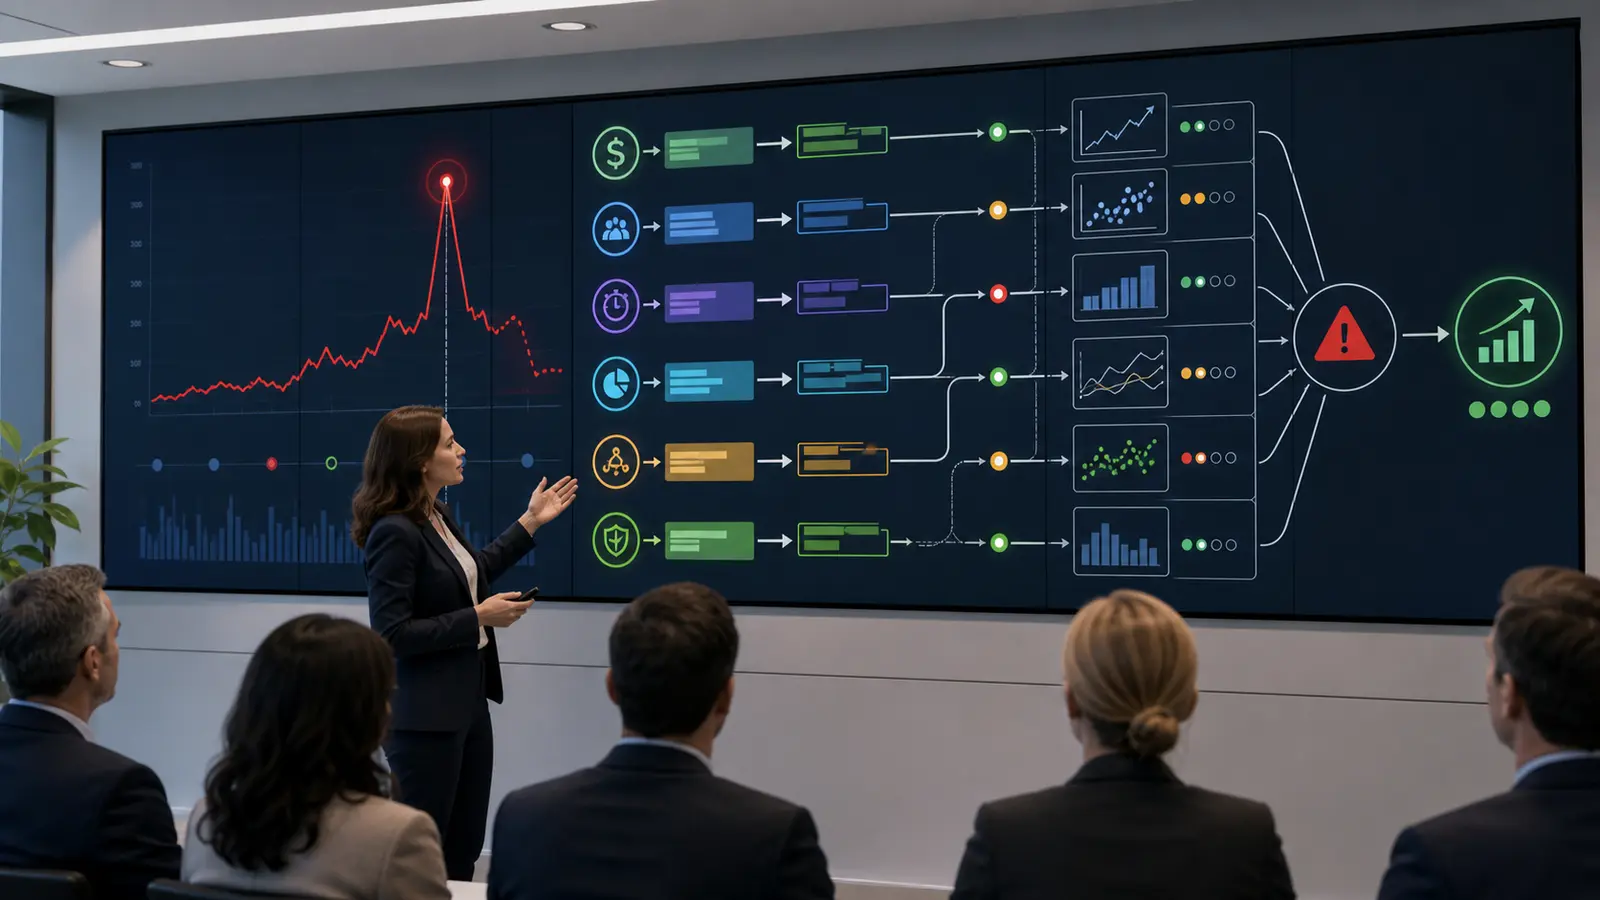
6. Automated Anomaly Detection
The most damaging data changes are those you don't notice. Automated
anomaly detection algorithms continuously monitor campaign metrics,
alerting you to sudden conversion rate drops, cost-per-lead spikes, or
unusual traffic patterns. This proactive monitoring catches problems
early—before they become costly disasters. Anomaly AI's intelligent
detection provides this safety net automatically across all
datasets.
7. Security & Compliance
Enterprise-grade platforms offer encryption, role-based access
controls, audit trails, and certifications (SOC 2, GDPR, HIPAA) to protect sensitive
marketing and customer data.
Common Marketing Dashboard Mistakes to Avoid
Even with the right tools, poor setup undermines effectiveness. Here
are the most critical mistakes:
1. Tracking Vanity Metrics Instead of Business KPIs
The biggest mistake is displaying metrics that look impressive but
don't influence decisions. Social media followers, page views, and email
list size are interesting but rarely correlate directly with revenue or
customer acquisition.
Focus on metrics answering critical business questions: "Are we
profitably acquiring customers?" or "Which channels deliver the highest
lifetime value?" Every metric should clearly connect to business
outcomes. If a stakeholder asks "so what?" and you can't explain business
impact, remove it.
Prioritize 5-10 strategic KPIs directly tied to goals rather than
displaying every available data point. Quality trumps quantity in
dashboard design.
2. Building Unused Dashboards
Many teams build dashboards enthusiastically, review them once or
twice, then abandon them to the "dashboard graveyard." This happens when
dashboards lack clear purpose or don't answer users' real questions.
Before building, define the purpose: daily campaign monitoring, weekly
executive reporting, or monthly strategic planning. Different objectives
require different metrics, refresh rates, and detail levels.
Involve end-users during design. Learn what questions marketers and
executives actually have, then build dashboards answering those questions
directly. Generic, one-size-fits-all dashboards satisfy no one. Regular
feedback sessions ensure your marketing analytics dashboard evolves with
changing business needs rather than becoming obsolete.
3. Dashboard Clutter
Too many metrics on one screen obscure insights. When dashboards
display excessive information, important patterns disappear into noise.
Research shows people can quickly process 5-7 key pieces of information;
anything beyond requires cognitive effort most busy marketers won't
invest.
Create role-specific dashboards with focused metric sets. Executives
need high-level ROI and revenue attribution. Campaign managers need
channel-specific performance. Sales teams need lead quality and
conversion metrics. Don't succumb to showing everyone everything.
Use hierarchical dashboards presenting high-level summaries with
drill-down capabilities for details. This structure enables both
forest-level and tree-level views without cluttering the main
interface.
4. Ignoring Data Quality
Dashboards exemplify "garbage in, garbage out." Dirty data—duplicates,
inconsistent formatting, missing values, outdated information—produces
inaccurate visualizations leading to poor decisions. Yet many teams rush
dashboard creation without proper data preparation.
Manual data cleaning is tedious, error-prone, and consumes hours better
spent on analysis. This is where AI-powered automation delivers
significant value. Anomaly AI's intelligent agents automatically analyze
incoming data to identify quality issues, eliminate duplicates,
standardize formats, normalize text fields, and handle missing
values—eliminating the manual wrangling bottleneck that has plagued
marketing analytics.
5. Relying on Manual Updates
Dashboards requiring manual data uploads or spreadsheet updates
inevitably fall behind. When someone is on vacation or busy, data goes
stale. By the time you finish updating everything, your "insights"
reflect last week's reality, not today's opportunities.
Modern marketing moves too fast for manual reporting. Automated data
pipelines maintain fresh data continuously without human intervention.
Seek platforms with native integrations, automatic refresh scheduling,
and real-time or near-real-time syncing.
AI-powered tools like Anomaly AI eliminate manual updates entirely.
Connect your data sources once, and dashboards remain perpetually
current. This automation shifts your team from data gathering to insight
generation—where they add real strategic value.
Why AI-Powered Marketing Dashboards Are the Future
Significant shifts are occurring in marketing analytics. Traditional
approaches required manual queries, data updates, and dashboard
maintenance. AI-powered marketing dashboard platforms eliminate these
bottlenecks, delivering faster, more accurate insights and predictive
intelligence that transforms decision-making.
The Legacy Dashboard Problem
Historically, marketing teams spent the majority of their time preparing data
rather than analyzing it. Analysts manually exported data from multiple
systems, fixed errors, merged datasets, performed calculations, and
created visualizations. This process took days or weeks before
stakeholders saw results—by which time insights were often obsolete and
opportunities lost.
This manual approach introduced formula errors, inconsistent data
definitions across reports, insights arriving too late for optimization,
and dependency on technical specialists who created bottlenecks. When the
only analyst who "knows how the dashboard works" goes on vacation,
reporting stops completely.
How AI Transforms Marketing Dashboards
AI revolutionizes dashboard creation and maintenance in five key
ways:
1. Automated Data Preparation
AI agents
autonomously inspect incoming data for quality issues and fix them
without human intervention. They eliminate duplicate records, standardize
date formats, normalize text fields with varying spellings or
capitalizations, handle missing values intelligently, and identify
statistical outliers indicating data problems.
This automation eliminates tedious data cleansing consuming analyst
hours. What previously required a full workday now takes seconds. Data in
your marketing reporting dashboard remains consistently clean and
analysis-ready.
2. Intelligent Pattern Recognition
AI engines
automatically analyze data for hidden patterns, correlations, and
relationships without human direction. They identify top-performing
marketing channels, determine which audience segments engage most, track
behavioral changes over time, and uncover correlations human analysts
might miss.
This capability transforms dashboards from passive reporting tools into
active intelligence platforms generating their own insights. AI removes
guesswork by surfacing trends worth investigating.
3. Predictive Analytics
AI-powered marketing
dashboards don't just show what happened—they predict what will happen
next. Machine learning models analyze historical trends to forecast
future performance: campaign outcomes before budget exhaustion, capacity
planning based on current pipeline velocity, customer churn risk for
retention targeting, and traffic pattern projections.
These predictions enable proactive rather than reactive marketing.
Discovering early that a campaign is underperforming allows mid-flight
adjustments. Determine if you'll meet monthly goals at current rates.
Make resource allocation decisions based on expectations rather than
historical averages.
4. Automated Anomaly Detection & Alerts
Unknown
data changes are the most harmful. AI monitors all metrics continuously,
identifying anomalies and triggering alerts for issues: conversion rates
dropping 30%, cost-per-acquisition unexpectedly increasing, budget pacing
too quickly, or traffic patterns suggesting technical problems.
This monitoring prevents problems from becoming costly disasters. When
tracking pixels break, you receive alerts within hours, not two weeks
later during monthly reviews. Anomaly AI's intelligent detection adds
this safety layer automatically, ensuring nothing goes unnoticed even
during busy periods.
5. Natural Language Querying
Advanced AI
dashboards don't require technical query language knowledge. Users ask
questions conversationally and receive instant, accurate visual
answers: "Which campaigns drove the most revenue last quarter?" or "Why
did traffic drop last Tuesday?"
This democratizes data analysis. Marketing managers no longer need data
analysts; conversational interfaces let them interact directly with data.
Questions that previously took days are answered instantly.
Marketing Dashboard Pricing: What to Expect
Understanding marketing dashboard software costs helps with budgeting
and ROI evaluation. Pricing varies significantly based on features, data
volume, user count, and sophistication level.
Entry-Level Tools: $50-$200/month
Entry-level solutions target small businesses and solo entrepreneurs
with simple reporting needs. These platforms typically include basic
visualizations, 3-5 data connectors, and templates for common use cases
with limited customization.
Examples include Google Looker Studio (free with
limitations), entry-level Databox plans.
Limitations: Expect restricted user seats
(1-3), limited historical data storage, basic or no anomaly detection,
and minimal automation. Growing businesses often outgrow these tools
within 12-18 months.
Mid-Market Solutions: $200-$1,000/month
Mid-market platforms serve growing businesses requiring broader team
access, advanced analysis, and additional marketing channels. Pricing
typically scales with data sources, users, dashboards, or data refresh
frequency.
Solutions in this tier include business tiers of HubSpot
Marketing Analytics, Tableau Creator licenses, and
specialized tools like Funnel or Supermetrics. You'll get 10-20+ data
source integrations, customizable dashboards, automated reporting,
role-based access control, and enhanced visualizations.
Value additions: Improved data transformation
capabilities, scheduled report distribution, white-labeling for agencies,
API access for custom integrations, and responsive customer support.
These solutions handle more complex tasks like multi-touch attribution,
cross-channel analysis, and cohort tracking.
Enterprise Platforms: $1,000-$10,000+/month
Enterprise solutions serve large organizations requiring unlimited
scale, advanced analytics, and extensive system connectivity. Platforms
include Domo, Looker, Salesforce Marketing Cloud, and Adobe
Analytics.
Features include unlimited data sources and volumes, advanced AI and
machine learning capabilities, custom data modeling, enterprise-level
security and compliance, and extensive API and developer resources.
Pricing flexibility depends on monthly data processing volume, employee
count, required uptime and support level, custom feature needs, and
integration complexity. Enterprise platforms justify investment through
handling billions of data points, real-time processing across global
operations, sophisticated predictions, and seamless integration with
existing business systems.
Turn Your Marketing Data into Competitive Advantage
The marketing landscape has fundamentally shifted. Success no longer
belongs exclusively to teams with the largest budgets—it belongs to
clear-sighted teams that consolidate fragmented data into unified
intelligence, anticipate opportunities before competitors, and optimize
faster than market conditions shift.
Marketing analytics dashboards have evolved from optional reporting
tools to essential infrastructure for data-driven growth. Organizations
that operate from unified dashboards make decisions faster, capture more
of their campaign reallocation windows, and save the hours their teams
would otherwise spend stitching reports together by hand. Yet only a
fraction of marketing teams leverage these capabilities effectively.
The AI-Powered Advantage
Traditional dashboard setup involved weeks of effort and ongoing
technical support: integrating data sources, cleaning datasets, creating
visualizations, and maintaining accuracy. This complexity prevented many
teams from achieving the unified view they needed.
AI-powered platforms have eliminated these barriers entirely. What
previously required days of analyst work now happens automatically in
minutes. Anomaly AI exemplifies this transformation—connect your
databases or upload marketing data, and advanced AI agents instantly
identify quality issues, fix inconsistencies, detect patterns, determine
relevant KPIs, and generate beautiful interactive dashboards—all without
requiring technical expertise.
This represents a fundamental shift in how marketing teams use data,
not just incremental improvement. When dashboard generation is automated
and takes minutes instead of weeks, insight access becomes democratized
across entire teams. Marketing managers answer critical questions without
waiting for analyst availability. Executives see real-time performance
without requesting custom reports. Campaign optimization happens in
hours, not days.
Take Action Now
Ready to transform how your team uses marketing data? Getting started
with Anomaly AI is straightforward:
Experience Your Data Transformation in Minutes: Upload
a sample dataset—campaign performance, sales data, customer insights, or
anything else—and watch AI automatically create interactive dashboards
with calculated KPIs, detected patterns, and intelligent
visualizations.
Access Enterprise-Grade Intelligence: Get real-time
insights, automated anomaly detection, and automatic quality validation
across millions of data rows.
Democratize Insights Across Your Organization: Create
beautiful, interactive dashboards that anyone on your team can access,
filter, and explore without technical expertise.
The marketing teams winning in 2026 won't be those with the biggest
budgets—they'll be the ones with the clearest vision and fastest
optimization cycles. Stop spending half your time on data preparation.
Start spending it on innovation, strategy, and growth.
Connect your marketing stack to Anomaly AI at https://www.findanomaly.ai/ and create verifiable dashboards, reports, PDFs, slides, docs, and scheduled updates without maintaining another dashboard layer.
Disclaimer: This article provides educational information about
marketing analytics dashboard platforms and best practices. Pricing and
features are subject to change. Consult official vendor websites for
current details.