Last Updated: February 2026
Every day, sales teams generate thousands of data
points, including CRM entries, email correspondence, call logs, deal updates,
and customer touchpoints. Most businesses struggle to provide basic answers
to questions like "Why did we miss our forecast?" despite having a lot of
data. Which transactions are actually at risk? What is causing our pipeline
to stall?
The issue is not that there is insufficient data. It's the inability to
transform that data into actionable knowledge fast enough to have an
impact.
Businesses that effectively use sales analytics consistently grow revenue
faster than rivals that rely on gut feel — the compounding advantage
shows up in pipeline coverage, win rate, and forecast accuracy. Yet most
sales executives still describe real-time access to their own sales data
as difficult or impossible, which is exactly the gap modern analytics
platforms are built to close.
The next generation of sales analytics software is significantly
changing this. Modern platforms like Anomaly AI are eliminating the
traditional complexity entirely—connecting directly to your databases and
instantly transforming massive datasets into interactive, shareable
dashboards without requiring data warehouses, ETL pipelines, or data
science degrees.
Everything you need to know about sales analytics tools in 2026 will be
covered in this comprehensive guide, including what they are, why they
are significant, and—above all—how to choose and employ tools that will
genuinely aid in the expansion of your company. This guide will give you
the structure and information you need if you're a business executive
looking to see sales performance more clearly, a sales leader looking to
improve forecast accuracy, or a RevOps professional looking to improve
pipeline performance.
Let's start with the fundamentals.
Understanding Sales Analytics in
2025
What is Sales Analytics?
The process of routinely collecting, processing, and evaluating sales
data in order to identify patterns, identify opportunities, and base
decisions on information that increases revenue and sales is known as
sales analytics. It transforms raw sales data from marketing platforms,
CRM systems, customer interactions, and financial records into actionable
insights that inform strategy and tactics.
At its core, sales data analysis provides answers to crucial business
questions, such as:
- How well is our sales team achieving its objectives?
- Which transactions are at risk and which have the best chance of
succeeding?
- What factors influence whether a deal is won or
lost?
- Which steps in our sales process are taking longer than
expected?
- How accurate are our revenue projections?
- Which clientele generate the highest revenue over time?
- Which marketing initiatives actually result in new business?
However, compared to three years ago, sales analytics tools in 2026 are
very different.
Artificial intelligence has fundamentally changed what's possible with
sales analytics software. Modern AI-powered platforms like Anomaly AI can process thousands of data
points in seconds, identify patterns humans would miss, and surface
actionable insights automatically.
This transformation enables sales and marketing analytics to work
together seamlessly, creating a unified view of the entire revenue
generation process. AI-driven sales pipeline analysis now happens in
real-time, allowing teams to act on opportunities and address risks
before they impact revenue.
Critical Features of Modern Sales Analytics
Tools
Not every sales analysis tool is created equal. The ability of your
sales team to compete successfully in the data-driven market of 2026 can
be determined by the difference between a basic reporting dashboard and a
truly transformative analytics platform.
As sales processes become more complex and datasets grow larger, the
gap between good and great sales analytics software becomes increasingly
apparent. These are the key characteristics that distinguish tools that
are still useful today from those that are no longer.
Comprehensive Integration
Capabilities
Your sales data is spread across multiple platforms, including your
CRM, marketing automation platform, customer success tools, financial
systems, and communication platforms. All of these disparate sources need
to be consolidated into a single view by an efficient sales analytics
tool.

Key integrations include:
- CRM Systems: Salesforce, HubSpot, Microsoft
Dynamics, and Pipedrive
- Marketing Platforms:
Marketo, Pardot, Google Ads, and LinkedIn Sales Navigator
- Communication Tools: Gmail, Outlook, Slack, and
Zoom
- Customer Success: Gainsight, ChurnZero,
and Zendesk
- Financial Systems: Stripe,
QuickBooks, and NetSuite
- Data Warehouses:
Snowflake, BigQuery, and Redshift
Why it matters: Siloed data makes it difficult to see
the big picture. You lose out on crucial information about marketing
attribution, customer health scores, and financial performance when your
sales data analysis solely examines CRM data. You can truly align your
sales and marketing analytics and see the entire customer journey—from
the initial contact to the closed deal to the opportunity for growth—with
complete integration.
AI-Powered Predictive Analytics and
Forecasting
Reporting on the past allows you to see where you have been. You can
alter your course before it's too late by using predictive analytics to
determine your direction.
The following are examples of contemporary predictive
capabilities:
Deal Scoring: To determine the most accurate
probability scores for available opportunities, AI models examine
previous deals that were won and lost. Numerous factors are considered in
predictive scoring, including deal velocity, competitive dynamics,
stakeholder involvement, engagement patterns, and past trends from
comparable opportunities.
Pipeline Forecasting: Beyond deal-level forecasts,
advanced analytics can also forecast pipeline generation. Planning ahead
and ensuring you have adequate opportunities to meet your future revenue
targets can be facilitated by this.
Churn Prediction: Subscription-based businesses can
take action to retain customers by identifying which ones are most likely
to leave. Long before cancellation notices are issued, AI models are able
to identify early warning indicators such as decreased service usage,
decreased engagement, and trends in support tickets.
Revenue Forecasting: Machine learning models can more
accurately predict future revenue by examining trends in sales capacity,
pipeline health, market conditions, seasonality, and past
performance.
Customizable and Interactive
Dashboards
Since different people need to see sales performance in different ways,
dashboards that are the same for everyone don't work. Regional managers
must be aware of the performance of their territories, the CEO must be
aware of overall revenue trends, the VP of sales must be aware of the
state of the sales pipeline analysis and the accuracy of the forecasts,
and each representative must be aware of their own metrics and next
steps.
Key dashboard features:
- Role-Based Views: Dashboards that adapt
automatically to the role and permissions of the user
- Drag-and-Drop Customization: Users ought to be able
to create and modify dashboards without requiring technical
assistance
- Drill-Down Functionality: To obtain
increasingly more specific information, users ought to be able to click
on high-level metrics
- Interactive Filters: By
filtering data by date range, territory, product line, deal stage, rep,
or any other pertinent dimension
- Different Types of
Visualization: Different data types have different ways of
telling their stories
Collaboration and Sharing Features
Analytics has the greatest impact when insights are shared widely
throughout your organization, not when they are limited to a small number
of analysts or executives.
Important collaboration features include:
- Shareable Dashboards: The ability to securely
share interactive dashboards with team members, stakeholders, or external
partners using a simple link
- Scheduled Reports:
Automated delivery of key metrics and insights via email or Slack at
regular intervals
- Commenting and Annotations:
The ability to add context, ask questions, or discuss findings directly
within dashboards
- Export Options: While live
dashboards are excellent for monitoring, there are situations when you
need to export data for presentations
- Embedded
Analytics: Dashboard widgets can be integrated into other
programs
Scalability for Large and Complex Datasets
The majority of conventional sales analytics tools begin to fall short
at scale.
Working with small datasets is simple. Almost any tool will work if
you're only using basic queries to view a few thousand CRM records.
However, the data scenarios that today's sales teams must handle are far
more complex:
- Historical Data Over Many Years: Millions of
records of past touchpoints, transactions, and interactions with
customers
- High-Frequency Data: Real-time data
from calls, emails, and websites that generates thousands of events
daily
- Multi-Source Integration: The integration
of data from over ten distinct systems
- Complex
Relationships: Complex connections between accounts, contacts,
opportunities, activities, and outcomes
The scalability imperative: By 2025, sales data will
only increase in volume and complexity. Modern platforms designed from
the ground up to handle massive datasets maintain their responsiveness
regardless of the volume of data they encounter. Whether you're viewing
ten thousand or ten million records, these platforms never slow down to
provide you with interactive dashboards and insightful information.
AI-Powered Insights and Anomaly Detection
In addition to displaying your data, the best sales analytics software
also analyzes it to uncover insights that you wouldn't discover by
looking at it yourself.
Among the automated insights are:
- Anomaly Detection: AI algorithms continuously
monitor your metrics and automatically highlight any unusual
patterns
- Identifying Correlations: Machine
learning identifies connections between variables that influence
results
- Trend Identification: AI discovers new
trends on its own
- Smart Alerts: Notifications
that gradually learn what each user finds important
- Natural Language Insights: Some sophisticated
platforms are able to simplify complex data patterns into English
summaries
Speed: What Ties Everything Together
All of these capabilities stem from a single basic need:
speed.
It is too late to create analytics that take hours or days to complete.
In fast-paced sales scenarios, effective intervention can often be
implemented in a matter of hours rather than days or weeks.
When it comes to sales analytics tools, speed means:
- The time it takes to enter data and make the dashboard available
(delayed vs. real-time)
- The speed at which dashboards and
queries load (in seconds as opposed to minutes)
- The response
time (interactive vs. request-based)
- The amount of time it takes
to take action following insight (connected vs. disconnected)
With a clear understanding of what makes great sales analytics
software, let's examine the leading tools in the market. Each category
serves different organizational needs, team sizes, and analytical
maturity levels.
The Modern Approach: All-in-One Data Analysis
Platforms
Before diving into traditional tool categories, it's important to
understand a fundamental shift in sales analytics: the emergence of
platforms that eliminate the need for complex multi-tool stacks
entirely.
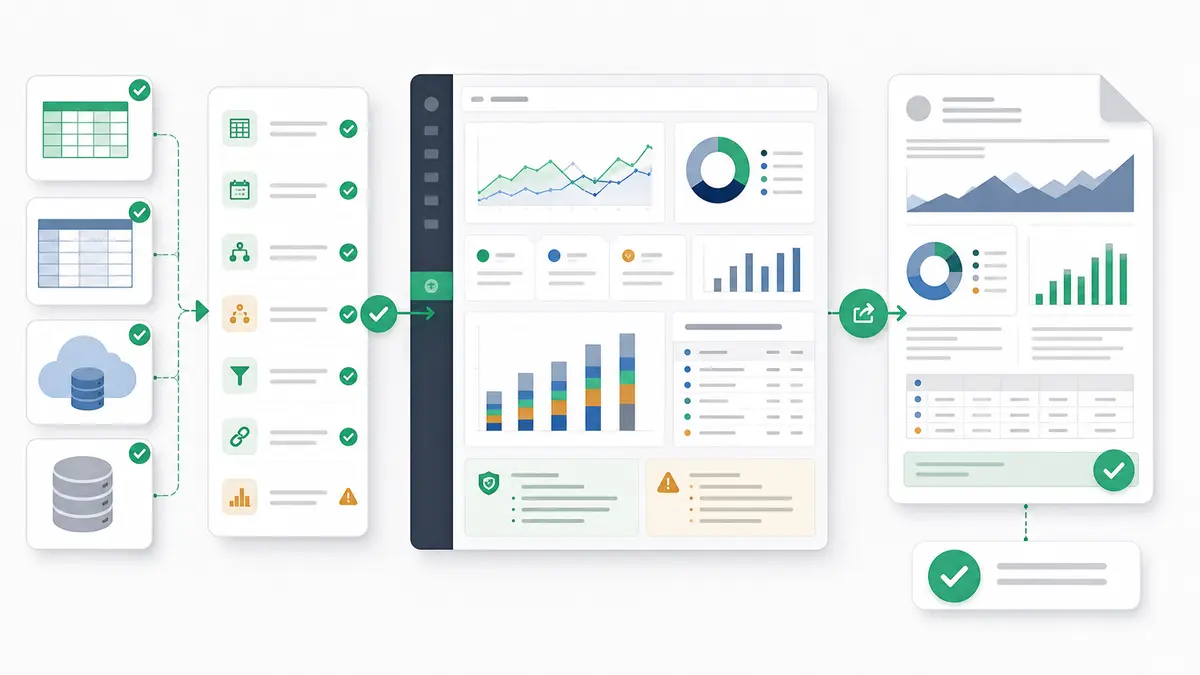
The Traditional Analytics Stack Problem:
Historically, getting insights from your sales data required assembling
multiple tools:
- Data Extraction: Pull data
from CRMs, marketing platforms, databases
- Data
Transformation: Clean, normalize, and prepare data (dbt, custom
ETL)
- Data Warehousing: Store transformed data
(Snowflake, BigQuery, Redshift)
- Business
Intelligence: Build visualizations (Tableau, Power BI,
Looker)
- Analysis: Hire analysts to interpret
and create reports
This approach has significant drawbacks:
- Weeks or
months to set up and maintain
- High
costs: Multiple tool licenses + data warehouse storage + analyst
salaries
- Technical expertise required: SQL,
data modeling, BI tool configuration
- Slow time to
insight: Even simple questions require analyst intervention
- Performance issues: Large datasets slow down
traditional BI tools
Anomaly AI represents a different
approach entirely—a complete end-to-end platform that replaces this
entire stack:
What makes it different:
- Direct
database connections: Connect to Snowflake, BigQuery, MySQL,
GA4, Google Sheets, or upload Excel files
- Zero
transformation required: No ETL setup, no dbt models, no data
engineering needed
- Instant visualization: From
connection to interactive dashboards in seconds, not weeks
- Handles massive scale: Process millions of rows
without performance degradation
- No SQL
required: Business users can analyze data directly without
technical knowledge
- AI-powered insights:
Automatically surfaces patterns, trends, and anomalies you'd miss
manually
- Shareable everywhere: Send interactive
dashboards via link—recipients need no login or license
Best for:
- Companies with large,
complex datasets (millions of records) across multiple
sources
- Organizations that lack dedicated data
teams or want to free analysts from repetitive work
- Teams needing instant insights rather than waiting
days/weeks for reports
- Businesses frustrated with BI
tool performance issues at scale
- Companies wanting to
eliminate the traditional ETL → Warehouse → BI
stack
Pricing: Custom based on data volume and users
(typically replaces $50K-200K/year in traditional tool stack costs)
Key differentiator: Anomaly AI is not a specialized
point solution—it's a complete replacement for the
transformation + visualization layer. Instead of buying Fivetran + dbt +
Snowflake + Tableau and hiring analysts to manage it all, you connect
your data sources and get instant, shareable insights.
Enterprise Business Intelligence Platforms
Tableau (Salesforce)
- Best
for: Large enterprises with dedicated BI teams and complex
visualization needs
- Strengths: Extremely
powerful visualization capabilities, handles massive datasets, extensive
customization options
- Pricing: Starts at
$70/user/month
- Learning curve: Steep; requires
training and often dedicated analysts
Microsoft Power BI
- Best
for: Microsoft-centric organizations and mid-to-large
enterprises
- Strengths: Deep integration with
Microsoft ecosystem, strong at financial reporting, cost-effective for
large deployments
- Pricing: Starts at
$10/user/month, enterprise from $20/user/month
- Learning
curve: Moderate for basic use, steep for advanced features
Looker (Google Cloud)
- Best
for: Data-driven organizations with strong technical teams
- Strengths: Modeling layer (LookML) enables
consistent definitions across the organization
- Pricing: Custom enterprise pricing
(typically $3,000+/month minimum)
- Learning
curve: Very steep; requires SQL knowledge and LookML
expertise
Sales-Native Analytics Platforms
Salesforce Analytics Cloud (Tableau CRM)
- Best for: Salesforce-heavy organizations
- Strengths: Native Salesforce integration, pre-built
sales dashboards, Einstein AI predictions
- Pricing: Starts at $75/user/month (CRM Analytics),
$150+ for Einstein features
HubSpot Analytics & Reporting
- Best for: Small to mid-sized businesses using
HubSpot
- Strengths: Easy to use, tight
integration with HubSpot CRM and marketing tools
- Pricing: Included in Professional ($800/month) and
Enterprise plans
Clari
- Best for: Revenue
operations teams focused on forecasting accuracy
- Strengths: AI-driven forecast predictions, deal
inspection, pipeline management
- Pricing: Custom
enterprise pricing (typically $60-100/user/month)
Gong Revenue Intelligence
- Best
for: Sales teams that want conversation analytics combined with
deal insights
- Strengths: Captures and analyzes
sales calls, emails, meetings; provides coaching insights
- Pricing: Custom pricing
(typically $1,200+/user/year)
Why Anomaly AI is Different: The
Complete Data Analysis Platform
Unlike the tools listed above—which are point solutions that fit within
a traditional data stack—Anomaly AI
is a complete platform that replaces the entire transformation
and visualization layer.
While other tools require you to:
- Extract data
(Fivetran, Airbyte)
- Transform it (dbt, custom ETL)
- Store it (Snowflake, BigQuery—with ongoing storage costs)
- Visualize it (Tableau, Power BI—with performance limitations)
- Hire analysts to manage it all
Anomaly AI eliminates steps 2-5 entirely. Let's
examine how this works and the real-world impact.
The Large Dataset Challenge
Data is more difficult for sales teams to handle now than it was in the
past. Consider a typical middle-market B2B company:
- Combining information from various sources, including CRM,
HubSpot, financial systems, marketing automation, communication tools,
and customer success platforms
- Frequent updates: Every day,
thousands of new data points are generated
- Difficult
relationships: There are connections between contacts, accounts,
opportunities, campaigns, activities, and outcomes
Ordinary sales analytics software is ineffective under such pressure.
Questions that require immediate answers are either ignored or answered
slowly. Dashboard construction requires some technical expertise and
takes a few days to complete.
Anomaly AI was created for this
reason.
Anomaly AI's Core Capabilities
Instantly Transforming Large Datasets
Speed is the first significant change. Writing queries, creating
visualizations, and processing big datasets can take hours or even days
when using traditional sales analytics tools. On the other hand, Anomaly
AI can use enormous volumes of sales data to generate interactive
dashboards in a matter of seconds.
This not only improves things but also transforms them entirely. It
implies that salespeople can ask questions and receive prompt responses.
When a VP asks, "Which business deals have been in talks for more than 90
days?" they immediately receive a picture of those deals and additional
information.
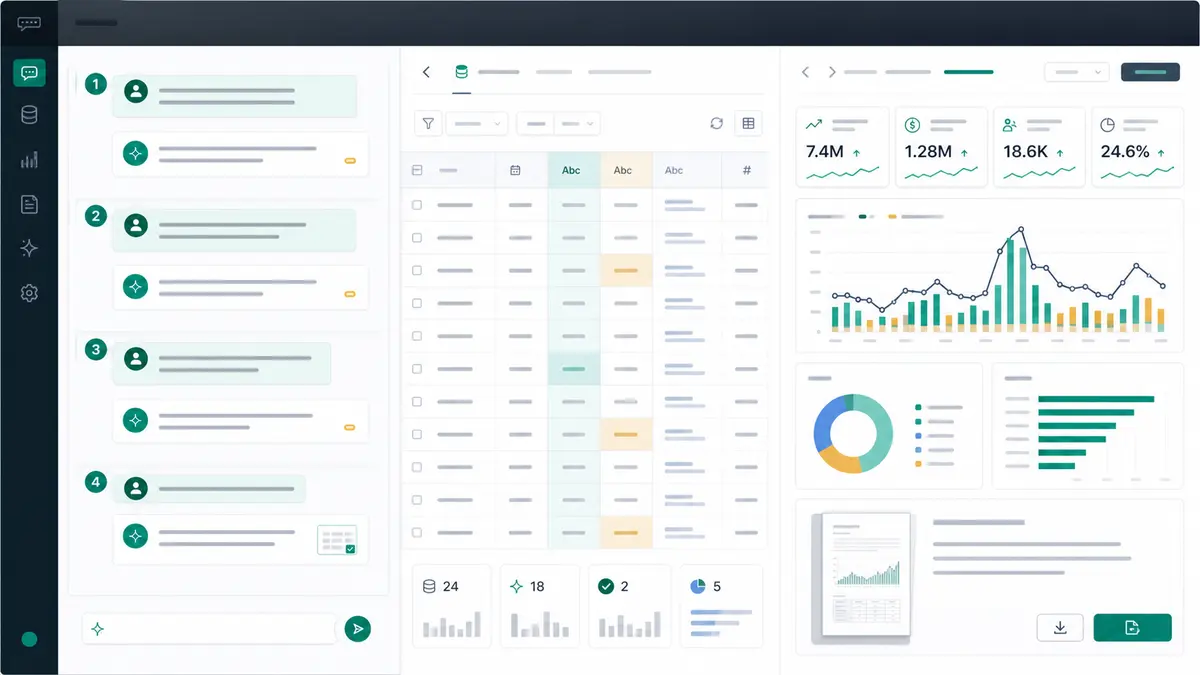
Interactive, Shareable Dashboards
Anomaly AI creates interactive
dashboards that enable users to naturally explore data. To learn more
about any metric, click on it. Filtering by region, product, time period,
or deal type is simple. Change the types of visualizations to see
patterns from different angles.
Its ease of sharing, however, is its real strength. Dashboards can be
used without specialized software that requires licenses and training.
Executives and salespeople can view the same data in real time because
secure links make it simple for teams to share them.
Actionable Insights Without Manual Analysis
Anomaly AI's ability to find insights on
its own without your assistance is one of its best features. The
platform's AI engine continuously examines your sales data to
identify:
- Anomalies: Unusual and non-standard patterns,
such as abrupt declines in conversion rates
- Trends: New patterns in customer behavior, pipeline
health, or performance
- Correlations: The
connections between variables that produce outcomes
With so many sales analytics tools available, selecting the right one
can feel overwhelming. The key is matching your specific needs,
constraints, and maturity level to the tool's strengths. Here's a
practical framework for making the decision.
First, answer this critical question: Are you
analyzing large volumes of data from multiple sources?
If YES (thousands of records, 3+ data sources):
→
Consider Anomaly AI first — It replaces
your entire ETL + data warehouse + BI stack with a single platform.
You'll save months of setup time, eliminate ongoing data engineering
costs, and get instant insights from massive datasets.
If NO (single CRM, simple reporting needs):
→
Start with CRM-native tools (HubSpot, Pipedrive,
Salesforce Reports) — They're included in your subscription and handle
simple use cases well.
By Organization Size and Budget
Small Teams (1-20 reps) | Budget: $0-$5,000/month
- Best options: HubSpot Analytics (if using
HubSpot CRM), Pipedrive Insights, Power BI
- Why:
These tools offer excellent out-of-the-box functionality without
requiring dedicated analytics resources
Mid-Market (20-200 reps) | Budget:
$5,000-$25,000/month
- Best options:
Salesforce Analytics Cloud (if Salesforce user), Anomaly AI,
InsightSquared, Clari
- Why: You need more
sophisticated analytics than basic CRM reporting but may not have a full
BI team
Enterprise (200+ reps) | Budget: $25,000+/month
- Best options: Tableau, Looker, Sisense, Anomaly
AI (for specific use cases)
- Why: You likely
need cross-functional analytics beyond just sales
Key Questions to Ask During Evaluation
- Can we see value in the first 30 days? Tools
requiring 6-month implementations may not be worth it for mid-market
companies.
- Will it scale with us? Consider
where you'll be in 2-3 years, not just today.
- What's the
total cost of ownership? Include software, implementation,
training, and ongoing analyst time.
- How quickly can
business users get answers? If every question requires an
analyst ticket, adoption will suffer.
- Does it integrate
with our existing stack? Pre-built connectors save weeks of
custom integration work.
- What happens when we hit
scale? Ask vendors specifically about performance with millions
of records.
- Can we try it with our real data?
Proof-of-concept with actual data reveals issues demos won't show.
Final Thoughts
In 2026, the competitive landscape doesn't allow sales teams to rely on
gut feelings, delayed insights, or incomplete data visibility. The one
thing that sets companies that always meet their revenue goals apart from
those that always struggle is their ability to quickly turn huge amounts
of sales data into useful information.
The good news? You now have more sales analytics tools available than
ever before, each designed for specific use cases, team sizes, and
technical capabilities. Whether you're a small team needing simple CRM
analytics, a mid-market company seeking AI-powered insights, or an
enterprise requiring sophisticated business intelligence, there's a
solution that fits.
The key is choosing the right tool for your specific situation
rather than chasing the most feature-rich or popular option.
What Success Looks Like
In this guide, we've explored the landscape of modern sales analytics
tools and what distinguishes the best from the rest:
- The Platform vs. Point Solutions Decision: The
most critical choice isn't which tool—it's whether you need a
complete platform or specialized point solutions
- Speed
matters: Analytics change decisions only when insights arrive
fast enough to act on them
- Scale without
compromise: Traditional BI tools struggle with large
datasets
- Accessibility drives adoption: The
most powerful tool is useless if your team doesn't use it
- Total cost of ownership: Don't just compare software
licenses
Taking Action
If your company faces any of these challenges, here's how to
choose:
For companies with large, complex datasets (3+ sources,
millions of records):
Start with Anomaly AI —
Before you build a traditional stack (ETL + warehouse + BI tool +
analysts), see if a complete platform can replace it all. You'll
get:
- ✅ Instant setup: Days, not months
- ✅
No transformation layer: Connect databases directly
- ✅ No SQL required: Business users analyze data
independently
- ✅ Actual performance: Handles
millions of rows without lag
- ✅ Cost savings:
Replaces 4-5 tools + analyst time
This is especially critical if:
- Your
current BI tools crash or slow down with your data volume
- You're
waiting days/weeks for analysts to build reports
- Your team isn't
technical but needs to explore data
- You're frustrated with the
complexity of maintaining a data stack
→ Try Anomaly AI with your real data
to see the difference
For small teams with simple needs:
Start with
your CRM's native analytics (HubSpot, Pipedrive, Salesforce Reports).
They're included and handle basic use cases well.
For specialized needs:
- Need
forecasting accuracy? → Clari
- Want conversation
intelligence? → Gong
- Microsoft-centric
org? → Power BI
- Have a strong BI team
already? → Stick with Tableau/Looker if they're working
The Future of Sales Analytics
The data challenge will only intensify. Sales motions are becoming more
complex, customer journeys span more touchpoints, datasets grow
exponentially, and competition intensifies. Companies that master
analytics now build compounding advantages. Those who struggle with
inadequate tools fall further behind.
The question isn't whether to invest in modern sales analytics
software — it's which tools match your specific needs and
constraints.
Try Anomaly AI for sales analytics on large datasets — connect your CRM exports, warehouse pipelines, and spreadsheets, ask questions in plain English, and review the SQL behind every revenue breakdown.