
Business Intelligence
9 min
Budget vs Actual Variance Analysis in Excel: How to Explain the Gap
The formulas, the favourable/unfavourable sign convention, zero-budget handling, and drilling into the lines driving the gap.
Read More
Business Intelligence — How-to guide · 2026
Turn receipt and issue records into an inventory aging report — surviving stock aged as of a date into 0-30, 31-60, 61-90, and 91+ day buckets under a stated FIFO assumption, reconciled to units on hand.

10 min read
Quick answer — how to build an inventory aging report
An inventory aging report groups the stock you still hold by how long it has sat, into buckets like 0-30, 31-60, 61-90, and 91+ days. Build it from your receipt and issue records: work out on-hand per item (receipts minus issues, using only movements on or before your as-of date), then assign each surviving unit an age. Because a receipt/issue export rarely records which physical units left, you apply an allocation assumption. This guide uses FIFO, where issues consume the oldest receipts first, and ages each surviving lot from its receipt date to the as-of date. The report flags the units in the oldest buckets for review; to call that stock cash exposure, slow-moving, or a write-down candidate you need cost, demand, and net-realizable-value data the movement records alone don't carry.
If you run physical goods, an aging report shows how long each item has been on the shelf, so you can decide what to review — mark down, return to vendor, re-slot, or stop reordering. This guide builds it from your receipt and issue records and ages the surviving stock under a stated FIFO assumption, as of a date you pick. (The same idea applied to money owed to you rather than stock on the shelf is an accounts receivable aging report — a separate report with the same shape.)
The hard part isn't the buckets; it's deciding which surviving units to age, and how. Under FIFO, a unit's age isn't the date of the last receipt — it's the receipt date of the lot the allocation leaves on hand after issues draw down the oldest lots first. Get the allocation and the cutoff right and the totals reconcile to your stock on hand; get them wrong and the report ages the wrong units. That reconstruction only works when you have the complete receipt and issue history through your cutoff — each movement with its own transaction date and quantity, and each receipt or opening layer with its original receipt or acquisition date — so the FIFO drawdown starts from the right lots. Where the history doesn't reach far enough back, you need opening inventory layers instead: the opening quantity on hand carried as lots, each with its original receipt or acquisition date. If a lot's opening age genuinely isn't available, age that stock as unknown rather than guessing a date. Where you have them, actual lot or serial records — or your organization's approved costing method — override the reconstruction.
An inventory aging report takes the stock you currently hold and distributes it across age buckets, so instead of one "units on hand" number you can see how much of that stock is fresh and how much has been sitting. A typical layout lists each item (or SKU) with the quantity on hand in each bucket — 0-30, 31-60, 61-90, 91+ days — and a total that ties back to on-hand. The quantity view flags which stock to review, and the older buckets are the first place to look. To turn that into a financial read — cash tied up, slow-moving, obsolete, or a write-down candidate — you add the columns that support it: unit cost or carrying value for cash exposure, demand or turn history to call stock slow-moving, and a net-realizable-value check before any write-down. IAS 2 measures inventory at the lower of cost and net realizable value; age alone doesn't establish it.
Two conventions decide what the report says. The as-of date is the day you're aging to — usually a period end — measured only over movements on or before it. The aging method is the allocation assumption that decides which units are treated as still on hand and how old they are. FIFO (first-in, first-out) assumes the oldest stock was used first; this guide uses FIFO. It is a costing/allocation convention, not proof of physical movement — under IAS 2, cost is assigned by specific identification for items that are not ordinarily interchangeable, and by FIFO or weighted average for ordinarily interchangeable items — so state the assumption you use. Where you have actual physical lot or serial records, use them to override the reconstruction with each unit's real operational age; and follow your organization's approved costing method where one applies.
For a small, simple case Excel is fine — but only after you've reduced each item to its remaining open receipt quantity as of your date, not the original receipt quantity. Keep only movements dated on or before the as-of date, draw issues down against the oldest receipts first so each receipt row carries the quantity still on hand, then age those remaining quantities:
=as_of_date - [receipt date].=IF(age<=30,"0-30",IF(age<=60,"31-60",IF(age<=90,"61-90","91+"))). Day 90 falls in 61-90, so anything over 90 days is 91+.Where the template strains is the realistic case: multiple receipts per item and issues that have drawn stock down over time. Now a unit's age depends on which lot the allocation leaves on hand — under FIFO the oldest receipts are consumed first, so an item can have surviving stock split across two or three ages at once. Doing that in Excel means building per-lot helper columns that consume issues against receipts in date order, exclude post-cutoff movements, and re-check that the buckets still sum to on-hand every time the data changes. It's doable, and it's exactly the fiddly, error-prone part the sample below skips.
Try it on the sample records
Download this sample receipt-and-issue export (6 movement rows across three SKUs — one with a partial-lot issue that splits its surviving stock across two ages, and one fully issued down to zero) and build the aging report as of 2026-03-31. The screenshots below are a real capture of Anomaly building that report from the file — the request, the FIFO result, the Excel workbook it generates, a one-line refinement, and the download.
When items have multiple receipts and a history of issues, one workable path is to let the FIFO allocation run for you. In Anomaly you import the receipt-and-issue export as a table and ask for the report in plain language, naming the cutoff, the method, and how to handle exceptions:
"These are inventory receipts and issues. Use only movements dated on or before 2026-03-31. On-hand per SKU = receipts − issues through that date; exclude SKUs at zero, and flag any issue with no matching receipt. Age the surviving stock as of 2026-03-31 under a FIFO assumption — issues consume the oldest receipts first — and bucket the remaining open quantity into 0-30, 31-60, 61-90, and 91+ days (day 90 in 61-90). Confirm the buckets reconcile to on-hand."
It runs the FIFO allocation — matching each issue against the oldest open receipts, so a partially issued lot keeps only its surviving quantity at that lot's receipt-date age — ages each surviving lot to the as-of date, and returns the aged grid by SKU and bucket, with a reconciliation check that the buckets sum to on-hand (receipts minus issues, through the cutoff) for every SKU and in total.
The same job in Anomaly: from the receipt-and-issue file to a downloadable Excel workbook
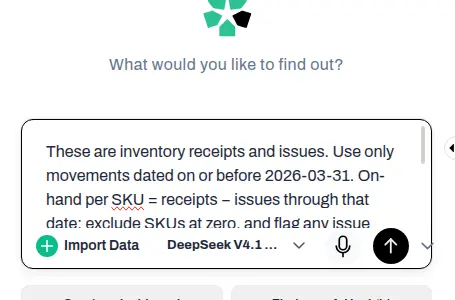
1. Ask. The receipt-and-issue file is uploaded as a table, then the report is requested in plain language — the as-of cutoff, the FIFO assumption, the buckets, and the reconciliation check.
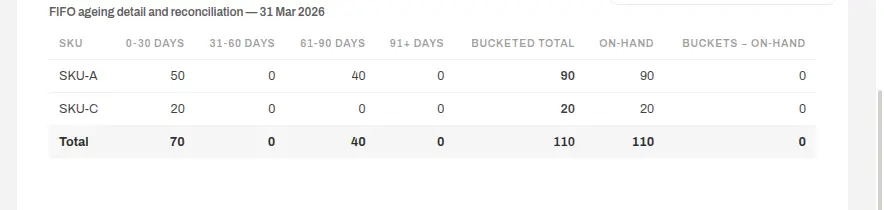
2. The result. The aged grid by SKU and bucket, reconciled: 70 / 0 / 40 / 0 across the 0-30, 31-60, 61-90 and 91+ day buckets sums to 110 units on hand (200 received − 90 issued), and each SKU's buckets match its on-hand exactly.
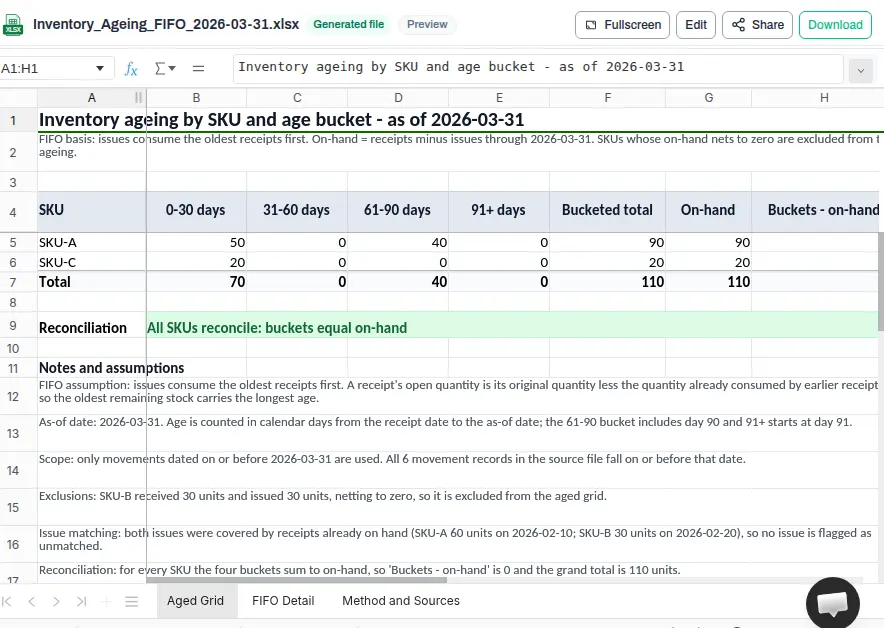
3. An Excel workbook. The result is written to an .xlsx with three sheets — the Aged Grid, a FIFO Detail sheet of open quantity per receipt, and a Method and Sources sheet — with the totals, reconciliation and bucket labels as live formulas rather than pasted values.
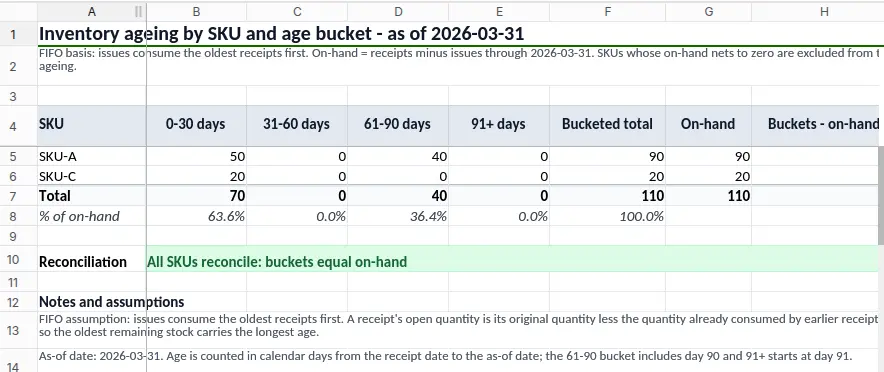
4. One refinement. Asking for a "% of on-hand" row adds it beneath the totals — 63.6% in 0-30 days, 36.4% in 61-90 — as live formulas dividing each bucket by the 110 units on hand. The quantities and the reconciliation stay exactly as they were.
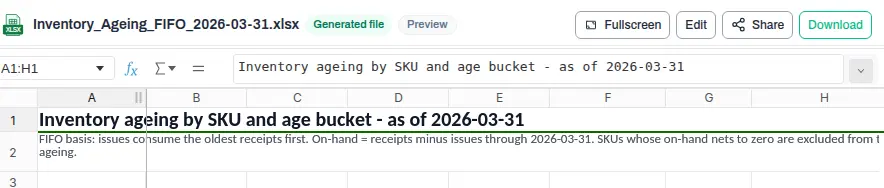
5. Download. The finished workbook downloads as a standard .xlsx you can open in Excel, Google Sheets, or any spreadsheet tool.
Two things to pin down before you trust any inventory aging number are in that report: the allocation assumption (here FIFO) and the as-of date, with movements limited to that date. State both, keep the underlying rows inspectable, and check the reconciliation — buckets summing to on-hand is the guard that the allocation didn't lose or double-count a unit.
NetSuite's current standard report list doesn't include one named Inventory Aging. It does offer inventory Valuation and Activity reports and an Inventory Turnover report — which includes average days on hand — and reports and search results can be exported. Check whether those views answer your question. If you specifically need lot-level age as of a date, custom buckets, a chosen aging assumption, or a reconciled total those reports don't provide, export the item receipt and issue movements to CSV and build the report from those records, the same way as the sample above — aging is a calculation over movement history, and a tool built for that calculation can run it from the exported records. There is no native Anomaly connector to NetSuite; you work from the exported file.
Two aging reports over the same data can disagree because they made different choices. Worth deciding on purpose:
An inventory aging report groups the stock you currently hold by how long it has been sitting, into age buckets such as 0-30, 31-60, 61-90, and 91+ days, with the quantity on hand in each bucket. It flags which stock to review — the units in the older buckets — so you can look at them first. Calling that stock slow-moving, obsolete, or a write-down candidate needs more than age: cost or carrying value for cash exposure, demand or turn history for slow-moving, and a net-realizable-value check before a write-down. The bucket totals should reconcile to your total units on hand.
Put each receipt on a row with an item, a receipt date, and a quantity, keep only movements on or before your as-of date, and reduce each receipt to its remaining open quantity by consuming issues against the oldest receipts first (FIFO). Add an age column (as-of date minus receipt date) and bucket it with a nested IF such as =IF(age<=30,"0-30",IF(age<=60,"31-60",IF(age<=90,"61-90","91+"))), where day 90 falls in 61-90. Then total the remaining open quantity by item and bucket with a PivotTable or SUMIFS. That works when each item has one open receipt; with multiple receipts and issues the FIFO drawdown needs per-lot helper columns in Excel, or you can let Anomaly run the FIFO allocation and reconcile the buckets to on-hand for you.
NetSuite's current standard report list doesn't include one named Inventory Aging. It does provide inventory valuation and activity reports and an Inventory Turnover report that includes average days on hand, and reports and search results can be exported. Check whether those answer your question; if you need lot-level age as of a date, custom buckets, a chosen aging assumption, or a reconciled total they don't provide, export the item receipt and issue transactions to CSV and build the report from those records. There is no native Anomaly connector to NetSuite; you work from the exported file.
An inventory aging report is only as trustworthy as the allocation behind each unit and the cutoff you age to. Under a FIFO assumption, fix the as-of date, keep only movements on or before it, run issues against the oldest receipts first, bucket the remaining open quantity, and check that the buckets reconcile to on-hand. Excel can do it for a handful of single-receipt items; once items have multiple receipts and a history of issues, building it straight from the receipt-and-issue records — a stated assumption, as of your date, reconciled — is the version you can act on, with actual lot/serial records or your approved method overriding it where you have them.
Technical Product Manager, Data & Engineering
Ash Rai is a Technical Product Manager with 5+ years of experience building AI and data engineering products, cloud and B2B SaaS products at early- and growth-stage startups. She studied Computer Science at IIT Delhi and Computer Science at the Max Planck Institute for Informatics, and has led data, platform and AI initiatives across fintech and developer tooling.
LinkedInContinue exploring AI data analysis with these related insights and guides.
The formulas, the favourable/unfavourable sign convention, zero-budget handling, and drilling into the lines driving the gap.

Automated reporting tools don't all automate the same thing. Here's how a small team picks between a refresh tool, a BI dashboard, and an AI analyst in 2026.

A fair buyer-fit guide to free Power BI alternatives for messy spreadsheets, with current pricing, source-backed caveats, and Anomaly AI positioning.