Every week, a client sheet changes just enough to make a scheduled report risky. The tab name is different. A column is renamed. The export period is stale. Someone edits a formula by hand. The PDF still goes out on Friday, but now the neat client-ready report carries numbers nobody reviewed.
Automation is not "send whatever the sheet says." For weekly client reporting, the job is to automate the repeatable mechanics while keeping the business judgment visible: source hygiene, field mapping, metric definitions, review notes, PDF generation, scheduled email delivery, and a final human check before the report leaves your team.
Quick answer — automate weekly client reporting with Google Sheets and scheduled PDFs
To automate weekly client reporting with Google Sheets and scheduled PDFs, prepare or connect the source sheet, map fields to agreed metric definitions, build a reusable dashboard or report template, render the client-ready PDF, schedule email delivery, and review source changes, caveats, recipients, and narrative claims before each weekly send.
That distinction matters. A scheduled PDF is useful only when the source is stable enough, the logic is inspectable, and the report tells the client what is safe to believe. If your current workflow is copy-paste, screenshot, export, attach, and hope, the first automation target is not a fancier PDF. It is a safer weekly reporting workflow.
What Weekly Client Reporting Should Automate
Weekly client reporting has two kinds of work: repeatable mechanics and judgment-heavy review. Automate the first. Protect the second.
Good candidates for automation include:
- Source intake: pulling from a prepared Google Sheet, selected tab, or supported source workflow.
- Field mapping: translating client-specific headers into your reporting fields.
- Metric calculation: applying agreed definitions for revenue, leads, customers, pipeline, retention, spend, or any other recurring KPI.
- Template refresh: updating the same dashboard or report layout each week.
- PDF render/export: producing the weekly report in the same presentation format.
- Email delivery: sending the PDF to the right recipients on a daily, weekly, or monthly cadence.
- Basic validation checks: flagging missing IDs, duplicate rows, stale date windows, and renamed fields before the PDF leaves.
What should not disappear into automation is judgment. A client can change a goal, a data source, a campaign naming convention, or a definition without warning. The report might still render perfectly while the meaning of the numbers has changed.
Use automation to remove the repeated work. Use review notes to keep the report defensible.
For consultants already turning messy files into client outputs, this article pairs naturally with the broader workflow in repeatable client dashboards from messy CSVs. Google Sheets reduces some file-handling friction, but it does not remove the need for source checks, definitions, and caveats.
The Google Sheets-to-PDF Reporting Workflow
Google's own Apps Script documentation shows the basic pattern. The Generate and send PDFs from Google Sheets sample uses a sheet as source/template data, exports a sheet to PDF, stores the file in Drive, and sends the PDF by email.
That makes Google Sheets a workable starting point for weekly client reporting, especially when the source data is already maintained in Sheets. A typical technical workflow looks like this:
- Prepare the source sheet. Keep raw data, mapping logic, and presentation tabs separated where possible. Do not let client-facing tabs become the only source of truth.
- Map fields and definitions. Decide which sheet tab, columns, date fields, and metric definitions feed the report.
- Generate the report view. Build the sheet, dashboard, or report template that will become the PDF.
- Export or render the PDF. Google Drive's export documentation lists PDF as a supported export format for Google Workspace spreadsheets, while the Drive API files.export method exports Workspace documents to a requested MIME type and returns bytes. The Drive API docs also note a 10 MB export-content limit, so heavy reports need design discipline.
- Email the attachment. Apps Script's MailApp can send email with options such as attachments, CC, BCC, HTML body, sender name, no-reply, and reply-to.
- Schedule the send. Installable Apps Script triggers can run functions automatically. Time-driven triggers are similar to cron jobs and can execute at a particular time or on recurring intervals. The ClockTriggerBuilder reference includes scheduling methods such as
everyDays, everyHours, everyMinutes, everyWeeks, and onWeekDay, plus timezone handling.
None of that means the report is safe by default. Apps Script can run the workflow. It cannot know whether the client quietly renamed Net Revenue to Revenue, whether last week's export tab was updated, or whether the recipient list should change after a client reorg.
So the workflow needs a review layer. The scheduled job should be the end of the process, not the only process.
Weekly Reporting Workflow Matrix
Use this matrix as the operating checklist for weekly client reporting. It keeps the automation focused on repeatable work and the review focused on the failure modes that damage client trust.
| Stage |
Automate this |
Review this |
Failure mode |
Client-safe wording |
| Source sheet readiness |
Pull from the agreed sheet, tab, or prepared source workflow. |
Confirm the refreshed tab is the right one and the sheet covers the intended week. |
The PDF uses an old tab, partial export, or manually edited view. |
"This week's report uses the refreshed tab named Weekly Export; the old Export tab was not updated." |
| Field mapping |
Map client-specific headers to canonical reporting fields. |
Check renamed columns, one-off fields, and missing required columns. |
client_id becomes customer, or Net Revenue becomes Revenue, and totals drift. |
"The total is comparable to last week after mapping renamed columns; the renamed field is listed in the review notes." |
| Metric definitions |
Apply the agreed KPI formulas and business rules. |
Confirm definitions have not changed since the last report. |
Gross revenue is sent when the client expects net revenue, or "customer" means a different denominator. |
"Revenue is calculated using the agreed net-revenue definition; rows without customer IDs are excluded from customer-level counts." |
| Freshness/date window |
Apply weekly date filters and report-period labels. |
Confirm the export timestamp, timezone, and reporting window. |
The report mixes a full prior week with a partial current week. |
"The reporting window is Monday through Sunday in the agreed timezone; late rows are listed as a caveat." |
| Duplicate/missing record checks |
Flag duplicate IDs, blank IDs, missing dates, and required-field gaps. |
Decide whether flagged rows should be excluded, corrected, or called out. |
Duplicate transactions inflate totals, or missing IDs break customer-level metrics. |
"Rows with missing customer IDs are excluded from customer-level counts and listed in the review notes." |
| Report/dashboard template |
Refresh the same layout, sections, and recurring visuals. |
Confirm manual edits, chart labels, and narrative sections still match the client question. |
A polished template hides a stale chart, old note, or irrelevant KPI. |
"This weekly report uses the same layout and metric definitions as last week so trend comparisons stay consistent." |
| PDF render/export |
Render the weekly client PDF from the approved report view. |
Check clipping, page breaks, missing charts, and file size. |
The PDF sends with cut-off tables, broken charts, or unreadable sections. |
"The PDF was rendered from the approved weekly report view after layout review." |
| Scheduled email delivery |
Send the PDF to configured recipients on the weekly cadence. |
Verify recipients, subject line, summary body, and any client-specific notes. |
The report goes to the wrong list or uses a stale summary. |
"The scheduled PDF includes the weekly summary and current recipient list." |
| Weekly maintenance |
Log source changes, definition updates, exceptions, and recurring caveats. |
Decide which caveats become permanent rules for future reports. |
The same issue is rediscovered every Friday because it was never documented. |
"The PDF is scheduled for delivery, but source-data assumptions are reviewed when the client changes the sheet structure." |
The point is not to slow reporting down. It is to stop the worst version of automation: fast, polished, and quietly wrong.
The Google Sheets Checks That Stop Bad PDFs
Before a weekly PDF goes out, check the source the way a client will interrogate the output. If the number matters, the sheet structure matters.
The GOV.UK data quality dimensions guidance is useful here because it frames data quality as fit-for-purpose, not abstract cleanliness. Accuracy and completeness are obvious, but the practical question is sharper: is this data good enough for the report you are about to send?
For weekly Google Sheets reporting, focus on:
- Changed tabs: The report expects
Weekly Export, but the client adds Weekly Export - New and stops updating the old tab.
- Renamed columns: A field rename breaks mappings or causes fallback logic to use the wrong column.
- Stale rows: The sheet looks full, but the latest timestamp is from the prior week.
- Manual edits: A stakeholder overwrites a formula or inserts a note row inside the data range.
- Missing IDs: Customer, campaign, invoice, order, or project IDs are blank, so entity-level counts cannot be trusted.
- Duplicate records: Refreshed rows are appended without removing the previous export.
- Metric-definition drift: The client changes what "active," "qualified," "retained," or "revenue" means without updating the report rule.
- Date and timezone drift: The sheet uses local dates while the report compares against a different cutoff.
The GOV.UK data quality issues framework recommends defining rules, targets, and the purpose and impact of the data. That is exactly what weekly client reporting needs. Instead of vague "looks good" checks, create rules like:
- The reporting tab must exist and contain rows for the agreed week.
- Required IDs cannot be blank for customer-level totals.
- Required metric columns must be present before the report renders.
- Duplicate keys are flagged before the PDF is generated.
- Date windows and labels must match the client reporting cadence.
- Any renamed field must be mapped or called out in review notes.
If a rule fails, the right answer is not always "do not send." Sometimes the right answer is a clear caveat. For example: "This report is suitable for weekly review; it should not be treated as audited financial reporting." That sentence protects both sides. It tells the client what the PDF is for and what it is not for.
For source-specific setup, start with Google Sheets data analysis and make the weekly report workflow a layer on top of the connected or prepared sheet.
What Still Needs Human Review Before the PDF Goes Out
The scheduled PDF can be automatic. The client promise should not be.
Before the weekly report leaves, a person should review:
- The executive summary: Does the narrative match the data, or did it overstate the movement?
- The top-line totals: Do they reconcile with the expected reporting period and metric definition?
- The caveats: Are missing IDs, renamed columns, stale rows, or manual edits explained in plain language?
- The comparison window: Is this week being compared to a full, equivalent prior period?
- The recipient list: Is the report going to the right client stakeholders?
- The attachment: Did the PDF render correctly, without clipped tables or missing charts?
- The client context: Did anything happen this week that changes how the numbers should be framed?
This is where many automated reporting systems fail. They turn delivery into a machine step, then accidentally treat interpretation as a machine step too. Weekly client reporting should be faster, but still accountable.
If you need to move from a weekly PDF into a broader client-ready narrative, the same review habit applies to QBR PowerPoint slides from source-backed data. The deliverable changes. The rule does not: evidence first, output second.
How Anomaly Helps With Scheduled Client Reports
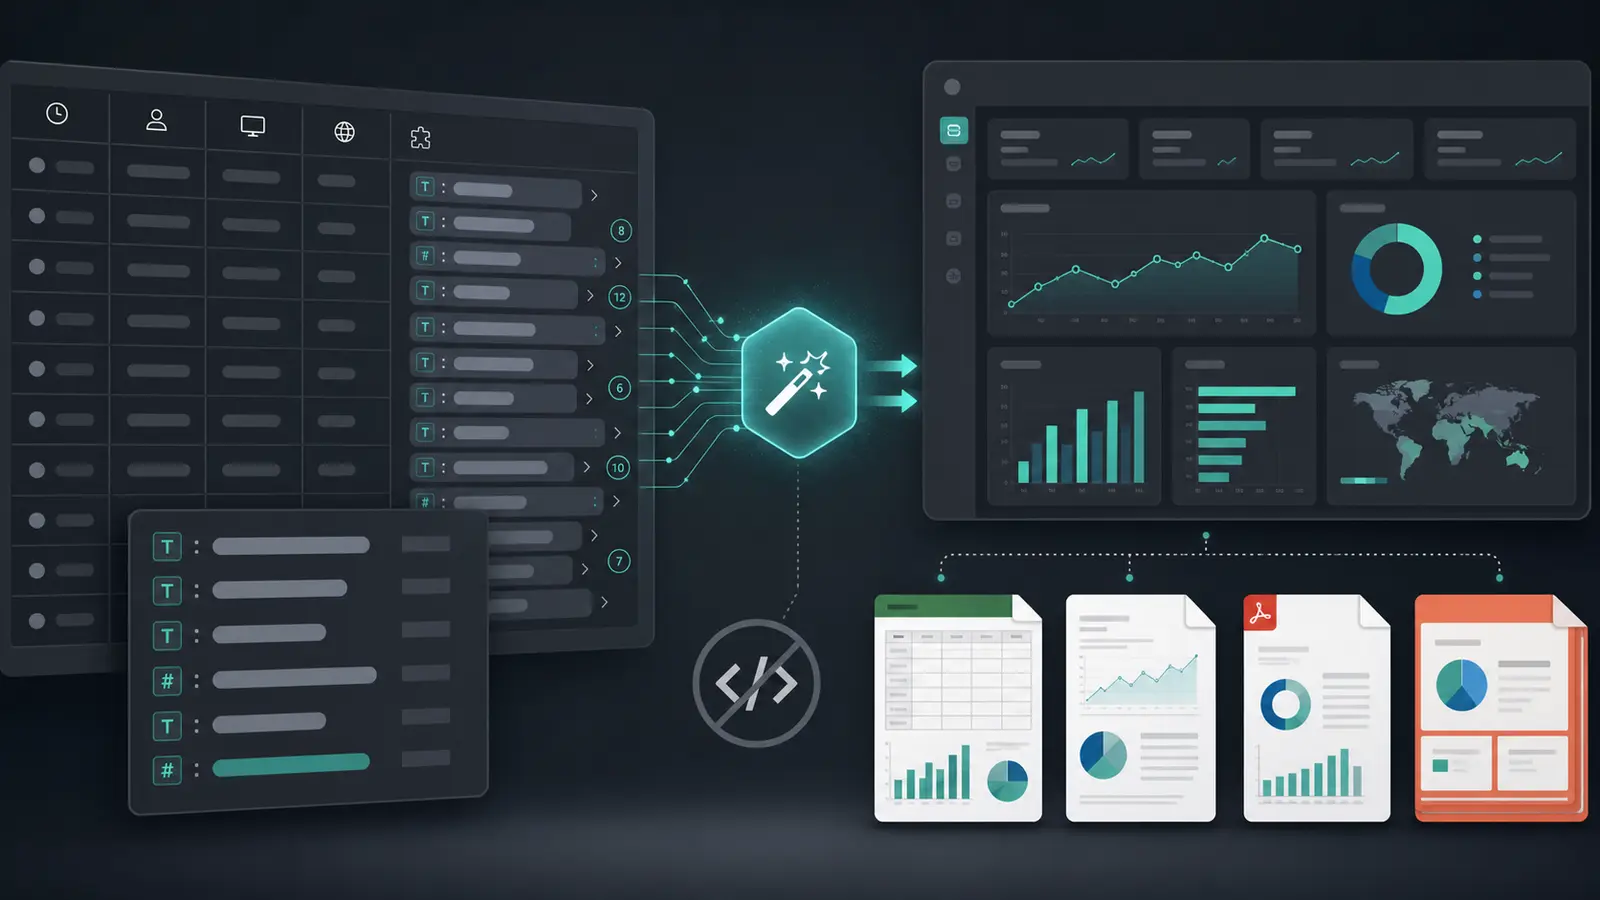
Anomaly is an AI data analyst for weekly client reporting, turning business data into dashboards, reports, exports, documents, PDFs, and scheduled reporting workflows. For this use case, the fit is straightforward: connect or prepare the Google Sheet, build the recurring report layer, keep the logic inspectable, and schedule the client-ready output.
With Anomaly, teams can work with Google Sheets as a source workflow alongside other supported data sources. The output layer includes interactive dashboards, Excel reports/exports, Excel-native dashboard exports, PowerPoint slides, Word docs, PDF reports, and scheduled reporting workflows.
For scheduled client reports, Anomaly supports:
- Daily, weekly, or monthly cadences with local time and IANA timezone settings.
- Email recipients for scheduled dashboard reports.
- Rendered report attachments, defaulting to PDF when no other supported report format is set.
- Narrative summary bullets in the email body alongside the attachment.
- Dashboard refresh before capture where instructed and where the source/workflow supports it.
- Verifiable logic through metric definitions, business rules, source-backed calculations, and output logic.
That does not make Anomaly a live-streaming monitor, universal auto-refresh layer, Slack notifier, SMS sender, webhook system, or full enterprise BI replacement. It is better to be precise: Anomaly helps client-facing teams package repeatable analysis into reviewed dashboards, PDFs, reports, slides, docs, and scheduled email workflows.
If your current reporting process depends on a Friday scramble, start a workspace and build the weekly report around the source, the metric definition, and the review note - not around manual copy-paste.
FAQ
Can Google Sheets send scheduled PDFs?
Yes. Google Apps Script can use installable time-driven triggers to run a reporting function on a schedule, export a Google Workspace spreadsheet or report view as a PDF, and email the PDF using MailApp or Gmail-based script workflows. The important caveat is that authorization, quotas, file size, and source-data checks still matter.
What should go in a weekly client reporting checklist?
A practical weekly checklist should include source sheet readiness, field mapping, metric definitions, date-window freshness, duplicate and missing-record checks, report/dashboard template review, PDF render review, scheduled email recipients, and weekly maintenance notes for any source changes or caveats.
What should not be fully automated?
Do not fully automate final judgment. Human review should cover narrative claims, client context, unexpected source changes, caveats, recipient lists, and whether the report is appropriate for the decision the client will make. Automation should handle the mechanics; people should own the promise.
Can Anomaly send scheduled PDF reports by email?
Yes. Anomaly supports scheduled reporting workflows for dashboard reports with daily, weekly, or monthly cadence, local time, timezone, and recipients. The scheduled job can render a report, attach the generated PDF to an email, and include narrative summary bullets in the email body.
Is this a replacement for enterprise BI?
No. This workflow is for consultant-led and client-facing weekly reporting where the goal is a repeatable, verifiable PDF from Google Sheets or supported business data. It is not a full enterprise BI replacement, live monitoring system, universal automatic-refresh layer, or governance stack for every company.