Independent consultants waste hours of billable time because every client CSV export looks slightly different. One month, the date column is formatted as MM/DD/YYYY; the next month, it arrives as DD-MM-YYYY with several missing values. A dashboard or monthly report is not truly repeatable until your processes for intake, mapping, metric definitions, and data caveats are standardized.
Quick answer — repeatable client dashboards from messy CSVs
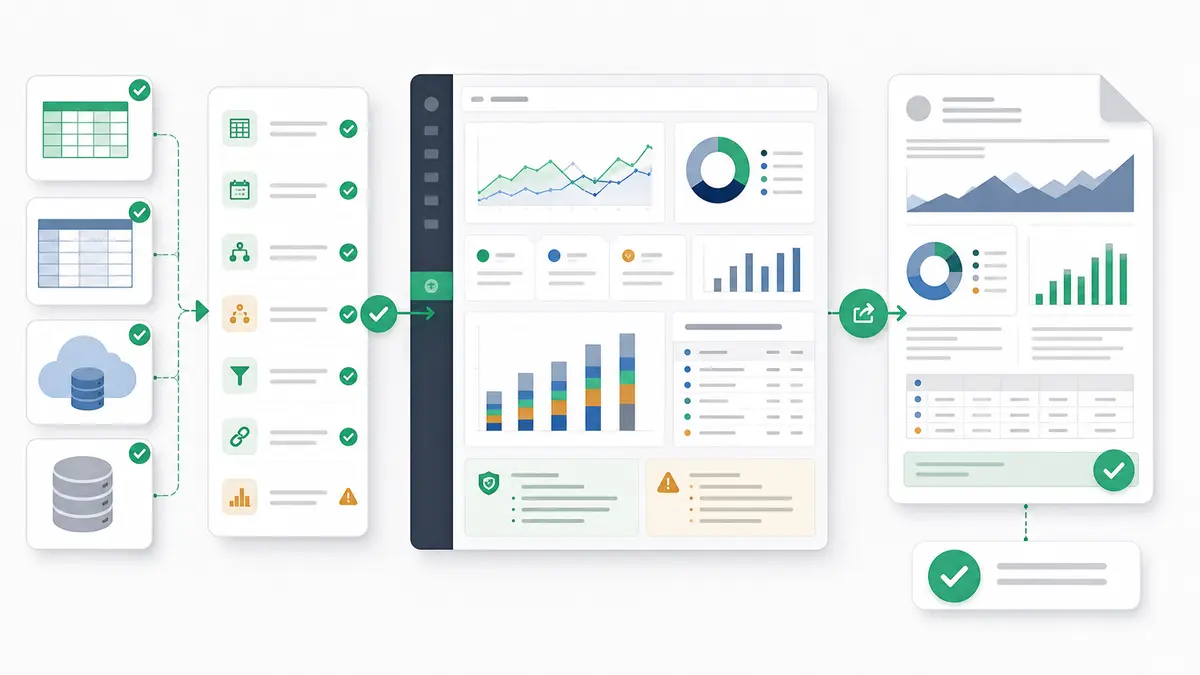
Independent consultants can build repeatable client dashboards from messy CSVs by turning every client export into the same reviewed workflow: capture intake rules, validate headers and date fields, map client-specific columns to metric definitions, check duplicates and missing IDs, reuse dashboard/report templates, record caveats, and refresh from the next file without pretending messy source data is cleaner than it is.
By structuring your CSV analysis workflow around a clear validation and mapping framework, you can deliver reliable, professional reporting without rebuilding your analysis from scratch every month.
Why Messy Client CSVs Break Repeatable Dashboards
Relying on raw client CSVs for ongoing reporting is notoriously difficult. CSV is a common format for spreadsheet and database exports, but it does not behave like one single clean standard in the real world. The Python CSV documentation notes that subtle differences exist across applications; dialects, delimiters, quoting rules, headers, and row shapes can vary. Python's CSV parser also reads fields as strings unless conversion logic is explicitly applied.
The W3C CSV on the Web primer highlights the underlying problem: CSV does not natively encode column data types or uniqueness constraints. That makes validation harder and creates immediate risks such as missing values and mixed data types in the same column. Metadata or schemas have to do the work that the raw CSV file cannot do by itself.
GOV.UK's tabular-data guidance says a usable CSV should have a clear header row, rows whose cell values match those column titles, and metadata or annotated tables that describe columns, row order, titles, and datatypes. Without that discipline, dashboard workflows fail when a client changes a header name, exports empty rows, or sends a refreshed file with a slightly different shape.
The GOV.UK data quality framework also emphasizes that data quality rules should be tied to the specific use case and critical fields. Core quality dimensions include completeness, uniqueness, consistency, timeliness, validity, and accuracy.
For consultants, that is the real risk. A dashboard can look polished while the source file quietly changes underneath it. You protect the client relationship by checking the file before the dashboard, naming caveats before the meeting, and making the refresh process repeatable enough that each new CSV is handled the same way.
The Repeatable Client-Dashboard Workflow Matrix
To make monthly or weekly reporting repeatable, run every client file through a standardized workflow matrix before updating the presentation layer.
| Step |
What to standardize |
Messy CSV risk |
Reusable artifact |
Client-safe wording |
| Client intake |
Source file delivery schedule and file format expectations. |
Client sends a different file type, changes columns without notice, or sends an old export. |
Intake checklist and file specification doc. |
"To keep delivery on schedule, please provide the monthly export in the agreed format by the agreed date." |
| File validation |
Delimiter, headers, row count, export timestamp, and file period. |
Extra blank rows, broken delimiters, or partial exports throw off parsing and totals. |
File validation checklist or script. |
"We verified the file structure against the baseline schema before updating the report." |
| Schema/field mapping |
Mapping client-specific column names to canonical reporting names. |
customer_id becomes client_num, or order_date becomes date, breaking formulas. |
Column mapping dictionary. |
"We mapped your internal field client_num to the standard Customer ID field to maintain trend continuity." |
| Duplicate/missing checks |
Blank IDs, duplicate transaction rows, missing dates, and missing metric values. |
Duplicate rows double-count revenue; missing IDs skew customer-level counts. |
Data quality exception log. |
"Duplicate-risk rows and missing IDs are listed in the review notes before we treat the metric as final." |
| Metric definitions |
Calculations for core business KPIs. |
The client defines revenue after refunds, but the export contains gross numbers. |
Shared metric definition glossary. |
"Revenue is calculated net of refunds, matching the agreed business rules." |
| Dashboard/report template |
Layout, charts, tables, narrative summary, and appendix logic. |
Rebuilding charts manually every month wastes time and introduces inconsistency. |
Standard reporting template. |
"This report uses the same layout and metric definitions as last month so comparisons stay consistent." |
| Review notes |
Documentation of data gaps, source changes, and assumptions. |
Client assumes the source file is perfect and questions discrepancies later. |
Executive summary caveat list. |
"The review notes call out missing region codes and the impact on segment-level reads." |
| Export/delivery |
Deliverable format, delivery channel, and version label. |
Sharing raw workbooks invites accidental edits or mismatched versions. |
PDF, PowerPoint, Excel export, or interactive dashboard package. |
"Your monthly deliverable is ready for review with the source caveats attached." |
| Recurring refresh |
Replacing old data with the new file and preserving the mapped logic. |
Copy-paste refreshes create quiet calculation drift. |
Reusable data import and refresh workflow. |
"The dashboard has been refreshed with the July export using the same reviewed reporting workflow." |
Turn Field Mapping Into a Reusable Client Asset
The key to repeatable reporting is separating the messy source file from your clean analysis layer. Create a field mapping schema for each client that maps their specific column names to your canonical dashboard fields.
When you conduct a pre-meeting CSV audit, document these mappings so they can be reused next month. Your mapping asset should define:
- Alternate headers: document that
net_amt, Net_Amount, and net_revenue all map to the canonical field net_revenue.
- Renamed fields: keep a log of client-specific field names mapped to standard names.
- Join keys: define which columns serve as unique identifiers, such as
customer_id, sku, or transaction_id.
- Date columns: standardize string dates into a consistent format such as
YYYY-MM-DD.
- Metric columns and client-owned definitions: document how fields are aggregated to calculate key metrics, such as whether "active users" means 30-day active or 7-day active accounts.
By turning this mapping into an agreed-upon client asset, you set expectations early and prevent last-minute reporting disputes. The asset also lets a second consultant or client stakeholder review the logic without reverse-engineering the whole dashboard.
Write Caveats Before the Client Asks
Experienced consultants know that data is rarely perfect. Instead of trying to hide every missing cell behind the scenes, document the data limitations clearly. Caveats are not weakness. They are part of a defensible client deliverable.
Use these client-safe wording examples in reports, dashboards, and review notes:
- "This dashboard uses the fields present in the June export; rows with missing customer IDs are excluded from customer-level counts and listed in the review notes."
- "Revenue is mapped from
net_amount because the client defines revenue after refunds; changing that definition changes the totals."
- "This refresh is comparable to last month after mapping renamed fields; rows with missing dates are flagged, not silently assigned."
- "The current file supports a directional read by segment, but source-system confirmation is needed before treating the exact totals as final."
- "The dashboard excludes one-off fields that appeared only in this export unless the client confirms they should become part of the recurring definition."
The phrasing matters. Do not say "the dashboard is wrong." Say what the file supports, what was excluded, and what needs review before the next refresh.
When a Lightweight Repeatable Workflow Is Enough
You do not always need a complex data engineering pipeline to deliver strong client reporting. A lightweight, file-based workflow can be enough when the work has clear boundaries:
- The client provides recurring CSV, Excel, or spreadsheet exports on a weekly or monthly cadence.
- The core KPIs and business rules are stable.
- You are the primary analyst who reviews the data before presenting it.
- A small group of client stakeholders consumes the report.
- The client accepts review notes and source-file caveats as part of the delivery process.
- The reporting goal is decision support, not enterprise-wide governed analytics.
In these scenarios, you can analyze Excel and CSV files with a repeatable intake, mapping, review, and delivery process. That gives clients a professional dashboard or report without forcing a warehouse project before the use case needs one.
When to Move to BI or a Warehouse
A lightweight CSV workflow has limits. You should advise the client to move toward a heavier BI platform or warehouse setup when the reporting surface becomes too broad or too governed for consultant-owned file refreshes.
That usually happens when:
- dozens of sources must be integrated at the same time;
- hundreds of users need access to the same reporting environment;
- row-level access control is required;
- governed semantic models are needed across teams;
- strict service-level agreements or regulated access controls apply;
- writeback, operational workflows, or enterprise data governance are required;
- the client needs operational monitoring rather than periodic client reporting.
Microsoft's Power BI row-level security documentation is a useful example of the governance jump. Row-level security restricts data access for specific users and requires roles, rules, publication, membership, and validation. If that is the client need, do not pretend a lightweight CSV dashboard is the whole answer.
The point is not to make every client buy heavier infrastructure. The point is to know when the current workflow is enough, and when the risk profile has changed.
How Anomaly Helps Consultants Package the Workflow
Anomaly is an AI data analyst for turning business data into repeatable, verifiable client dashboards and reports. It is not a generic BI replacement for every company, and it is not a universal data cleaner. For independent consultants, the fit is practical: bring in client files or supported sources, keep the logic visible, and package the output in a format the client can actually use.
With Anomaly, consultants can:
- upload
.xlsx, .xls, and .csv files up to 1GB;
- work with supported business data sources via supported data sources;
- build interactive dashboards for recurring review;
- produce business reports, source-backed summaries, and scheduled reporting workflows where the source and workflow support them;
- review metric definitions, business rules, source-backed calculations, and output logic before sending work to a client.
That last point is the difference between a pretty dashboard and a consultant-grade deliverable. The client-ready version is not just visual. It is reviewed. If you also need to turn analysis into a quarterly narrative, pair this workflow with a client-ready QBR slide workflow.
If your consulting work keeps getting blocked by messy client exports, start a workspace and build the repeatable reporting layer around the file, the definition, and the review notes.
FAQ
How do I make a client dashboard repeatable from CSV exports?
Create a standard workflow for every export: intake rules, file validation, field mapping, metric definitions, data-quality checks, dashboard/report template, review notes, and delivery. The repeatability comes from reusing the same definitions and checks, not from assuming every CSV will arrive clean.
What should I check before building a dashboard from a messy CSV?
Check the delimiter, header row, row count, date fields, key identifiers, duplicate rows, missing values, metric columns, and unexpected new fields. Also confirm that the file covers the intended reporting period and that refreshed files match the expected schema.
How should I explain messy-data caveats to clients?
Use specific, calm wording. State which rows or fields were affected, how they were handled, and what the limitation means for the dashboard. For example: "Rows with missing customer IDs are excluded from customer-level counts and listed in the review notes."
When is a CSV-based dashboard workflow not enough?
It is not enough when the client needs many integrated sources, many users, row-level access control, governed semantic models, strict SLAs, regulated access, writeback, or enterprise data governance. That is when a heavier BI or warehouse setup becomes the more responsible recommendation.
Can Anomaly replace an enterprise BI stack?
No. Anomaly is an AI data analyst for fast, traceable, and repeatable business reporting from files and supported sources. It is not a full enterprise BI replacement, universal data cleaner, or real-time monitoring system. It helps consultants deliver verifiable dashboards and recurring client reports without pretending every client workflow is an enterprise BI program.