TL;DR: If you're choosing between hiring a professional dashboard designer and building dashboards yourself, you're solving the wrong problem for many internal reporting use cases. In 2026, Anomaly AI lets teams ask for dashboards and visual analysis directly from their business data. Professional design still makes sense for customer-facing embedded analytics and regulatory-compliant reporting. DIY tools still make sense when your team has the skill and time.
The third option: ask for the business output directly
The "professional services vs DIY" frame was the right question when the deliverable was always a dashboard. Someone needs to see the numbers. The numbers need to look professional. You either hire a firm to design it or you do it yourself in Tableau, Power BI, or Looker Studio. Both paths end with a published dashboard that someone has to maintain.
In 2026, many teams don't need another manually assembled dashboard project. They need a useful business output. "What happened to conversions last month?" might become a dashboard, an Excel report, a PDF review pack, a slide, or a scheduled update. The fastest path is no longer always "design a dashboard tile"; it is "ask for the output and review the logic behind it."
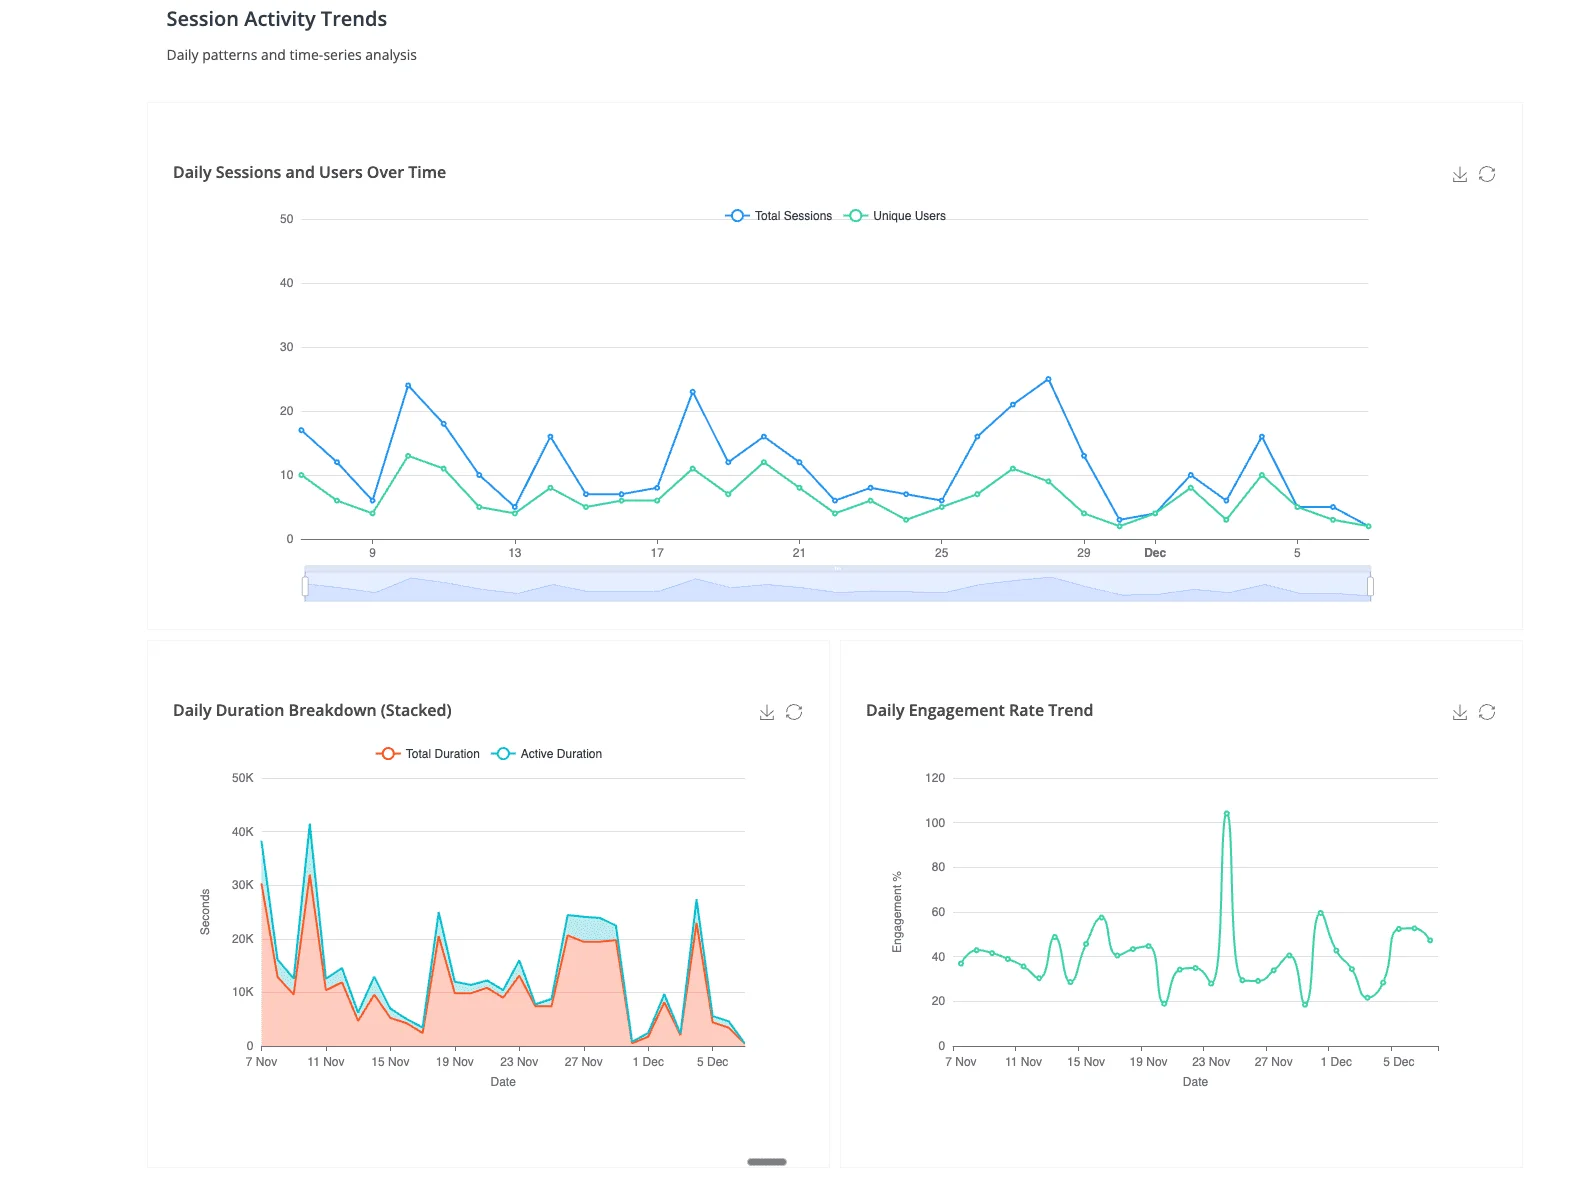
That's the slot Anomaly AI fills: connect BigQuery, MySQL, Excel, Google Sheets, GA4, and ad account exports, then ask for the dashboard or visual analysis you need.
This doesn't eliminate professional dashboard design. It eliminates the assumption that every data need requires one.
Option 1: Hire professional dashboard design services
The services path: you hire a consultancy, a freelance BI developer, or a design agency to build dashboards for your organization. They interview stakeholders, model your data, design the layouts, build the dashboards in Tableau or Power BI (or a custom stack), test them, and hand them off with documentation and training.
When professional design still makes sense
- Customer-facing embedded analytics: if dashboards are part of your product — analytics features inside a SaaS tool, client-facing portals, investor reporting interfaces — the design quality is part of the value proposition. Professional polish matters because your customers see it.
- Regulatory-compliant reporting: healthcare (HIPAA), financial services, government procurement — where the dashboard itself is an audited artifact. Compliance documentation, data lineage, and access controls must meet specific standards.
- Executive storytelling: board decks, investor presentations, all-hands dashboards where the narrative and the visual design carry meaning. A pixel-level craft decision (color, layout, hierarchy) changes how the audience interprets the data.
- One-time high-stakes projects: a single critical dashboard — M&A due diligence, product launch command center, annual planning model — where the cost of getting it wrong exceeds the cost of hiring a specialist.
When professional design is overkill
- The question changes weekly and no single dashboard layout can keep up — professional design assumes a stable scope, and scope churn turns a fixed-price project into a retainer
- The audience is internal and cares about accuracy more than aesthetics — pixel-level polish is wasted on a team that just wants to know if spend is on track
- The data sources shift frequently (new spreadsheet, new API, different date range) — every source change requires the professional to re-model the data
- The real deliverable is "answer the question" not "maintain a published dashboard" — hiring a designer to build a dashboard for a question that will move on next week is the wrong abstraction
Cost profile
Professional dashboard design projects typically run $10K–$50K+ for a scoped engagement (stakeholder interviews, data modeling, design, build, testing, handoff). Ongoing maintenance retainers add $2K–$8K per month. Freelance BI developers charge $100–$250 per hour depending on tool specialization and geography. For customer-facing embedded analytics, costs can exceed $100K when custom front-end development is involved.
Option 2: Build dashboards yourself (DIY)
The DIY path: your team builds the dashboards internally using a BI platform. Power BI, Tableau, Looker Studio, Metabase, or Apache Superset — you choose the tool, connect the data, model the semantic layer, design the visualizations, and publish them for the organization.
When DIY makes sense
- You have the skill: someone on the team knows the BI tool well enough to build and maintain dashboards without hand-holding
- The dashboards are stable: the same 5–10 dashboards get viewed weekly by the same audience. The maintenance burden is manageable.
- Budget is tight: open-source tools (Metabase, Apache Superset) are free to self-host. Power BI Pro at $14/user/month is affordable for small teams. Looker Studio is free for Google-native data.
- The organization has committed to a dashboard workflow: if the culture is "every Monday starts with the same 3 dashboards," maintaining them internally is reasonable.
When DIY breaks down
- The person who built the dashboards leaves and nobody can maintain them — institutional knowledge about the data model, the filter logic, and the refresh schedule walks out the door
- Ad-hoc questions pile up faster than the team can build tiles — the analyst spends more time adding dashboard features than doing actual analysis
- The data model becomes its own project — weeks of semantic-layer work in Power BI (DAX) or Tableau (LOD expressions) before the first chart appears
- Stakeholders request "just one more chart" until the dashboard is a wall of tiles nobody reads — dashboard sprawl is the BI equivalent of feature creep
Cost profile
Tool costs are transparent: Power BI Pro $14/user/month, Tableau around $35/user/month for Creator seats, Metabase and Superset free to self-host (infrastructure costs only). The real cost is time — a BI-competent analyst spending half their week building and maintaining dashboards is an $80K–$120K/year cost that doesn't show up in the software line item.
Option 3: AI-native analysis — Anomaly AI
The output-first path: instead of designing dashboards (hired or DIY), connect your data to Anomaly AI and let the person who needs the report ask for it directly. The AI creates charts, tables, dashboards, docs, slides, PDFs, or scheduled updates with inspectable logic underneath.
What this replaces
- The ad-hoc report queue: "Can you pull revenue by region for Q3?" No ticket, no tile design, no wait. The requester asks and gets a verifiable report output.
- The weekly report ritual: the same person who reads the report generates it, iterates on it, and shares the conversation. No build-then-publish cycle.
- Cross-source investigation: join warehouse data with a spreadsheet and GA4 in one question. Professional services firms charge change-order rates for this; the product handles it natively.
- Exploratory analysis: "Why did churn spike?" → follow-up → follow-up → pattern found. The conversational flow is the natural shape of investigation; dashboards force you to pre-commit to a layout before you know the question.
What this does not replace
- Customer-facing embedded analytics where the visual design is part of the product
- Regulatory dashboards with audit trails, row-level security, and compliance documentation
- Executive storytelling decks where the narrative design carries the meaning
- Mature dashboard workflows where 50+ people look at the same tiles every week
Cost profile
Free $0 / Starter $16/month / Pro $25/month / Team $45/seat/month. One Pro plan for a year ($300) costs less than a single professional dashboard design project, and handles the ad-hoc question volume that would otherwise generate a continuous stream of "can you build me a chart?" requests.
Decision framework: which approach for which need
| Need |
Best approach |
Typical cost |
| Recurring questions and ad-hoc analysis |
Anomaly AI |
$0–$300/month |
| Customer-facing embedded analytics |
Professional design services |
$50K–$100K+ project |
| Stable weekly dashboards for internal teams |
DIY with Power BI / Tableau / Metabase |
$14–$35/user/month + analyst time |
| Regulatory-compliant reporting |
Professional services or in-house specialist |
$10K–$50K project + maintenance |
| Executive storytelling / board decks |
Professional design or senior analyst |
$5K–$20K per deliverable |
The pattern: professional design for craft-intensive deliverables that face external audiences. DIY for stable, recurring internal dashboards where someone owns the maintenance. Anomaly AI for everything else — the daily questions, the ad-hoc investigations, the "can you pull this by Friday" requests that are the bulk of actual analytics work in most organizations.
Three questions to determine which approach you need
- "Who sees the output?" Customers or regulators → professional design. Internal team → DIY or AI-native. Solo analyst or founder → AI-native.
- "How often does the question change?" Same dashboard every week → DIY. New question every day → Anomaly AI. One-time high-stakes deliverable → professional.
- "What's the real deliverable?" A published, maintained dashboard → design or DIY. An answer to a business question → Anomaly AI.
Most teams that arrive at this page searching "data visualization services" or "professional dashboard design" are actually looking for answers from their data. The assumption that the answer must take the form of a designed dashboard is the frame that the AI-native option breaks.
The practical hybrid in 2026
The teams that get the best results combine approaches: Anomaly AI for the daily analysis load (ad-hoc questions, weekly report generation, cross-source investigation), DIY dashboards in Power BI or Tableau for the handful of governed views that need to exist permanently, and professional design services for the rare customer-facing or regulatory deliverable that justifies the investment.
That stack gives you speed (AI-native answers in minutes), durability (maintained dashboards for the views that actually get used), and craft (professional design for the deliverables where polish matters). Most importantly, it frees your analysts from the build-and-maintain cycle so they can do the strategic work that actually requires a human — interpreting context, making recommendations, and owning the decisions that come after the numbers are clear.
The cost math is straightforward: a $300/month Team plan plus one scoped professional project per year for customer-facing analytics is a fraction of what most organizations currently spend on a full-time dashboard builder or a standing services retainer. The product handles the volume; the people handle the craft.
Start with the question, not the dashboard
If you're evaluating dashboard design options, try the AI-native path first. It's free, it takes ten minutes to connect a data source, and it answers the question most teams are actually trying to solve: "can we get answers from our data without a dashboard project?"
Try Anomaly AI free — Free $0 / Starter $16/month / Pro $25/month / Team $45/seat/month. Connect BigQuery, Snowflake, MySQL, Excel, Google Sheets, or GA4, then ask for the dashboard or visual analysis you need. If professional design or a DIY dashboard is still the right call for your situation, the comparison above will help — but most teams won't need to get that far.