How to automate a weekly marketing report from GA4, Google Ads and Search Console
Connect the three sources once, ask for the report in one request, check the numbers behind it, then schedule it to arrive every Monday, or only when something changes.
About 20 minutes·Beginner·6 steps
By Abhinav Pandey, Founder·Tested 8 October 2026·Updated
Quick answer
Connect GA4, Google Ads and Search Console once, or upload their exports. Ask for the report in one request that names the week and how each metric is counted, and check the query behind each number. Then schedule it for Monday. Set to “Only when something happens”, the schedule checks your condition on every run and sends the report by email or Slack only when it is met.
We ran every step on 8 October 2026 with sample files you can download. On that data, adding up daily users overstated weekly users by 24.3%; step 3 shows how to catch it.
Before you begin
- —An Anomaly account. Building and checking the report works on every plan. Scheduling needs Pro ($25 a month, or $20 a month billed yearly) or above; see pricing.
- —Read access to your GA4 property, Google Ads account and Search Console property through a Google sign-in, or exports of each by day.
- —Your definitions: which week you report on (we used Monday to Sunday) and how each number is counted, such as distinct users within the week.
To follow along without connecting accounts, use our sample. The files are synthetic, made by a seeded script, and cover 10 August to 7 October 2026. The workbook has the exact prompts, the schedule settings and the answer key.
- GA4 users by day (CSV, 2.4 MB)25,392 rows, one per user per day
- Google Ads campaigns by day (CSV)295 rows, five campaigns
- Search Console queries by day (CSV)1,062 rows, 18 queries
- Workbook: definitions, prompts, schedule, answer keyThe numbers to compare yours with
Every screenshot below comes from that run in an Anomaly test workspace. The numbers are sample data, not customer results.
Connect GA4, Google Ads and Search Console
Bring the three sources into one project. Connected accounts refresh before every scheduled run; uploaded files stay as they are until you upload new ones.
- 1.Create a new project.
- 2.Open Import or connect a data source.
- 3.Choose Google Analytics 4, Google Search Console and Google Ads, and sign in with Google for each. To use files instead, drop them on Add Files; CSV and Excel files can be up to 1 GB.
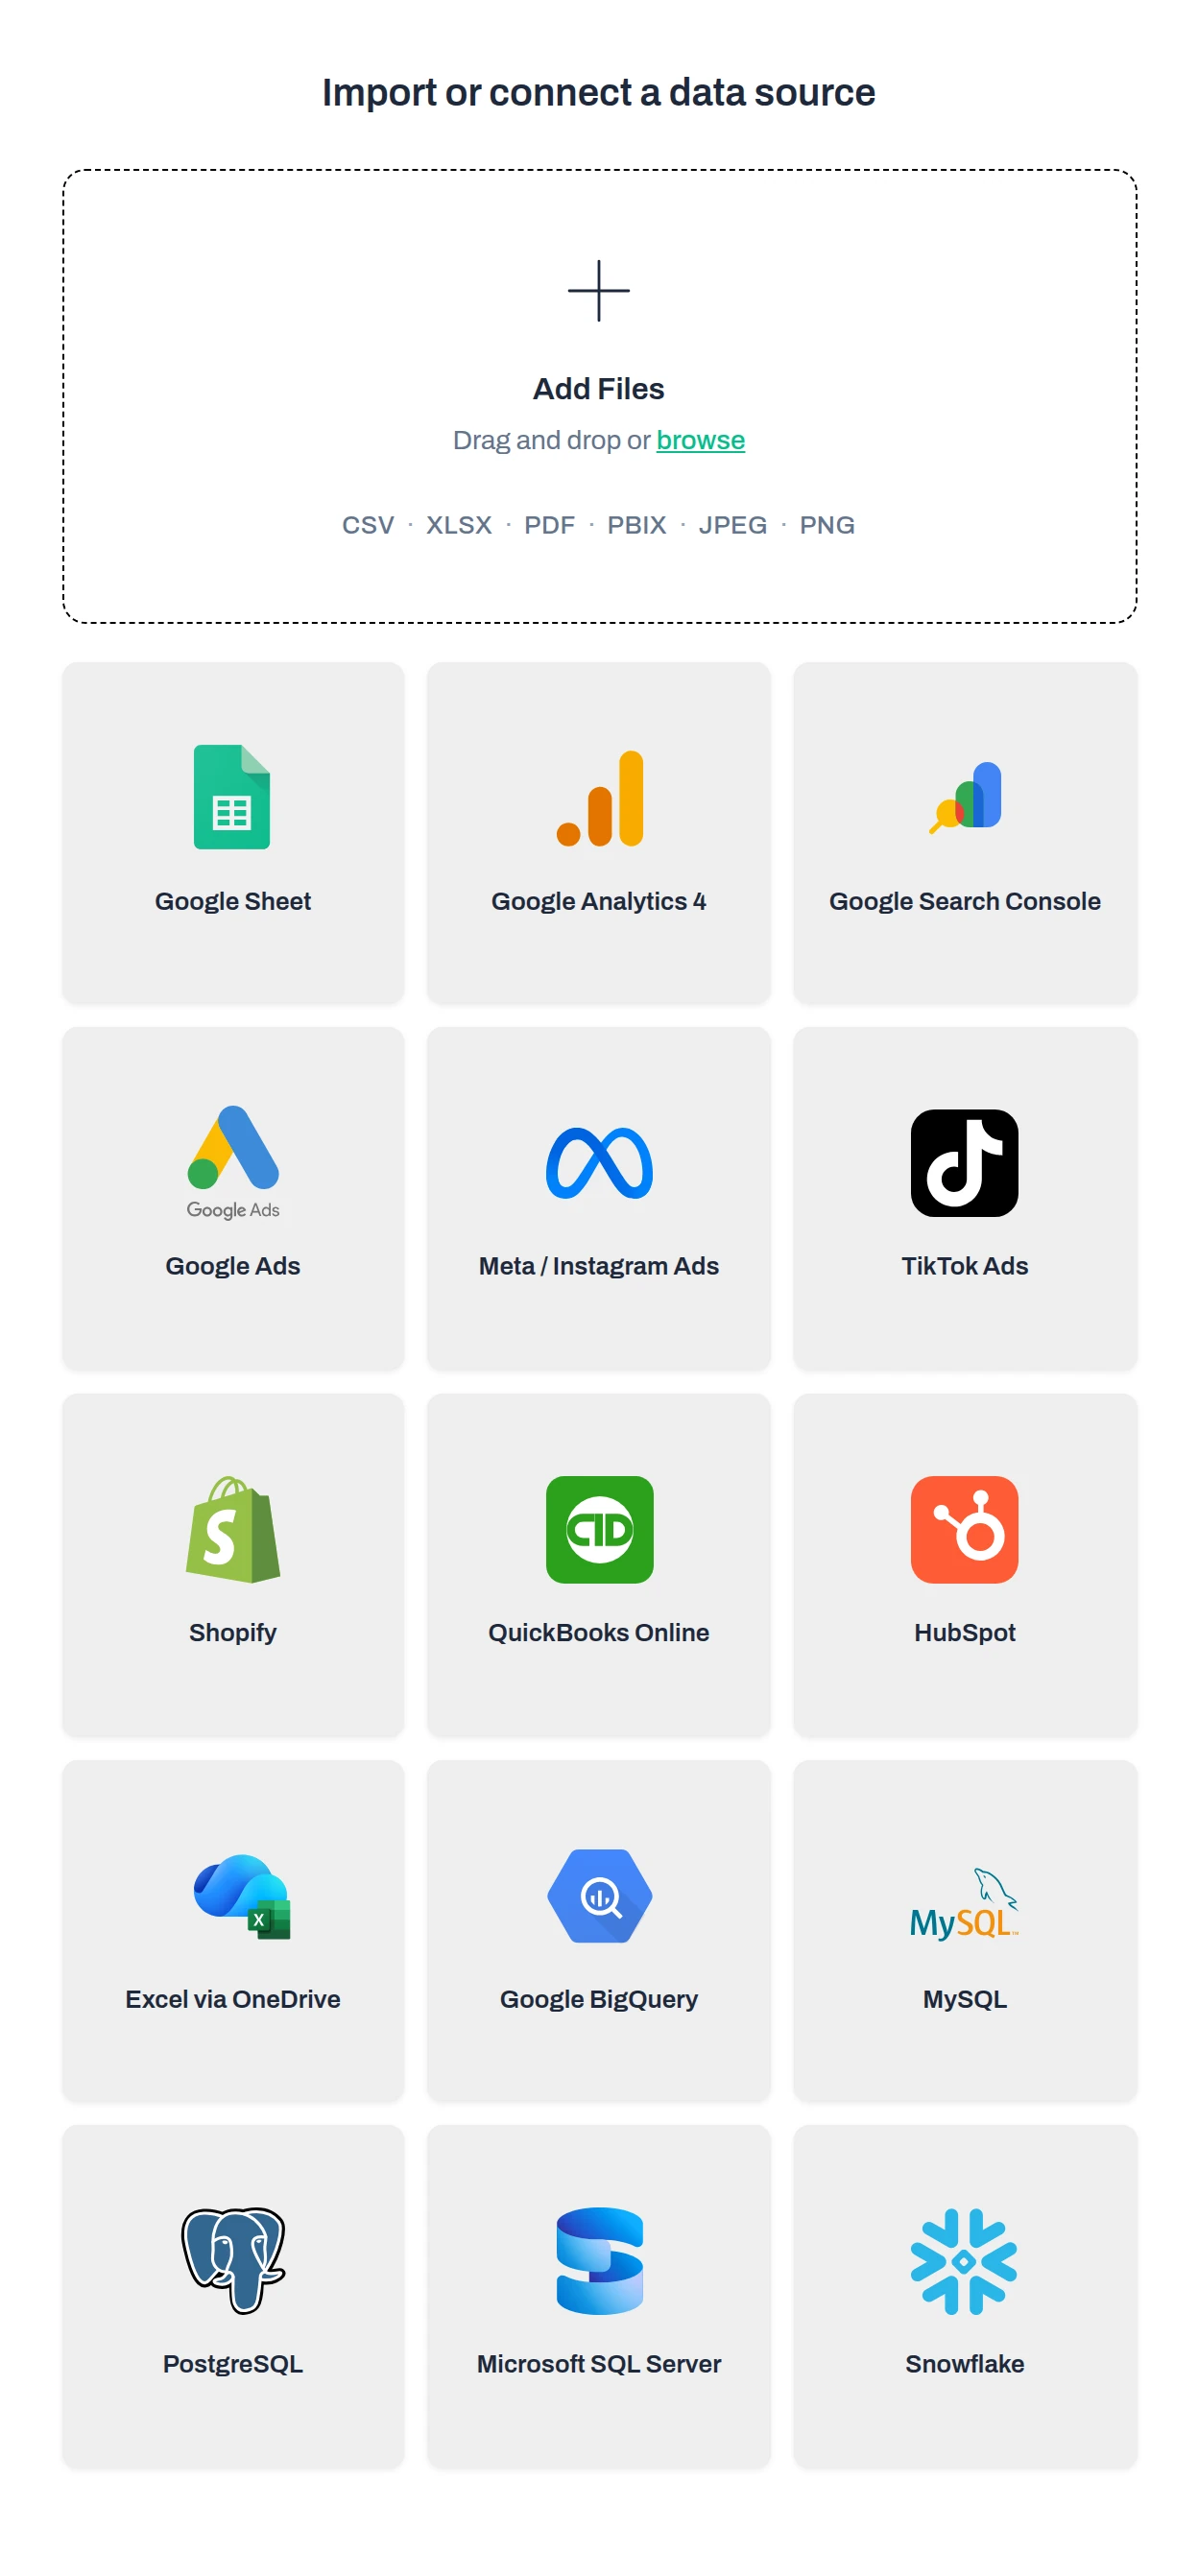
Result — The sources appear as tables in the project. With our sample files: GA4 users by day (25,392 rows), Google Ads campaigns by day (295 rows) and Search Console queries by day (1,062 rows).
Tip — The same panel connects Meta / Instagram Ads, TikTok Ads, HubSpot, Shopify, BigQuery and more; the full list is on the connectors page. For a weekly report that should update itself, connect accounts rather than uploading exports.
Ask for the weekly report in one request
Describe the report in one request. Name the sources, the week, and how each metric is counted. Anomaly writes the queries, picks the charts and builds the dashboard.
- 1.Open a chat in the project.
- 2.Paste your request. This is the exact prompt from our run:
Build a weekly marketing report dashboard from the three tables in this project: GA4 users by day, Google Ads campaigns by day, and Search Console queries by day. Use complete Monday-to-Sunday weeks only (10 Aug to 4 Oct 2026); 7 Oct is a partial day. Show weekly users counted as distinct user_pseudo_id per week, sessions, key events and revenue; sessions by channel per week; Google Ads cost, clicks, conversions and cost per conversion by campaign; Search Console clicks, impressions, CTR and average position by week; and the top queries by clicks with the week-over-week change for the latest complete week.
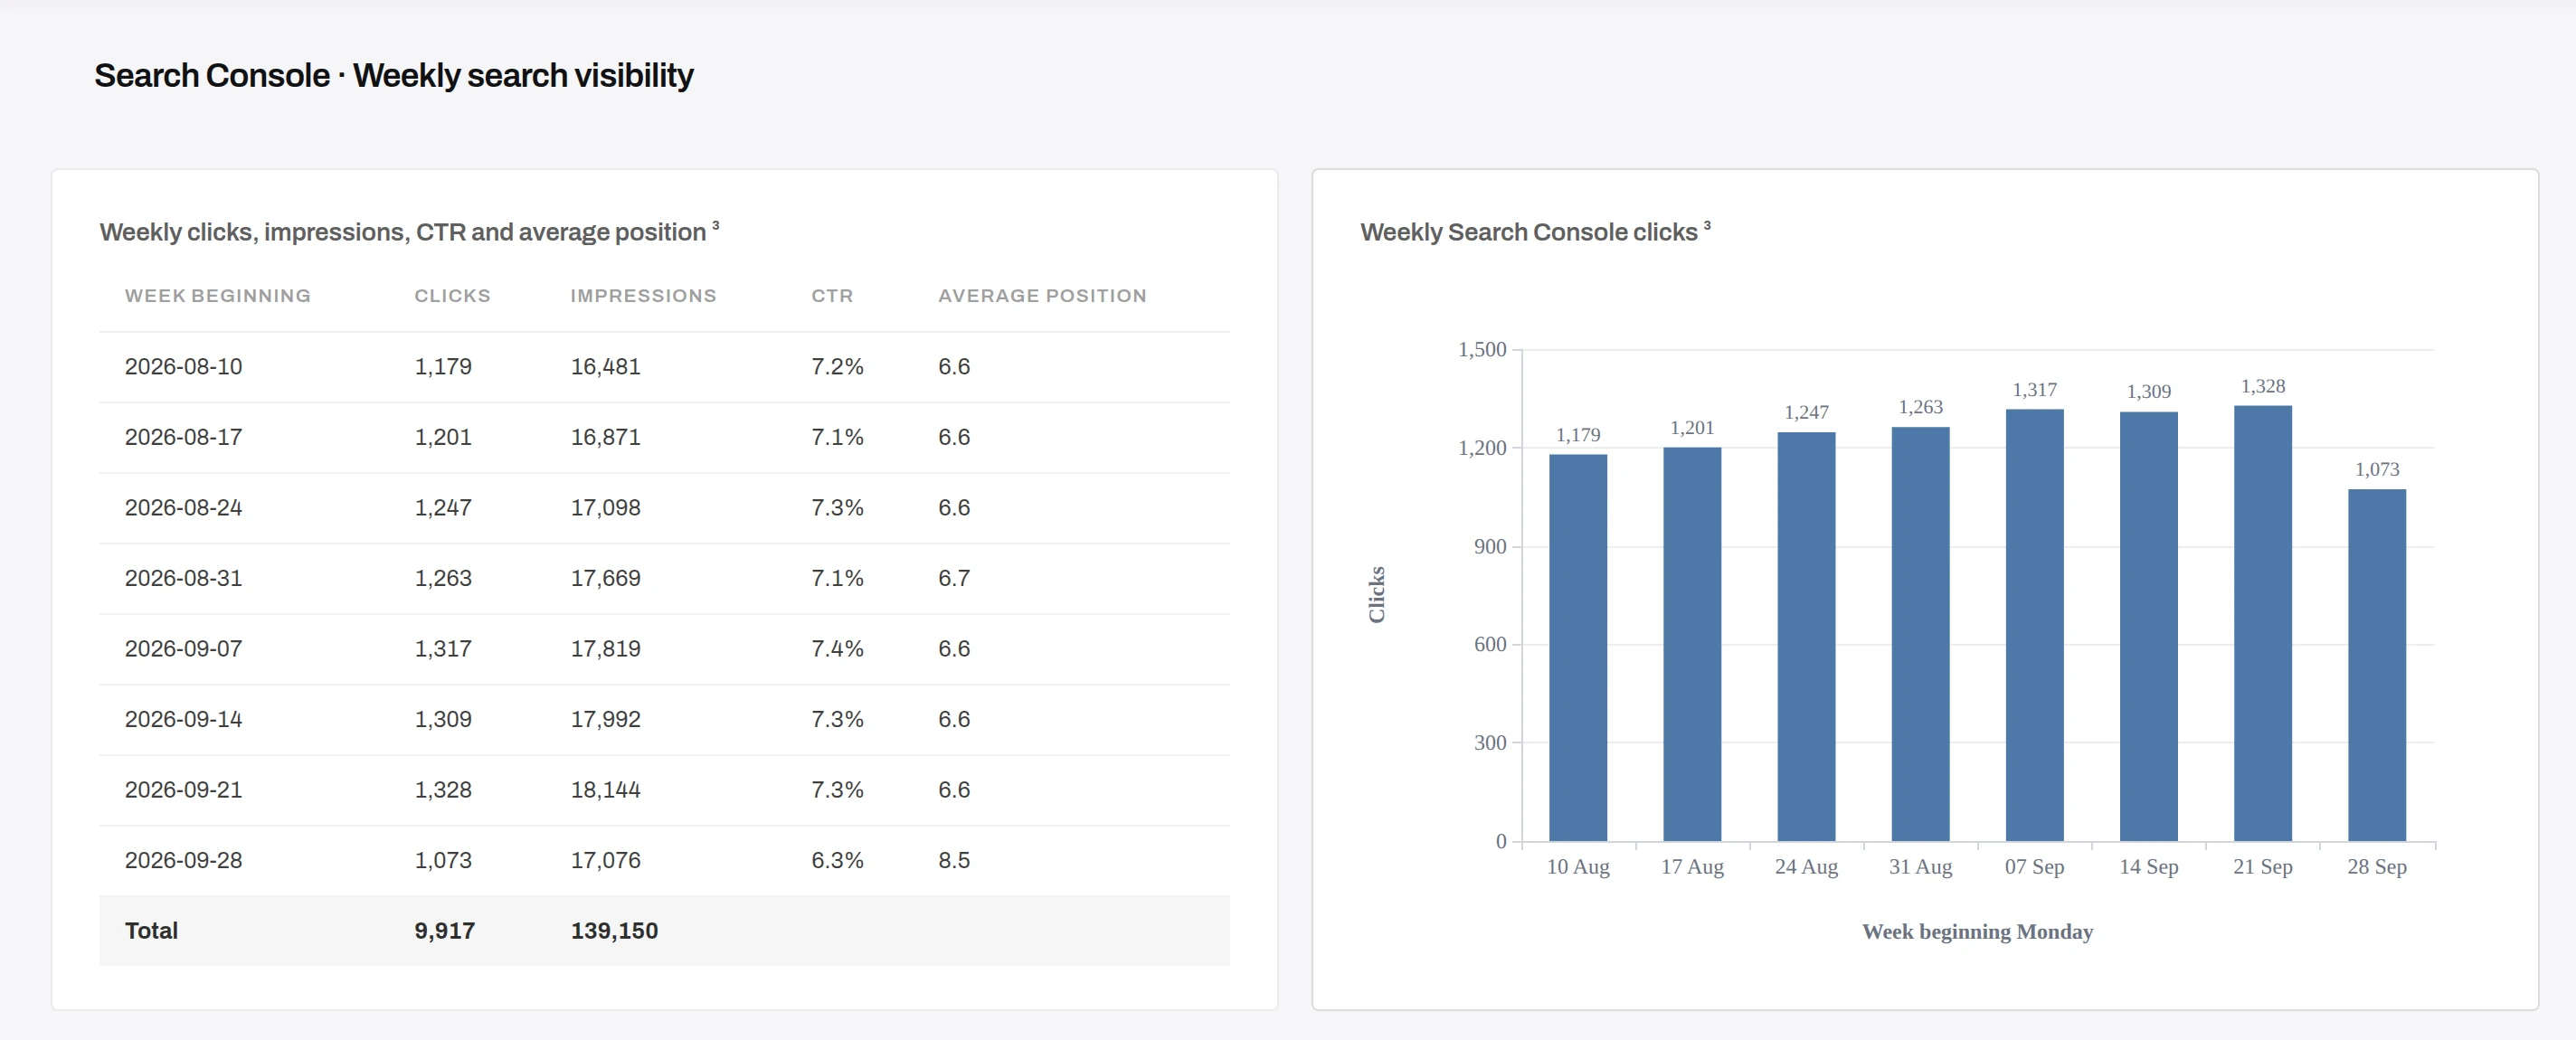
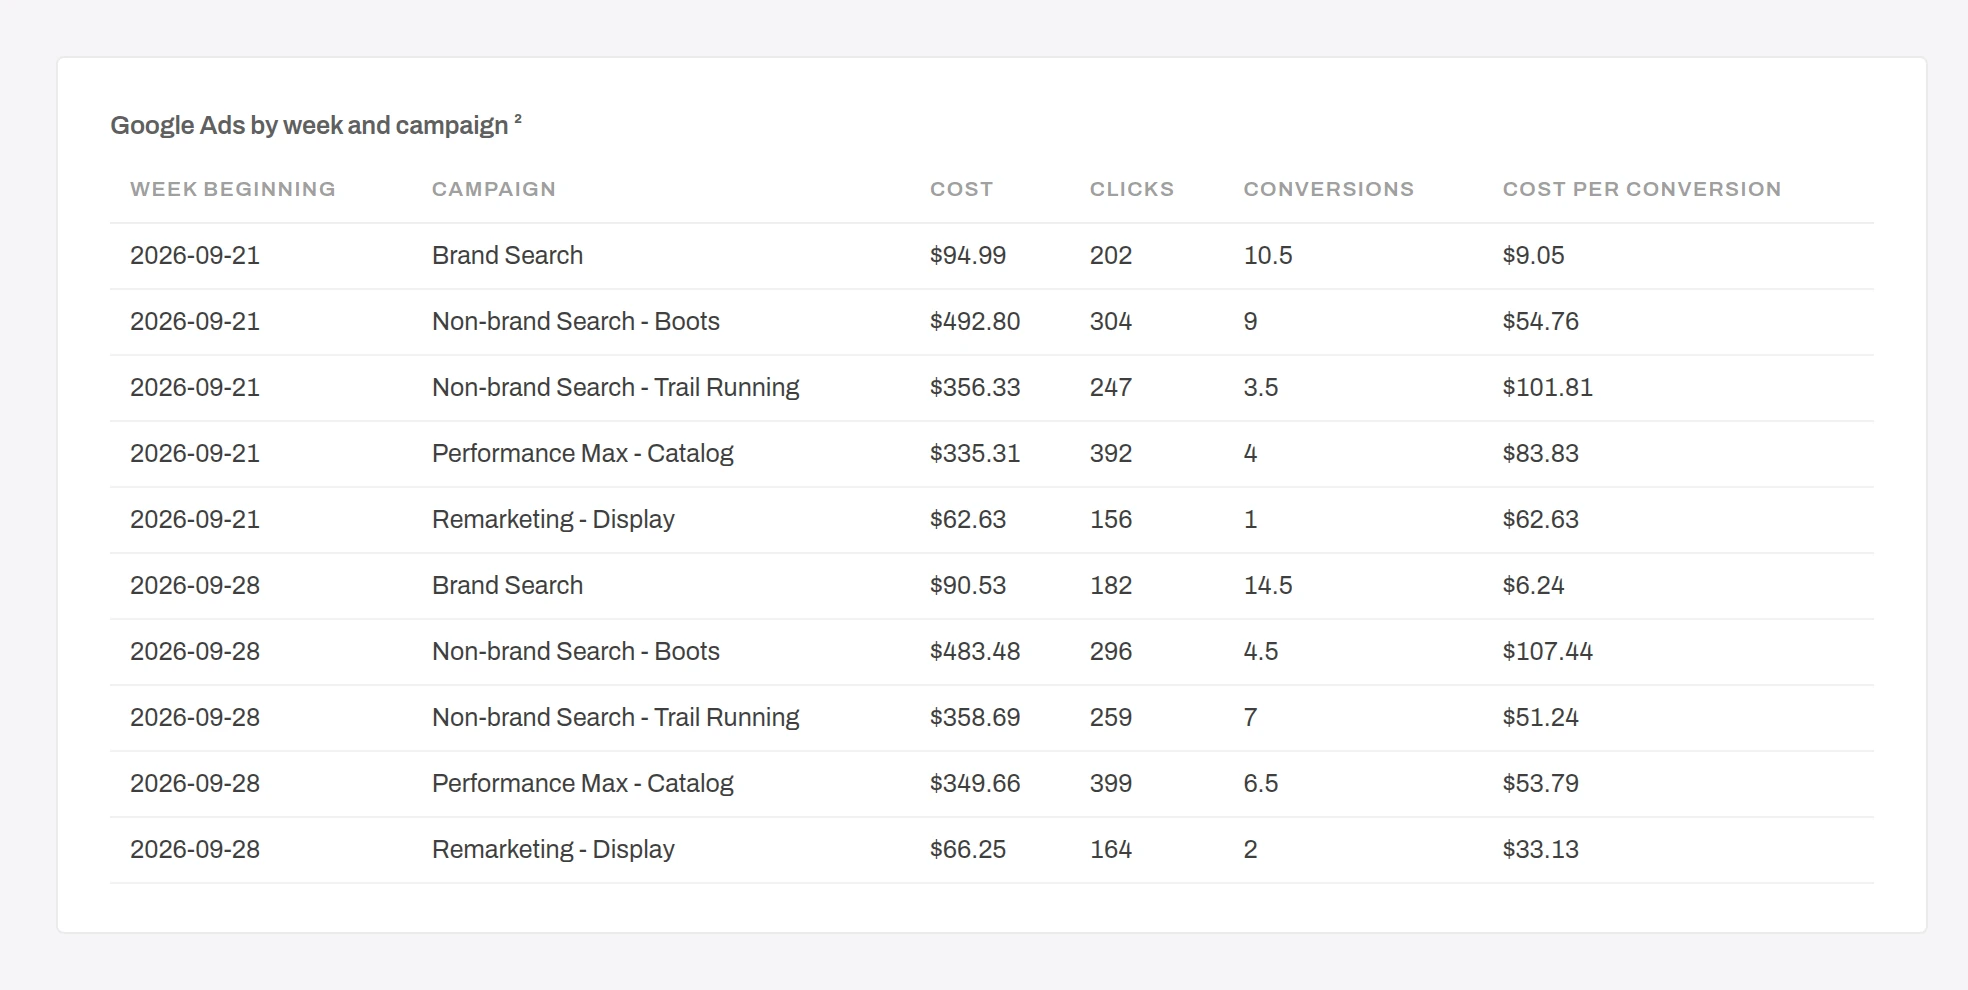
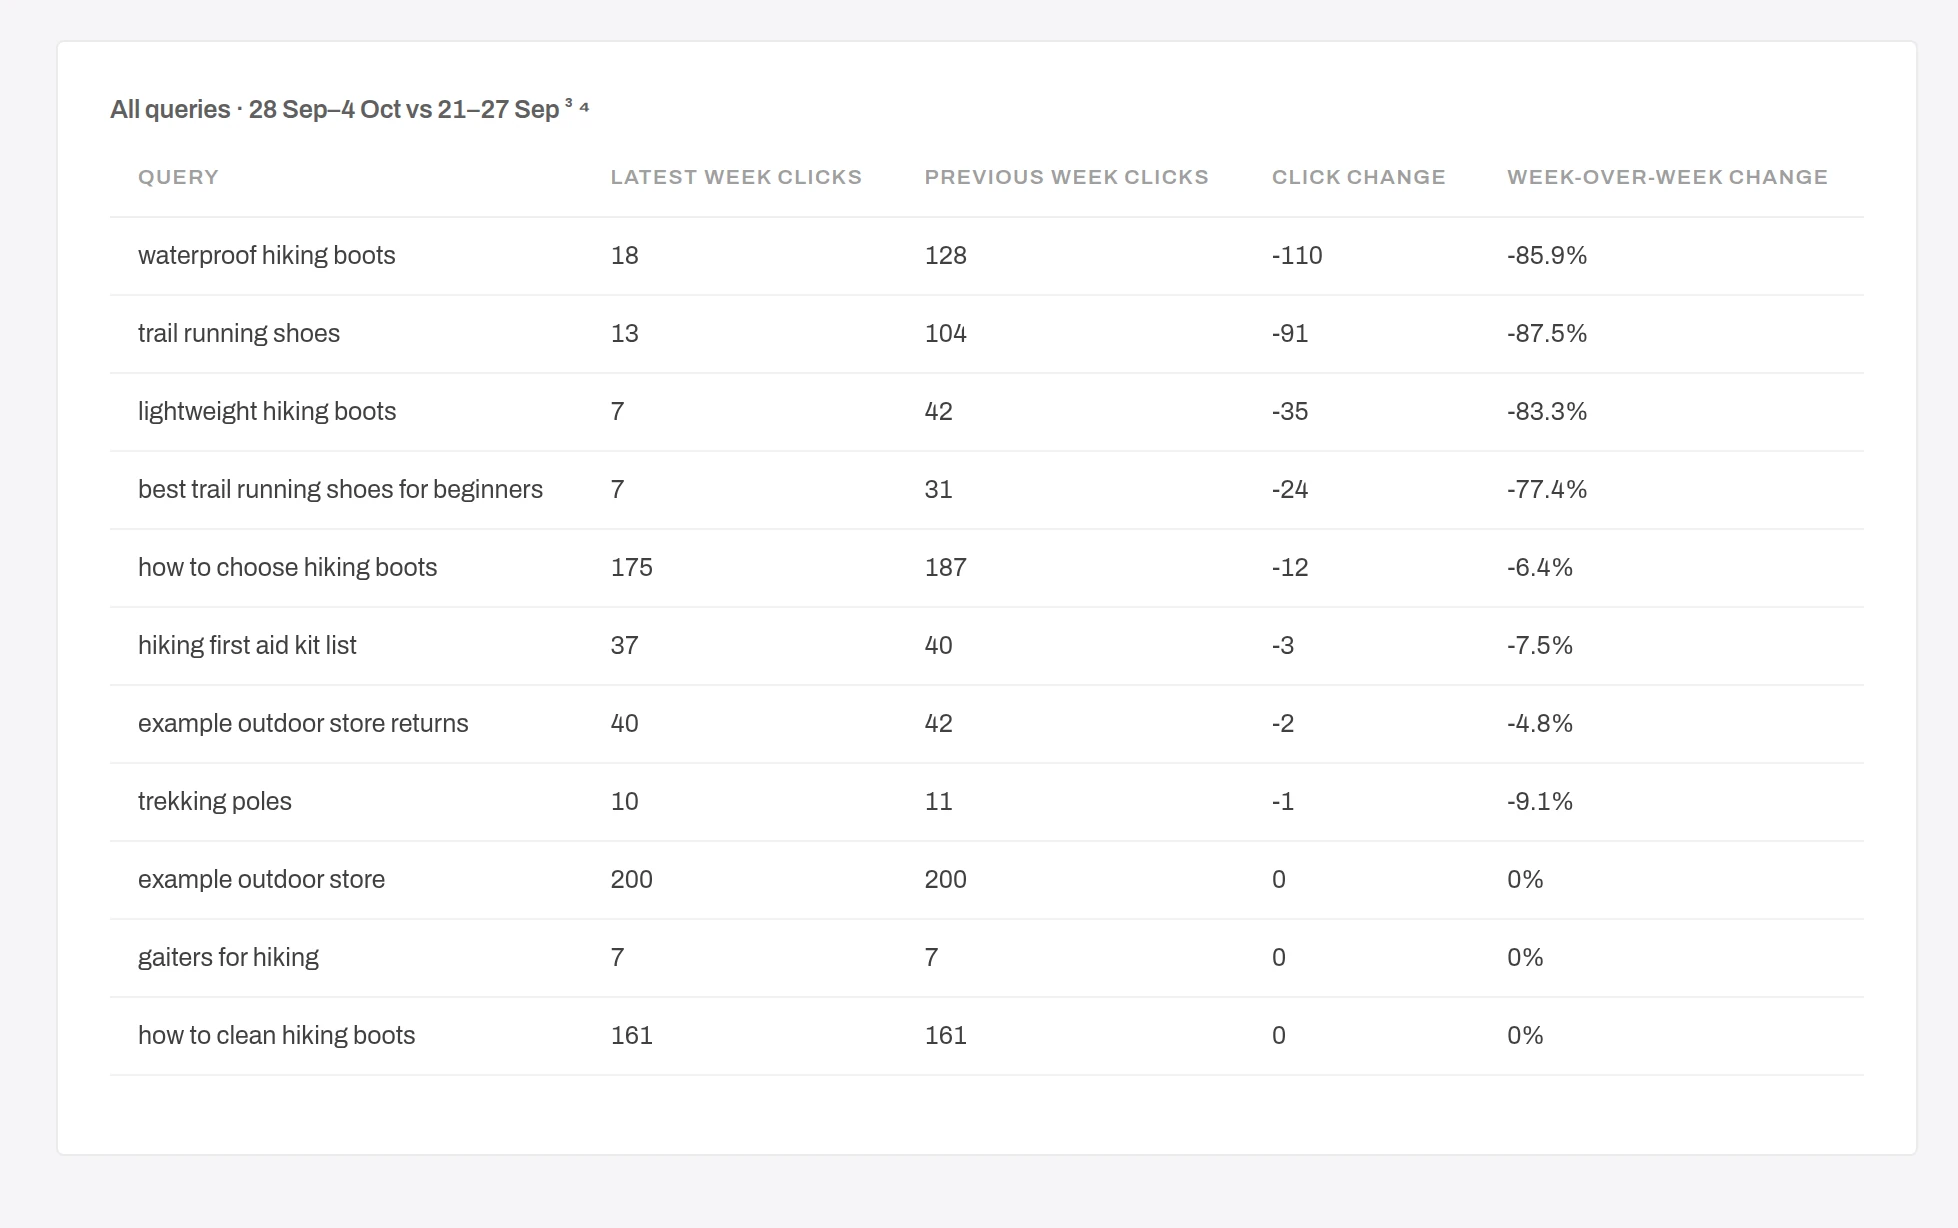
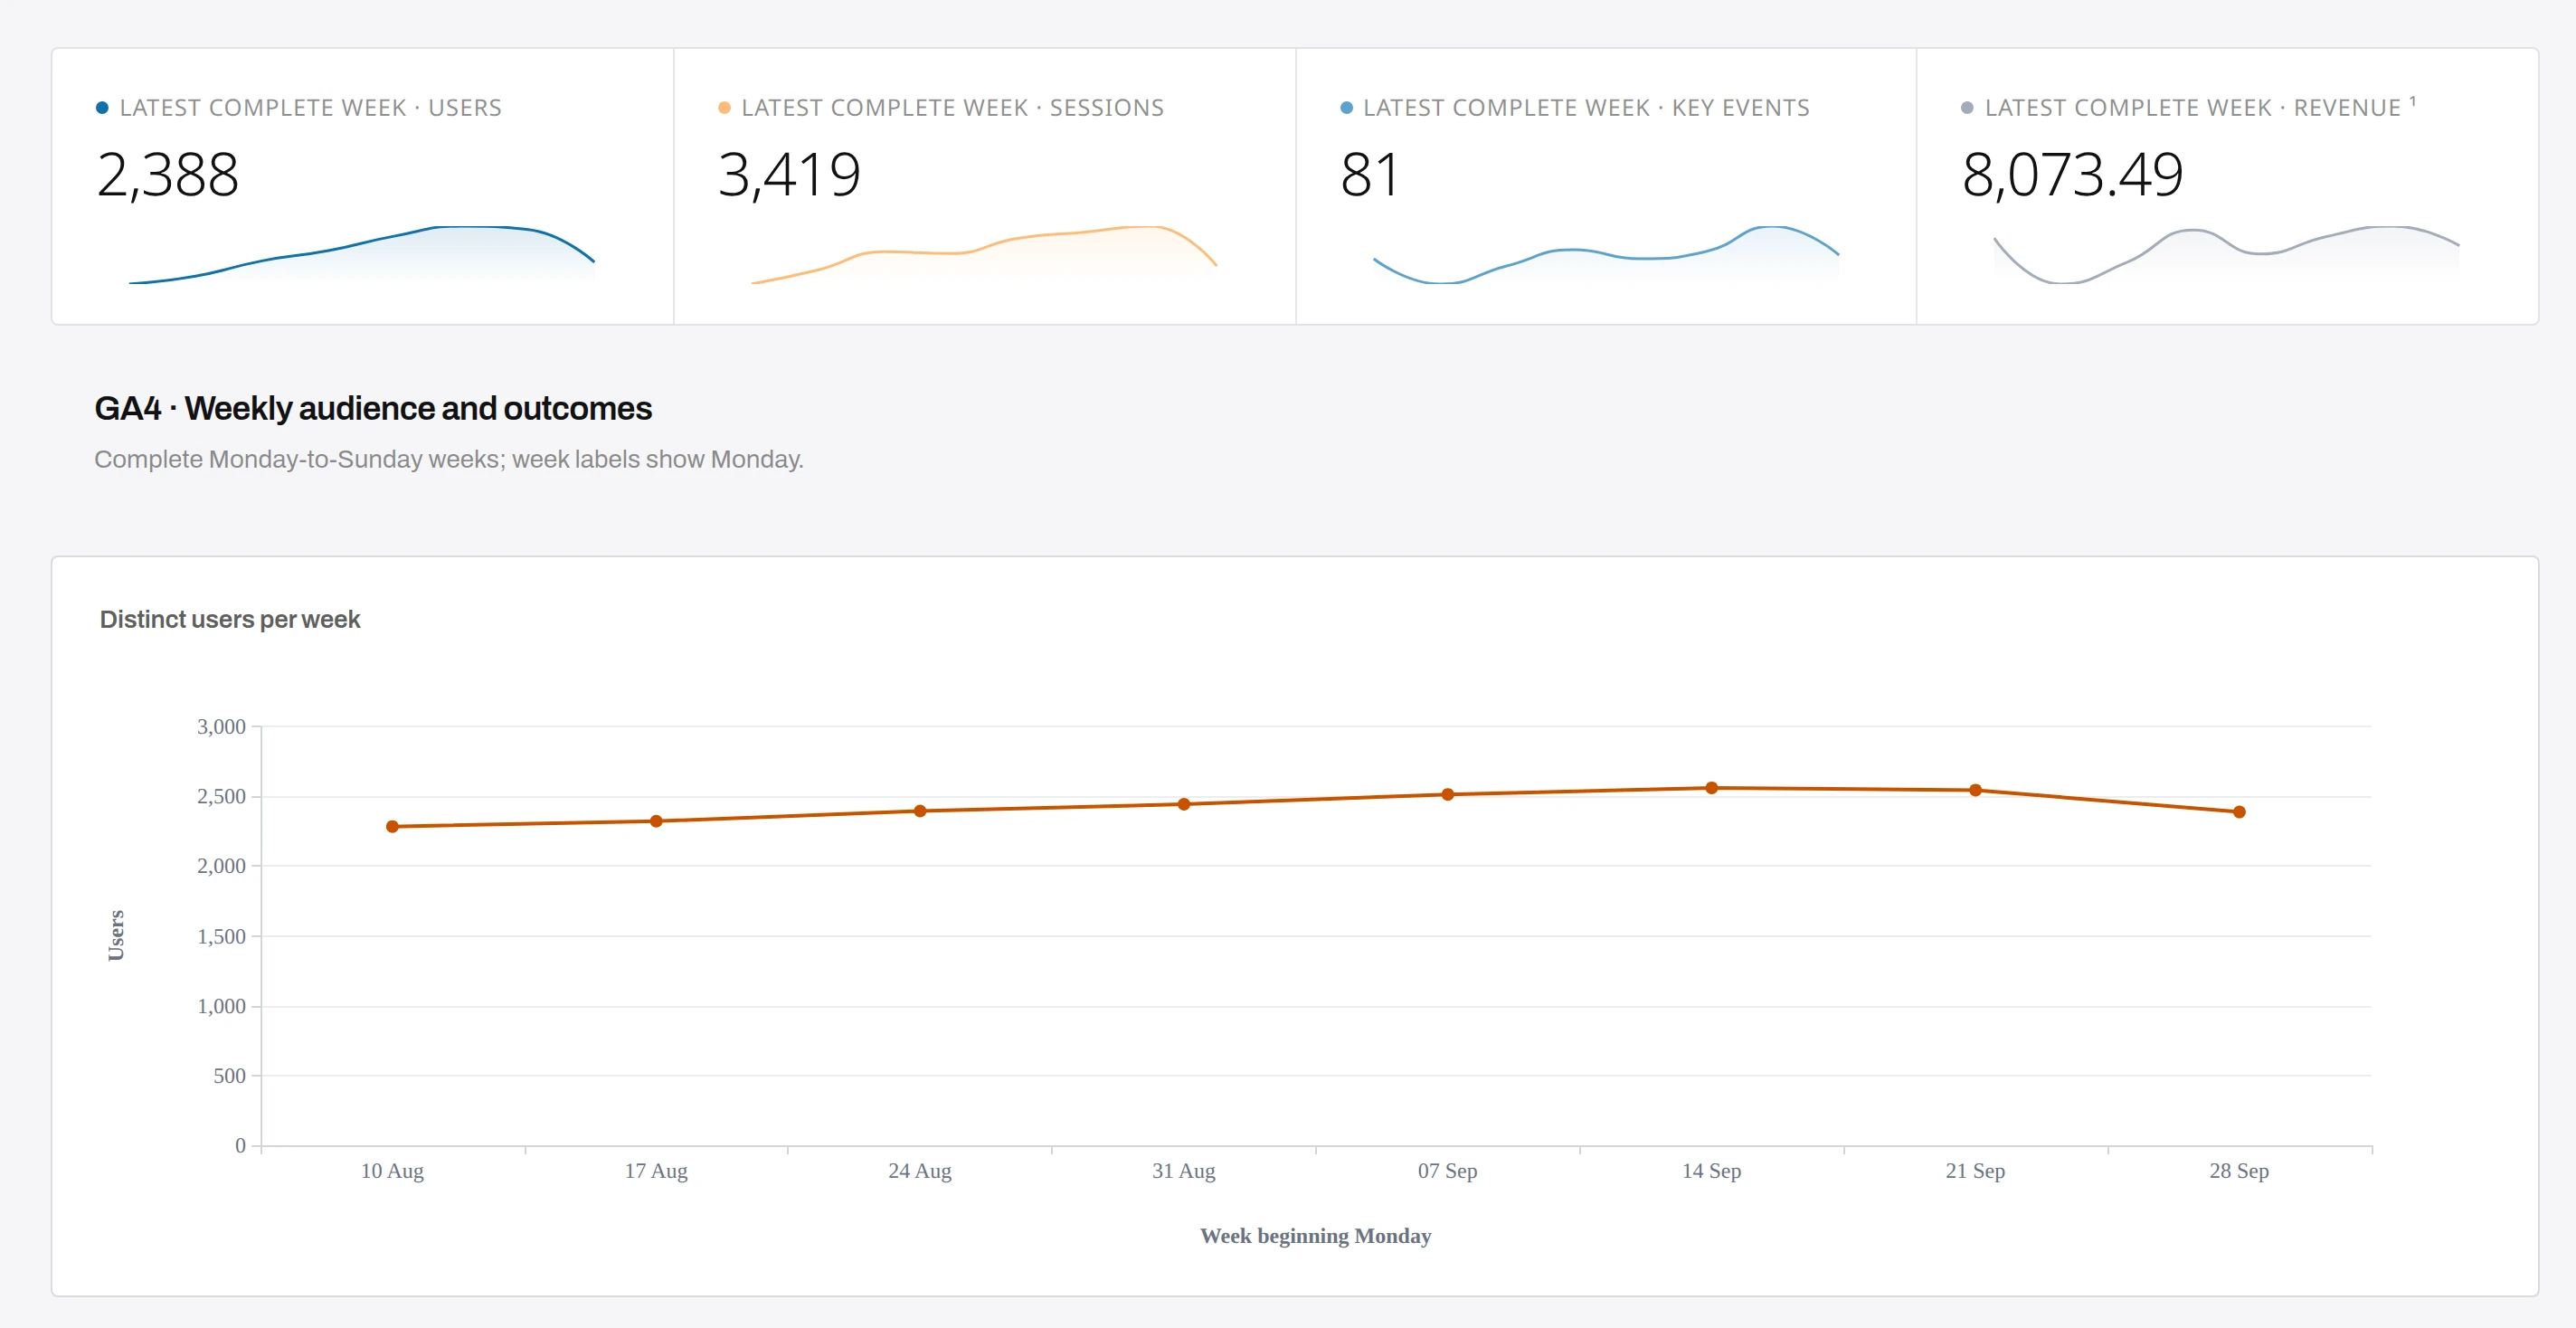
Result — Anomaly first checked that every source had all seven days in each week. It then built an 11-card dashboard, Weekly Marketing Report · 10 Aug–4 Oct 2026. The latest complete week is on top: 2,388 users, 3,419 sessions, 81 key events and 8,073.49 in revenue. Below are the GA4 weekly trend, Google Ads by campaign, Search Console by week, and the queries behind the change.
Tip — Ask for layout and format changes in plain words. We asked for one decimal place on average position, thousands separators on revenue, and the queries sorted so the biggest drops come first.
Check each number before it goes out
A weekly report is only useful if the numbers mean the same thing every week. Check the query behind the headline numbers once, before you schedule anything.
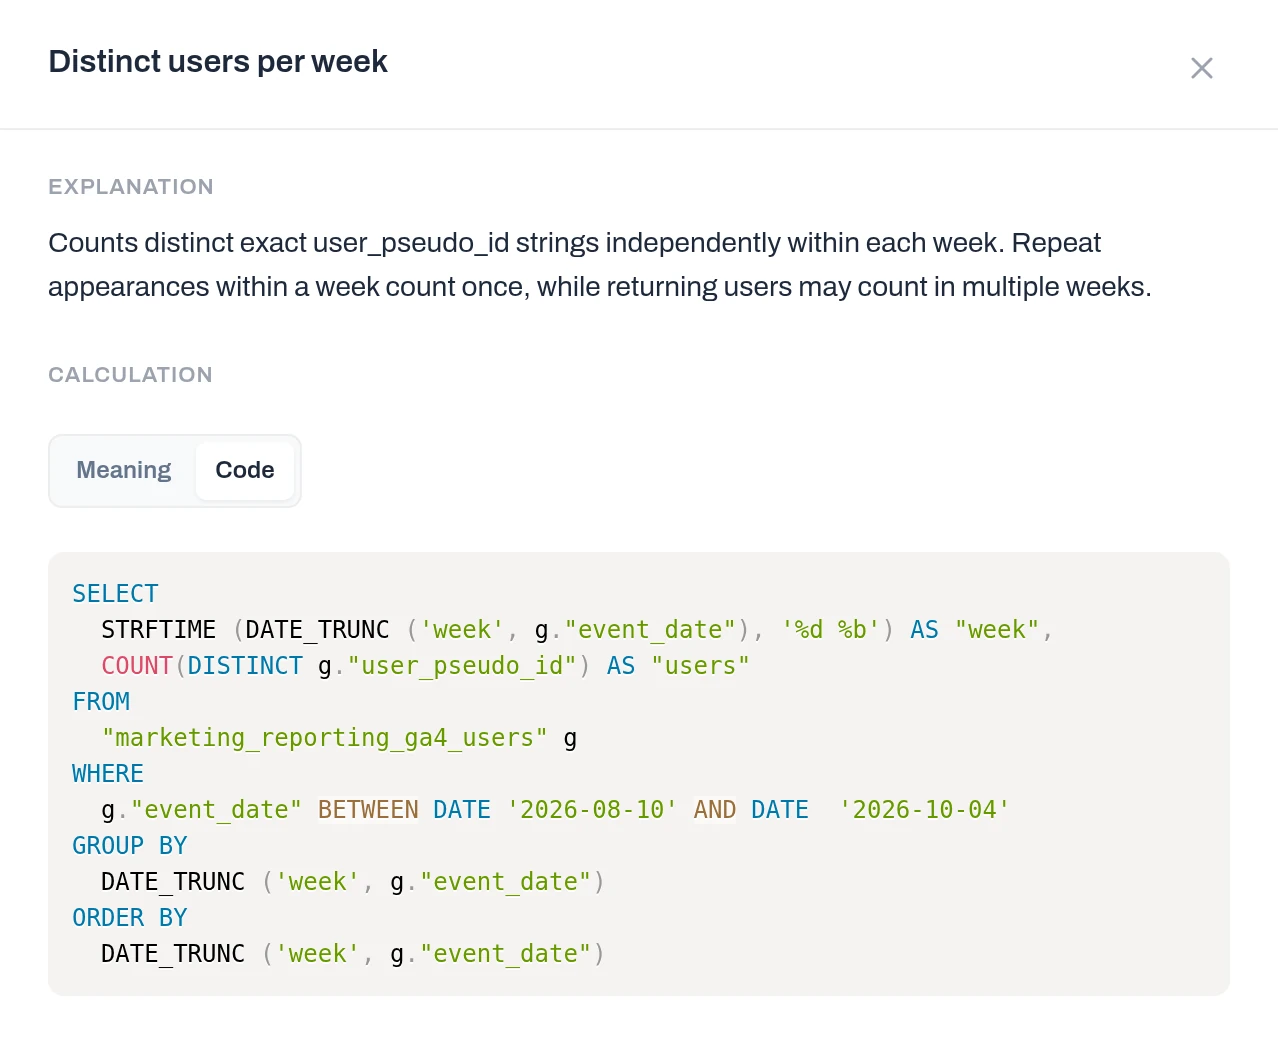
- 1.On the Distinct users per week tile, open View calculation. Read the explanation, then switch to Code to see the query. View data shows the rows behind a number.
- 2.Ask Anomaly to compare weekly users with the sum of daily users:
Definitions check: for each complete week from 10 Aug to 4 Oct 2026, compare weekly users counted as distinct user_pseudo_id in that week with the sum of the seven daily distinct-user counts. Show a table with week beginning, distinct weekly users, sum of daily users, the difference and the percentage overstatement, plus a total row for the eight weeks. Also tell me how many distinct users there were across all eight weeks combined.
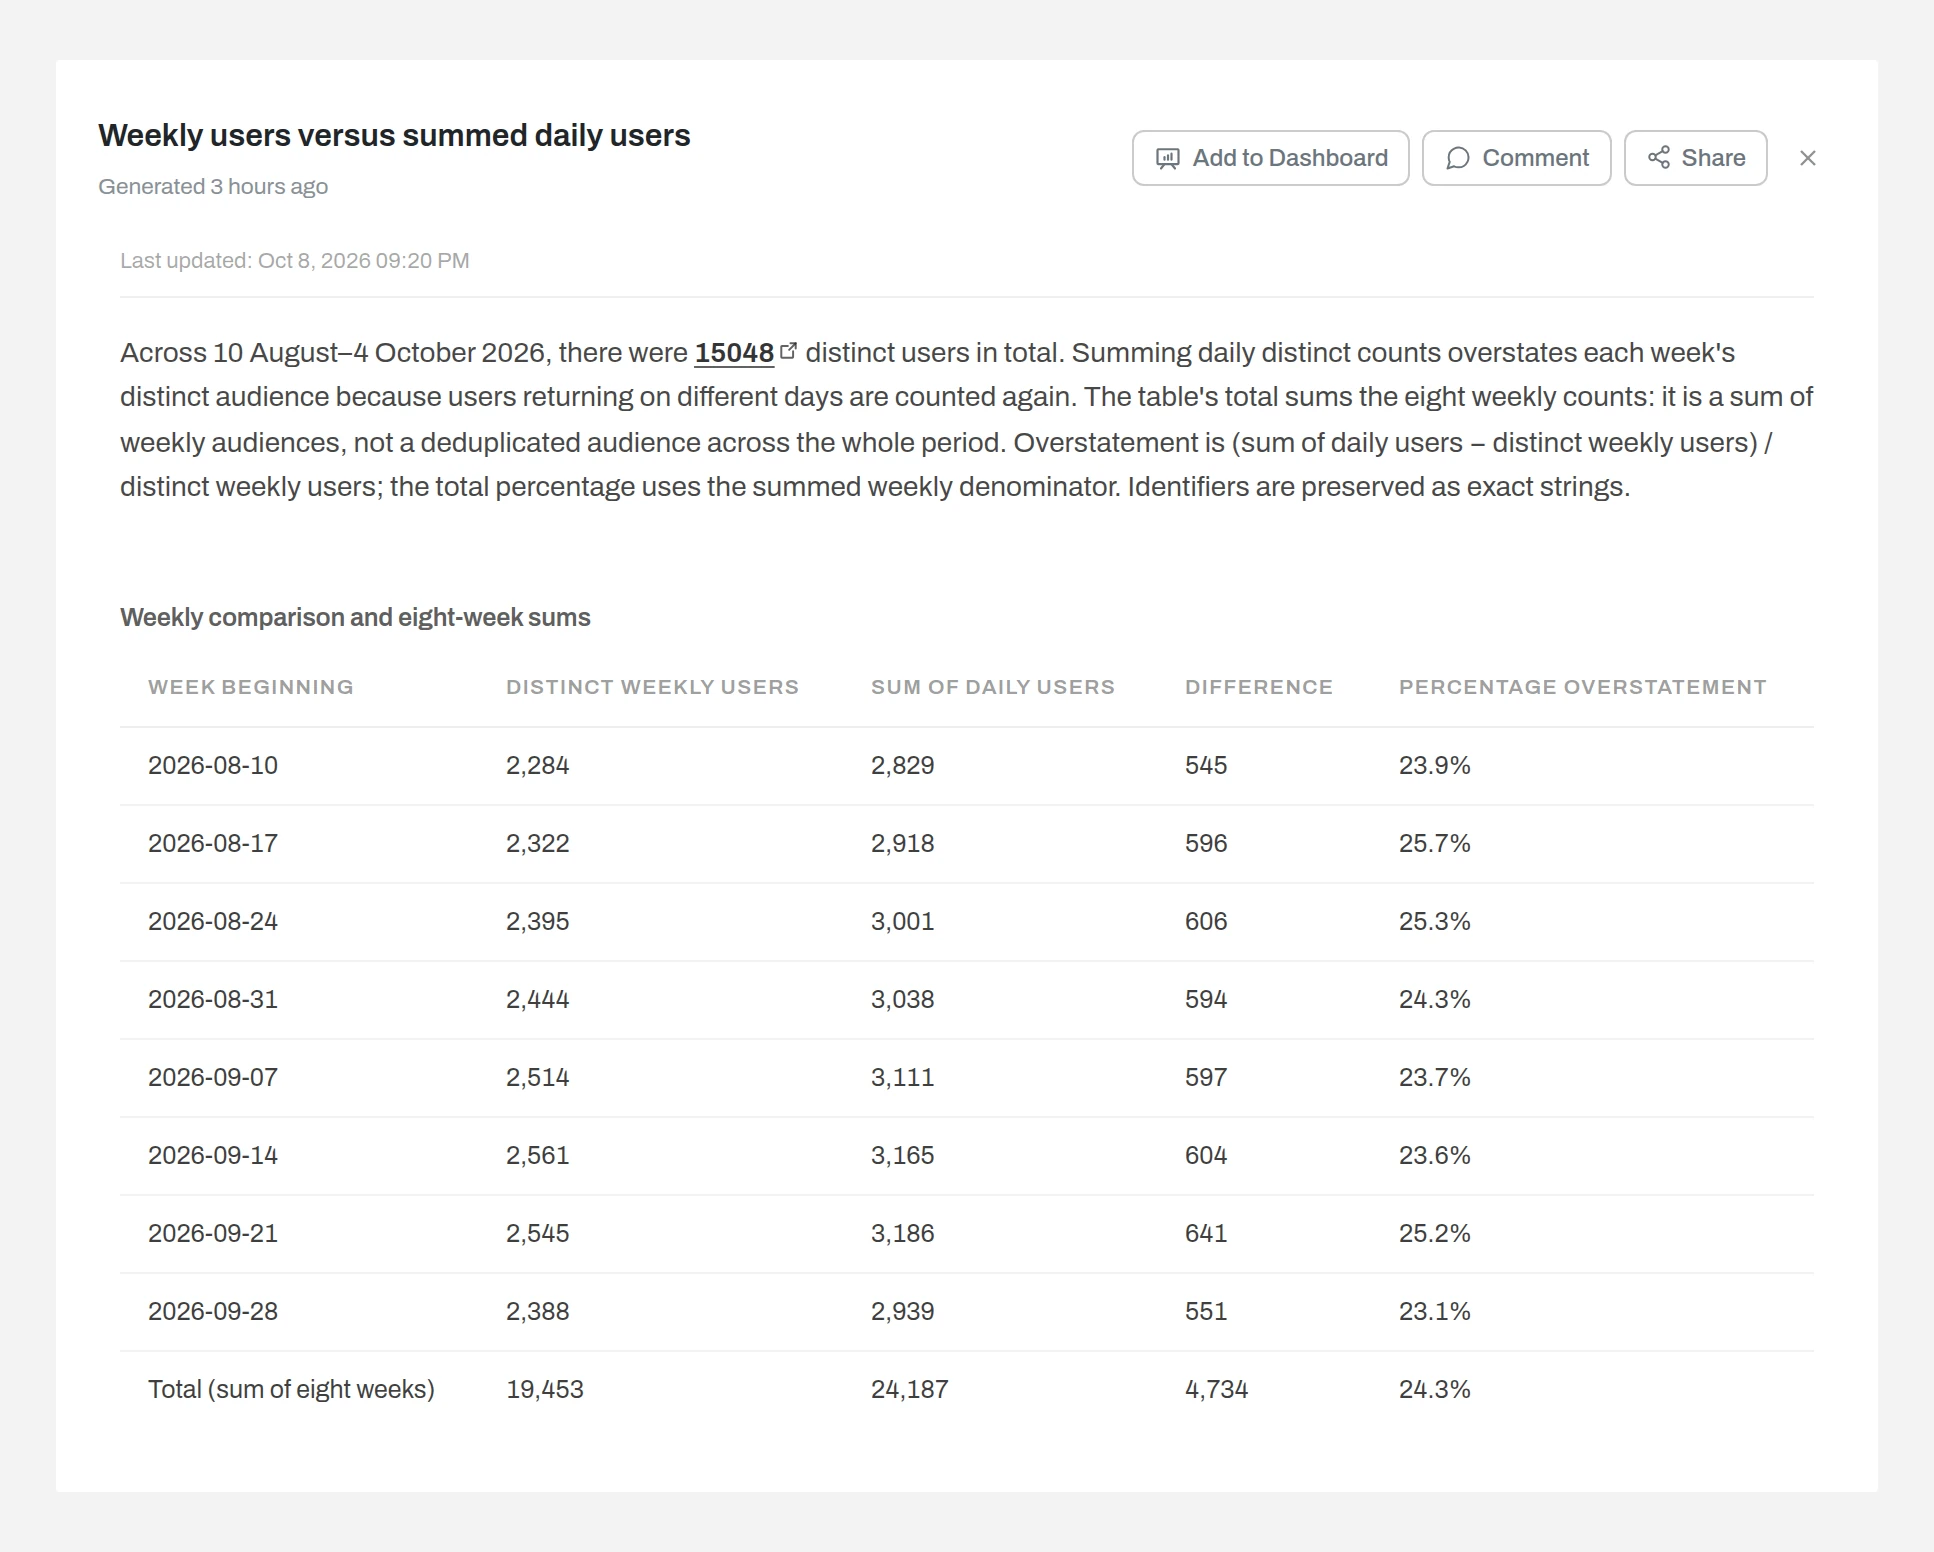
Result — Adding up daily users overstated weekly users by 24.3% over the eight weeks: 24,187 against 19,453. Each week was off by 23.1% to 25.7%. Adding the eight weekly counts is wrong too: only 15,048 different people visited in the period.
- 3.To have the whole dashboard rechecked against the source tables, ask:
Verify the Weekly Marketing Report dashboard: independently recheck every tile against the three source tables and list what you checked and anything that needs correcting.
Result — Anomaly’s verifier recomputed the headline numbers, weekly series, campaign totals and all 18 query comparisons. It passed the dashboard and said what it could not check: how the charts look on screen.
Warning — Never add daily users, or weekly users, together. A returning visitor is counted once per day or week, so the sum is always too high.
Schedule it, and send only when something happens
Schedule the dashboard as a report. You write what it covers, when it runs and when it should be sent, in plain words.
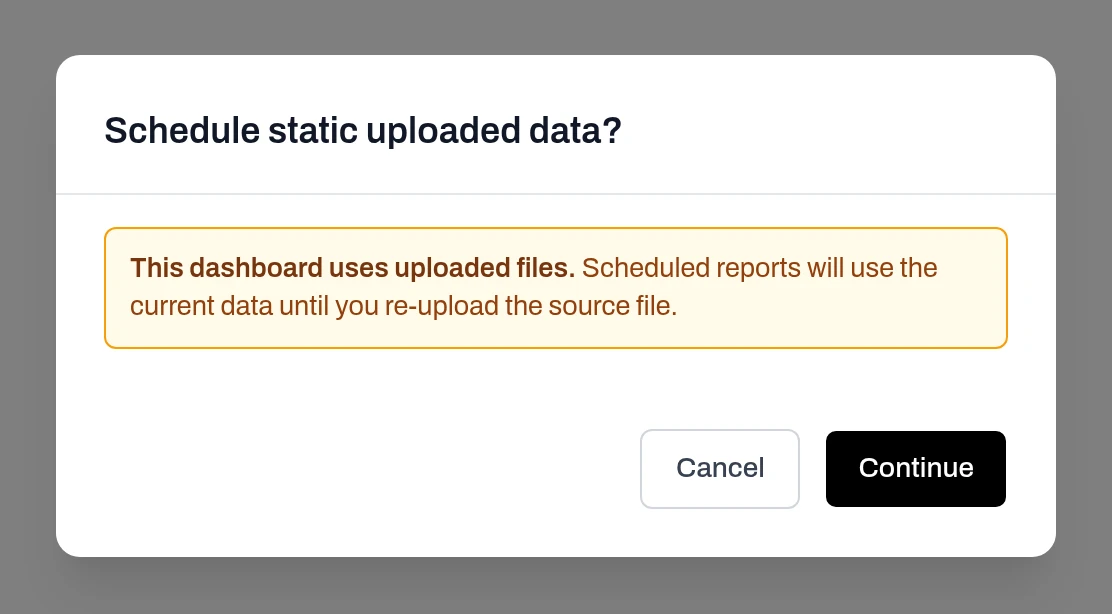
- 1.On the dashboard, select Schedule. If the dashboard uses uploaded files, Anomaly reminds you that the report reuses them until you upload new ones. Select Continue.
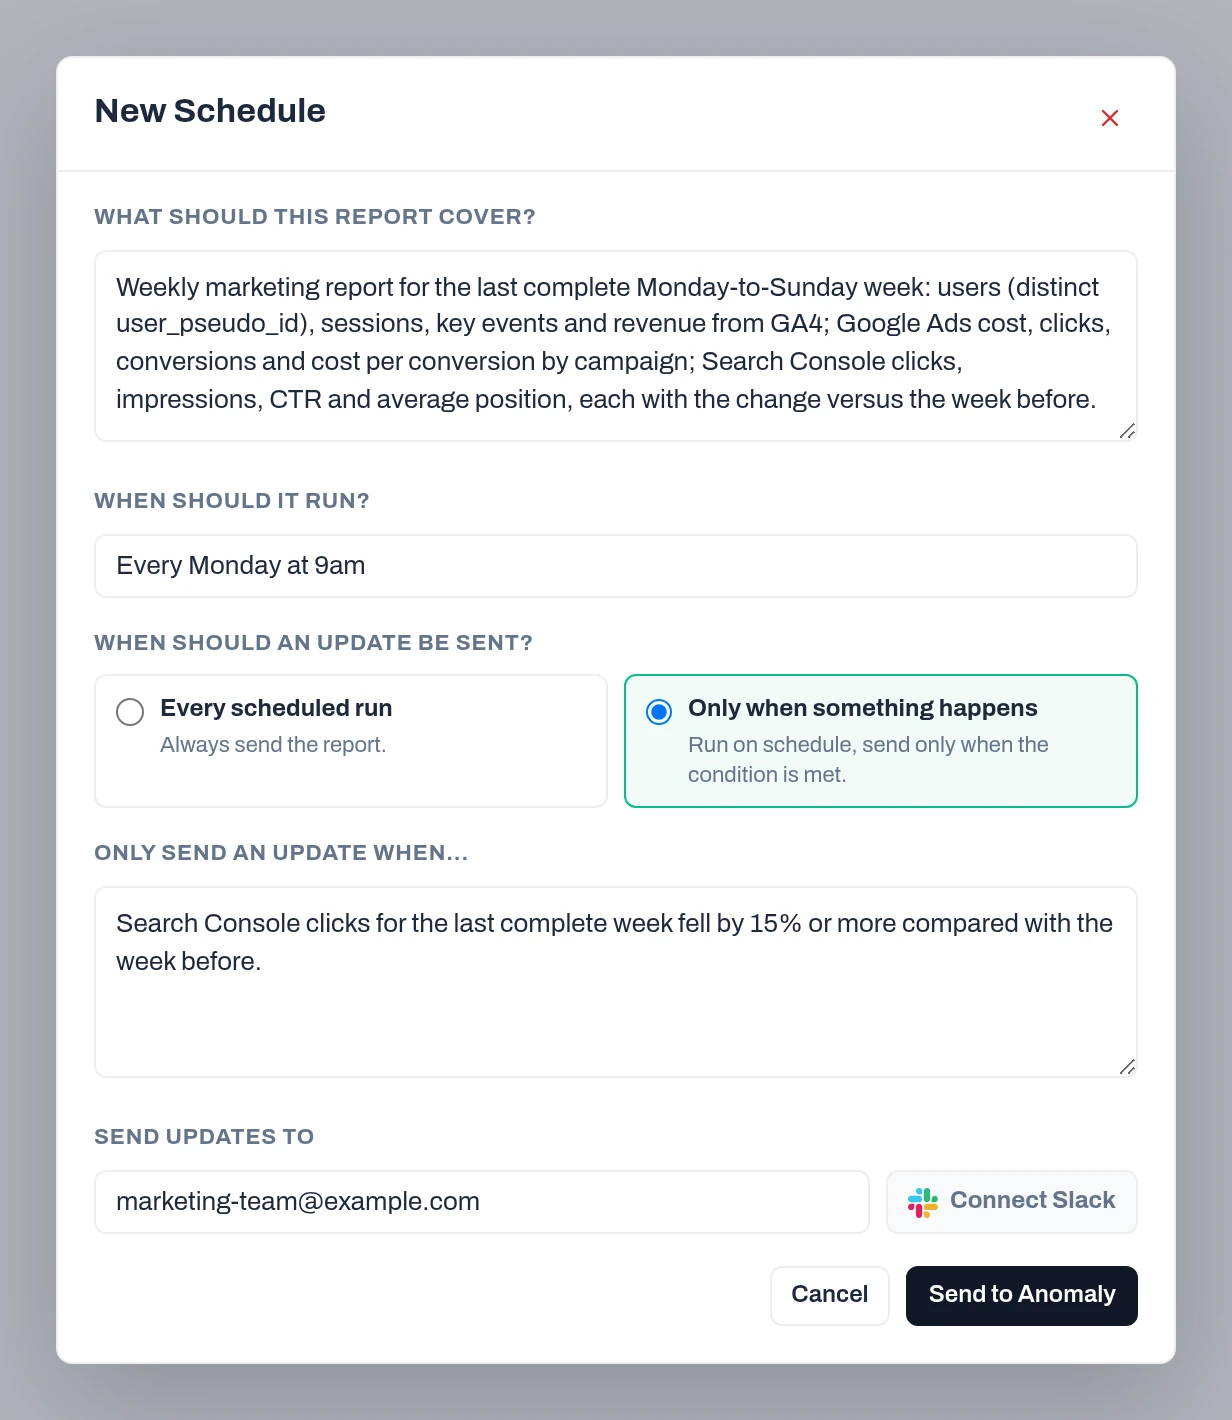
- 2.Under What should this report cover?, describe the report.
- 3.Under When should it run?, type Every Monday at 9am.
- 4.Under When should an update be sent?, choose Only when something happens and write the condition.
- 5.Under Send updates to, add email addresses, or select Connect Slack to post to a channel. Then select Send to Anomaly.
Weekly marketing report for the last complete Monday-to-Sunday week: users (distinct user_pseudo_id), sessions, key events and revenue from GA4; Google Ads cost, clicks, conversions and cost per conversion by campaign; Search Console clicks, impressions, CTR and average position, each with the change versus the week before.
Search Console clicks for the last complete week fell by 15% or more compared with the week before.
Result — Before switching the schedule on, Anomaly asked which week a Monday run should assess. The week that ended the day before can still be loading, which could fake a 15% drop.
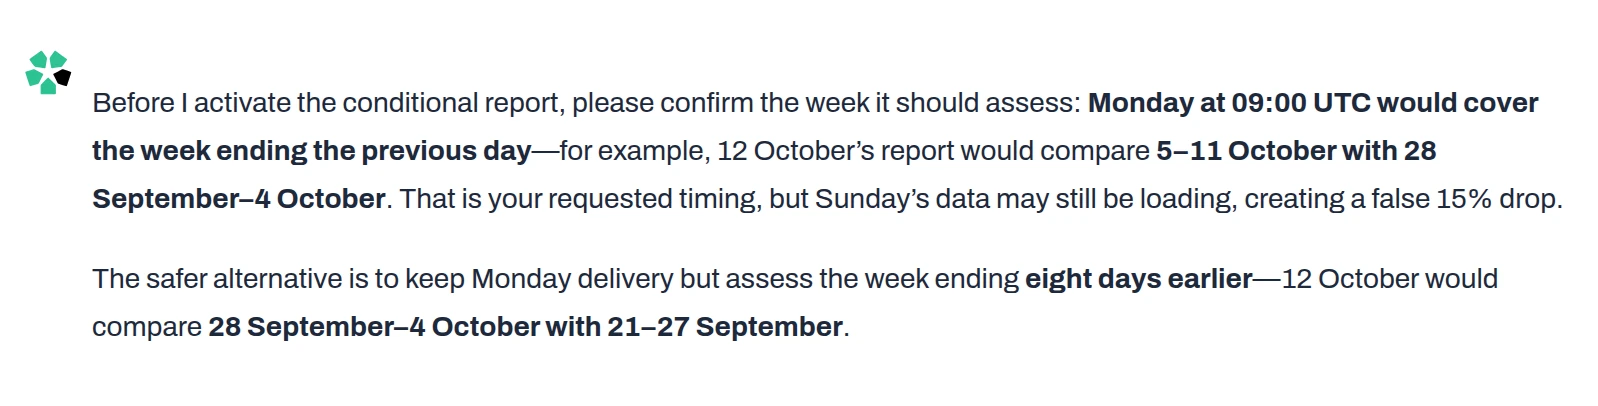
We chose the safer option: each Monday run assesses the week that ended eight days earlier. The first run, on 12 October, compares 28 September–4 October with 21–27 September. To try it, select Test the scheduled report now. Ours ran on a Thursday and sent nothing, because the condition was not met.
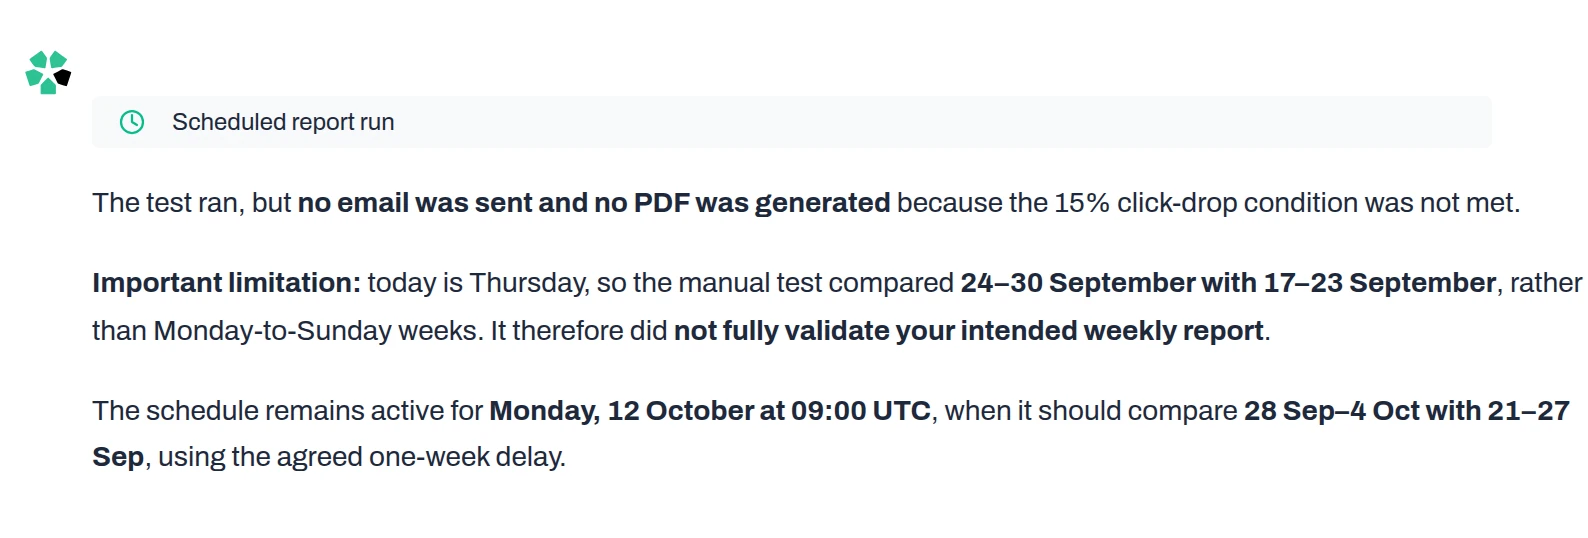
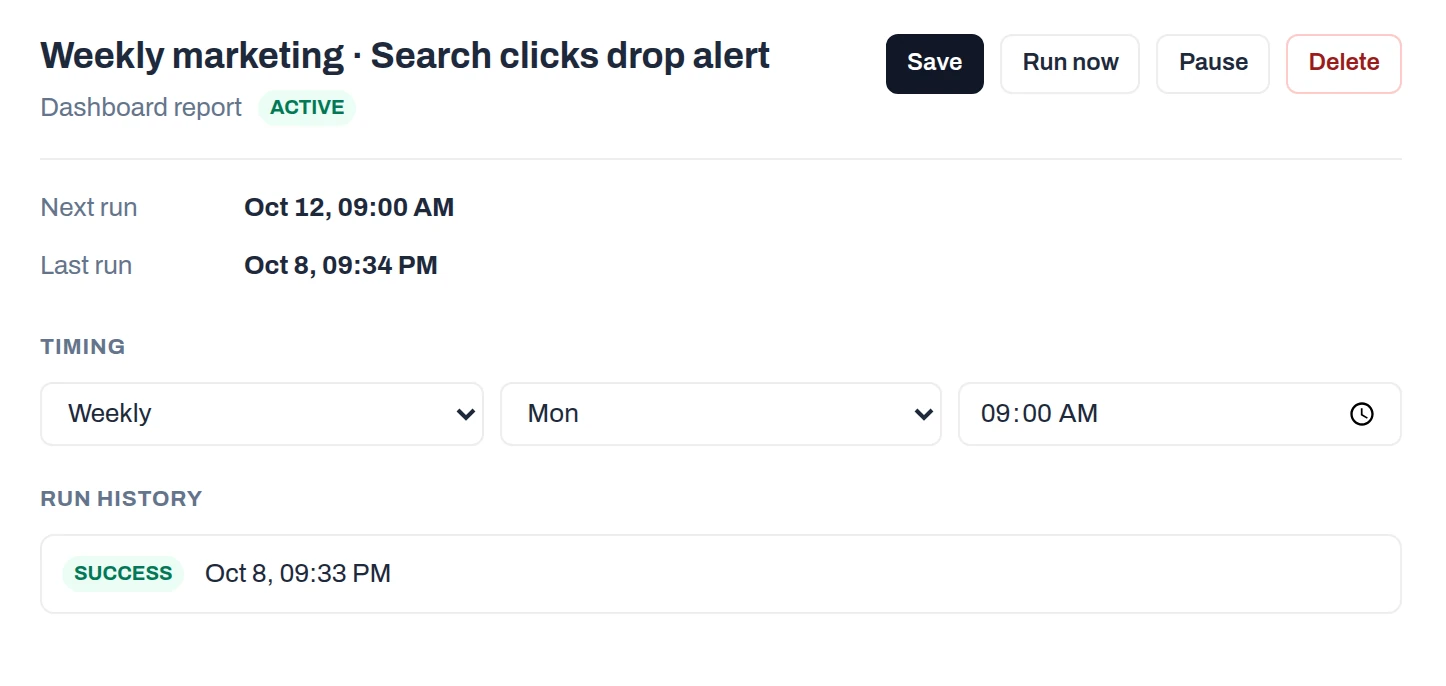
Result — The schedule Weekly marketing · Search clicks drop alert is active, with its next run on Monday 12 October at 09:00 UTC. We used email only.
See what arrives
On each run, Anomaly refreshes connected sources, checks the condition, and either sends the report or stays silent. When it sends, the email carries the dashboard as a PDF with a short written summary.
- 1.To see whether the next run will send, ask Anomaly to check the coming Monday’s condition.
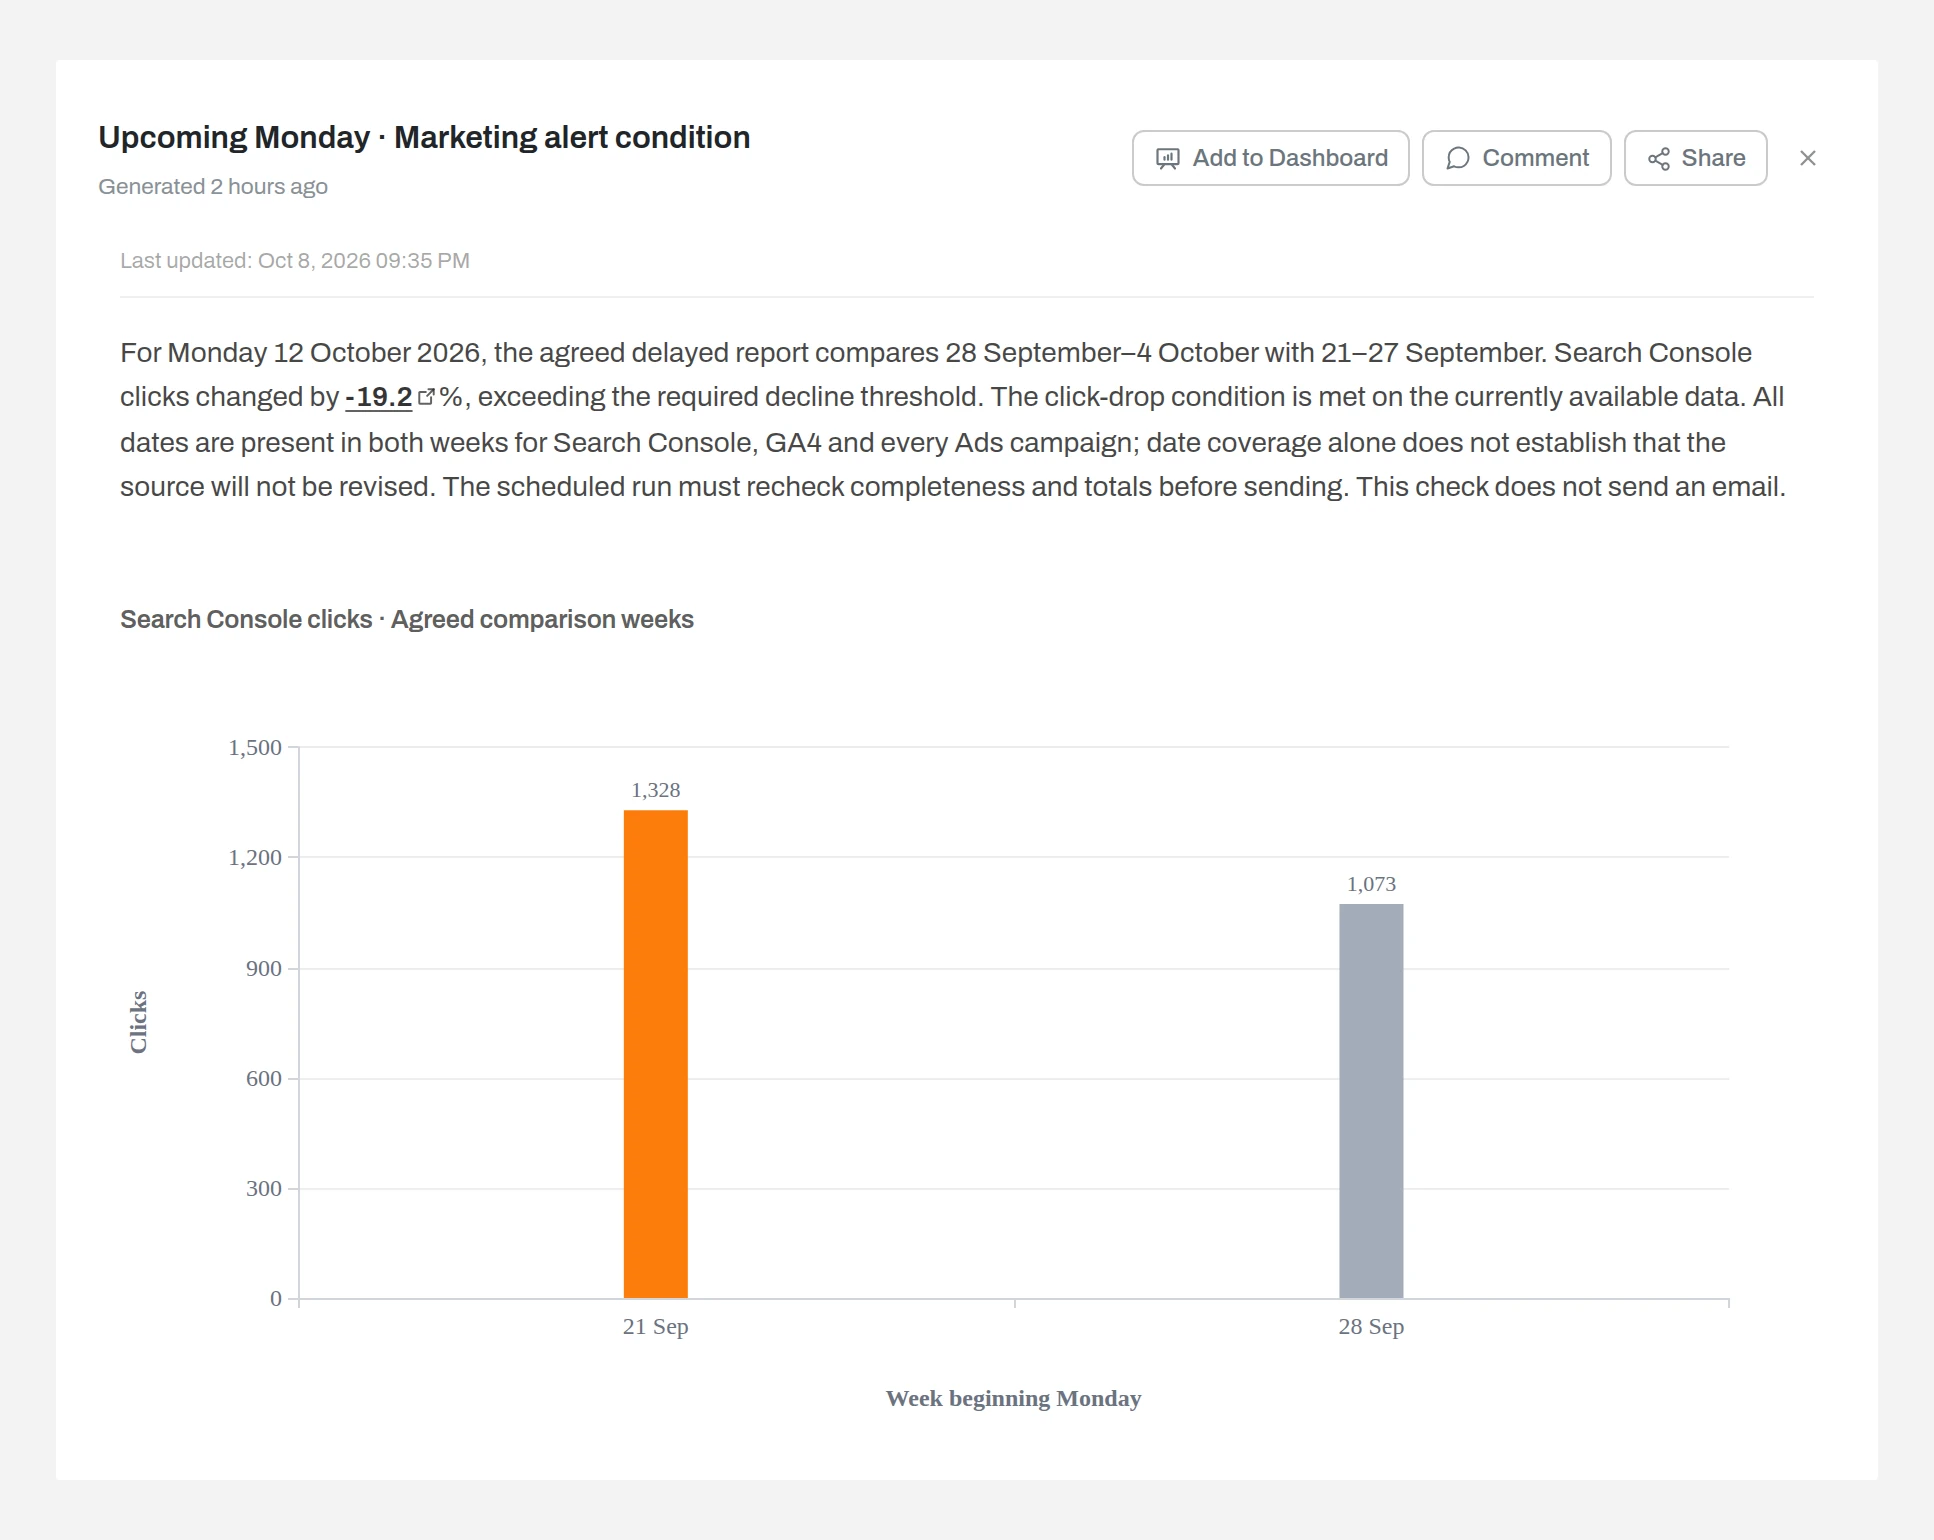
Result — For the 12 October run, the condition is met: Search Console clicks fell from 1,328 to 1,073, down 19.2%. The check only reports; the scheduled run sends the report, after checking the data again.
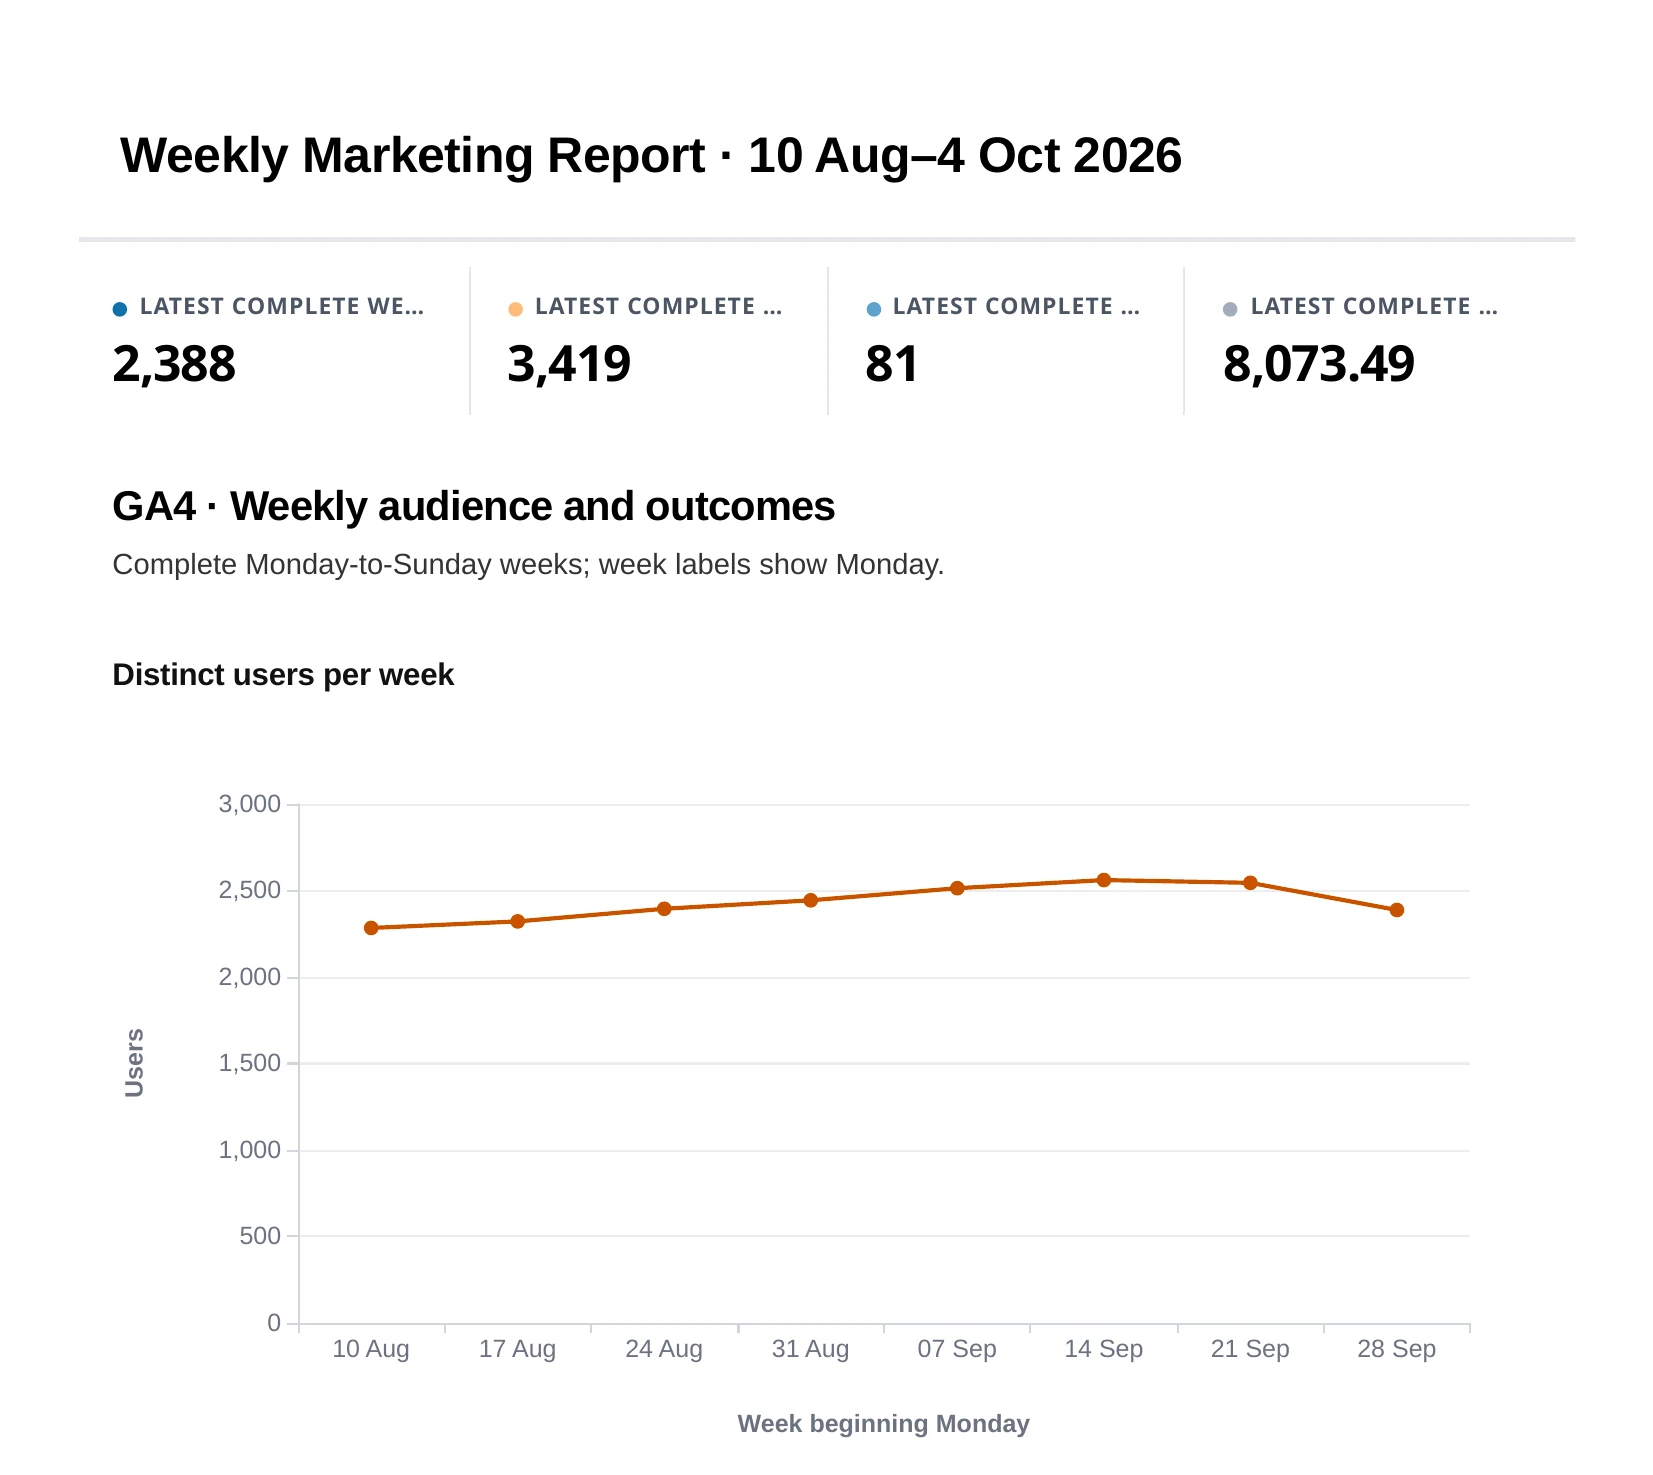
This is page 1 of the same dashboard exported as a PDF: the four headline numbers, the weekly users chart and, further down, the weekly table. The 7-page file has a small “Analyzed using Anomaly AI” footer. Our first scheduled email is due on 12 October, so this guide shows the export rather than a received email.
Share the report
Send people the PDF, or give them the interactive dashboard through a share link.
- 1.On the dashboard, select Share, open Links and select Create share link.
- 2.Keep Password protected, the default, and send the access code separately. Or choose Anyone with the link.
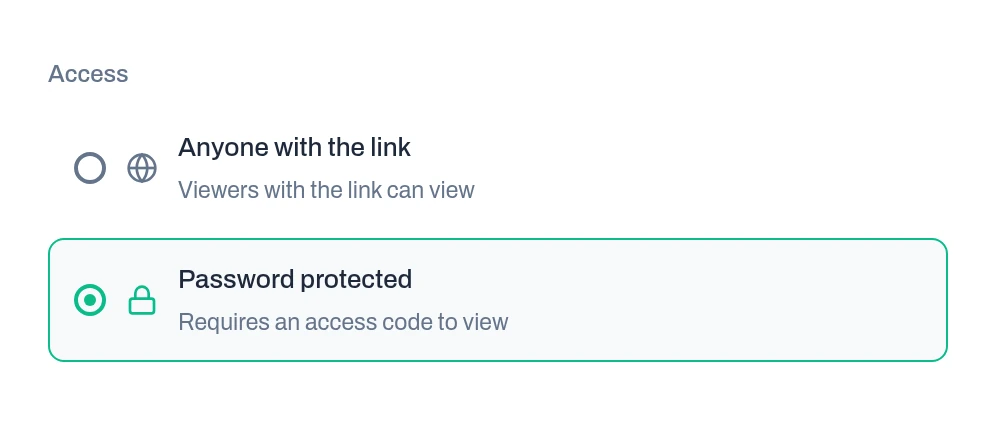
Result — People with the link and the code can view the dashboard. Select Stop sharing to turn the link off.
Troubleshooting
Weekly users are higher than GA4 shows for the same week.
The report is adding daily user counts together. Ask for users counted as distinct user_pseudo_id within the exact week, then open View calculation to confirm the query uses COUNT(DISTINCT …) per week.
Monday’s report shows a drop that is gone a day later.
The last day was still processing when the report ran. Google says GA4 can take 24–48 hours to process data. Report on complete weeks only, or assess the week that ended eight days before the run, as in step 4.
The scheduled report shows the same numbers every week.
The dashboard is built on uploaded files, which stay as uploaded. Upload the new exports before the run, or connect GA4, Google Ads and Search Console so each run refreshes the data first.
A test run sent nothing.
With “Only when something happens”, nothing is sent when the condition is not met. A manual test in the middle of the week also compares rolling seven-day windows, not Monday-to-Sunday weeks.
There is no Schedule button.
Scheduled reports are part of the Pro plan and above. Building and checking the dashboard works on every plan.
FAQ
Can I automate a GA4 report without uploading exports every week?
Yes. Connect the GA4 property with Google sign-in instead of uploading an export; connected sources refresh before each scheduled run. Uploaded files stay as uploaded until you replace them.
Can the weekly report go to Slack instead of email?
Yes. In the schedule form, connect Slack to post the update to a channel, add email addresses, or use both. Our run used email only.
How do I send the report only when a number changes?
Choose “Only when something happens” in the schedule form and write the condition in plain words, such as a 15% week-over-week drop in Search Console clicks. Every scheduled run checks the condition and sends the report only when it is met.
Is this real-time monitoring?
No. The report runs on its schedule, daily, weekly or monthly, and checks the data at that time. It is not a live or always-on monitor.
What does it cost to run?
Scheduling is on Pro ($25 a month, or $20 a month billed yearly) and above. Work is charged in credits: building, checking and scheduling this report used 17.6 credits in our run, including 3.5 for one test run that refreshed the data and sent nothing.
What's next
- —See what else the marketing reporting software does, from other channels to monthly reports.
- —When the report shows a change, use campaign performance analysis to work out which campaign caused it.
- —To decide which charts the dashboard should hold, read the marketing analytics dashboard guide.
- —If your report lives in Google Sheets, follow how to send a weekly PDF from Google Sheets.
Ready to Try AI Data Analysis?
Experience AI-driven data analysis with your own spreadsheets and datasets. Generate insights and dashboards in minutes with our AI data analyst.