Campaign Performance Analysis: What to Scale, Fix or Cut
A worked campaign performance analysis on a downloadable Google Ads and GA4 sample: make the two sources agree, compare CPA and ROAS, test for noise, and decide what to scale, fix or cut.
Abhinav Pandey··13 min read
Quick answer — campaign performance analysis
Campaign performance analysis compares what each campaign cost with what it produced, against a target set before launch, so you can decide what to scale, fix or cut. First make Google Ads and GA4 count the same thing. Then compare cost per conversion and ROAS by campaign, check each gap against normal weekly noise, and write down the decision. The worked example reconciles both sources, number by number, on a sample you can download.
It is Sunday night and the budget meeting is on Monday. On the default click-date columns, the Google Ads overview says last week’s return on ad spend (ROAS) fell to 2.48, against 3.73 for the previous twelve weeks. Someone has already suggested pausing the two most expensive campaigns.
This guide shows how to analyze campaign performance before that meeting. The running example is a fictional six-person outdoor-gear store with eight Google Ads campaigns, plus email and paid social, over 13 weeks. Most of the “drop” is incomplete data. One campaign has a real leak, and one that looks expensive is only noise. Every number comes from three synthetic files you can download.
Who this is for: marketers, agency analysts and founders who set ad budgets from Google Ads, GA4 and other exports.
Run in an Anomaly test workspace on 8 October 2026. AI-assisted draft, fact-checked by [editor, date].
What is campaign performance analysis?
A campaign report says what happened: spend, clicks, conversions. Campaign performance analysis asks whether each campaign earned its budget against the target, whether the difference is real, and what should change. In the example below, the report shows ROAS of 2.48; the analysis decides whether Tents, Display or nothing should lose budget.
Campaign analytics usually means the tracking and tools that collect the numbers. Marketing performance analysis is the wider view across every channel and goal. A marketing campaign analysis, or campaign analysis, is the same job for one campaign or a set.
To measure campaign performance, start from the decision and work back to the metric. ROAS is conversion value divided by spend. Cost per acquisition (CPA) is spend divided by conversions. Click-through rate (CTR) and cost per click (CPC) explain why those moved, but rarely settle a budget question.
Campaign performance metrics and where they come from
Decision
Metric
Source
Is the campaign worth its budget?
ROAS = conversion value ÷ spend
Google Ads, conversion-time columns
Is each sale affordable?
CPA = spend ÷ conversions
Google Ads
Do the clicks reach the site?
Sessions compared with clicks
GA4 traffic acquisition, by session campaign
Does the platform’s count hold up elsewhere?
GA4 purchases compared with Ads conversions
GA4 and Google Ads, joined on campaign ID
Is the difference real?
Conversions in the window (at least 30)
Both
Is a cut even needed?
Pacing: spend to date against budget
Google Ads and your budget plan
Compare each metric with your own target and history before any outside benchmark.
Before you start
A target and a minimum: here, ROAS 3.0 and no decision on fewer than 30 conversions.
Google Ads by day, split by network and device, with the “by conv. time” conversion columns.
GA4 traffic acquisition by session campaign, with the campaign ID, sessions, purchases and revenue.
Other networks and email, UTM-tagged: connect Meta or TikTok Ads directly, or use CSV exports as this sample does. Keep every source on one date range and time zone.
Download the three-file sample
Synthetic sample data for 29 June to 27 September 2026: Google Ads by day (4,095 rows), GA4 by session campaign (1,274 rows), and email and paid social (364 rows). The README lists the planted effects and an answer key for every number in this guide.
01Step 1: Write the target and the rules before you look
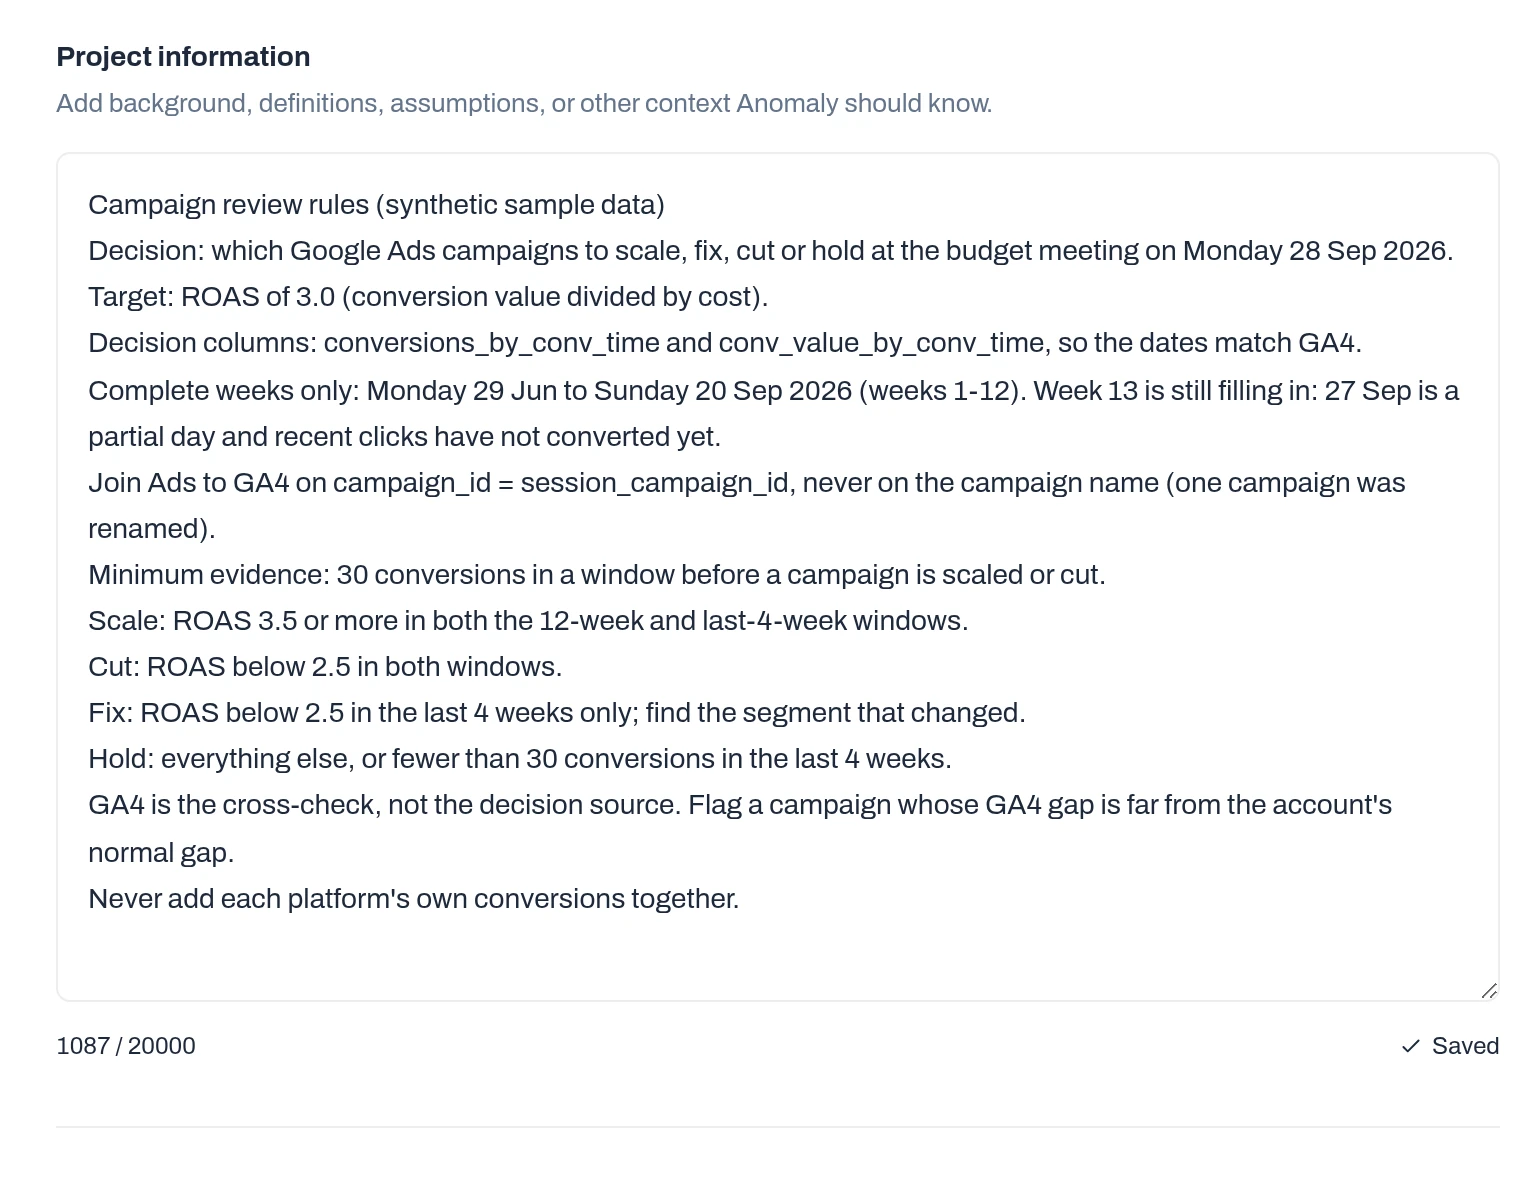
Decide what counts as success before you see the numbers, or every result can be argued either way. We saved these rules as project knowledge, so every later answer used them.
Decision columns. Use the conversion-time columns, so conversions sit on the day they happened, as they do in GA4.
Window. Complete Monday-to-Sunday weeks only: 29 June to 20 September, weeks 1 to 12.
Scale when ROAS is 3.5 or more in both the 12-week and the last-4-week windows.
Cut when ROAS is below 2.5 in both windows. Fix when it is below 2.5 in the last four weeks only.
Hold everything else, and anything with fewer than 30 conversions in the last four weeks.
The review rules, saved before any analysis. First-party Anomaly screenshot; synthetic sample data.
02Step 2: Put the sources in one project and check the joins
Upload exports, or connect a source such as GA4. First-party Anomaly screenshot.
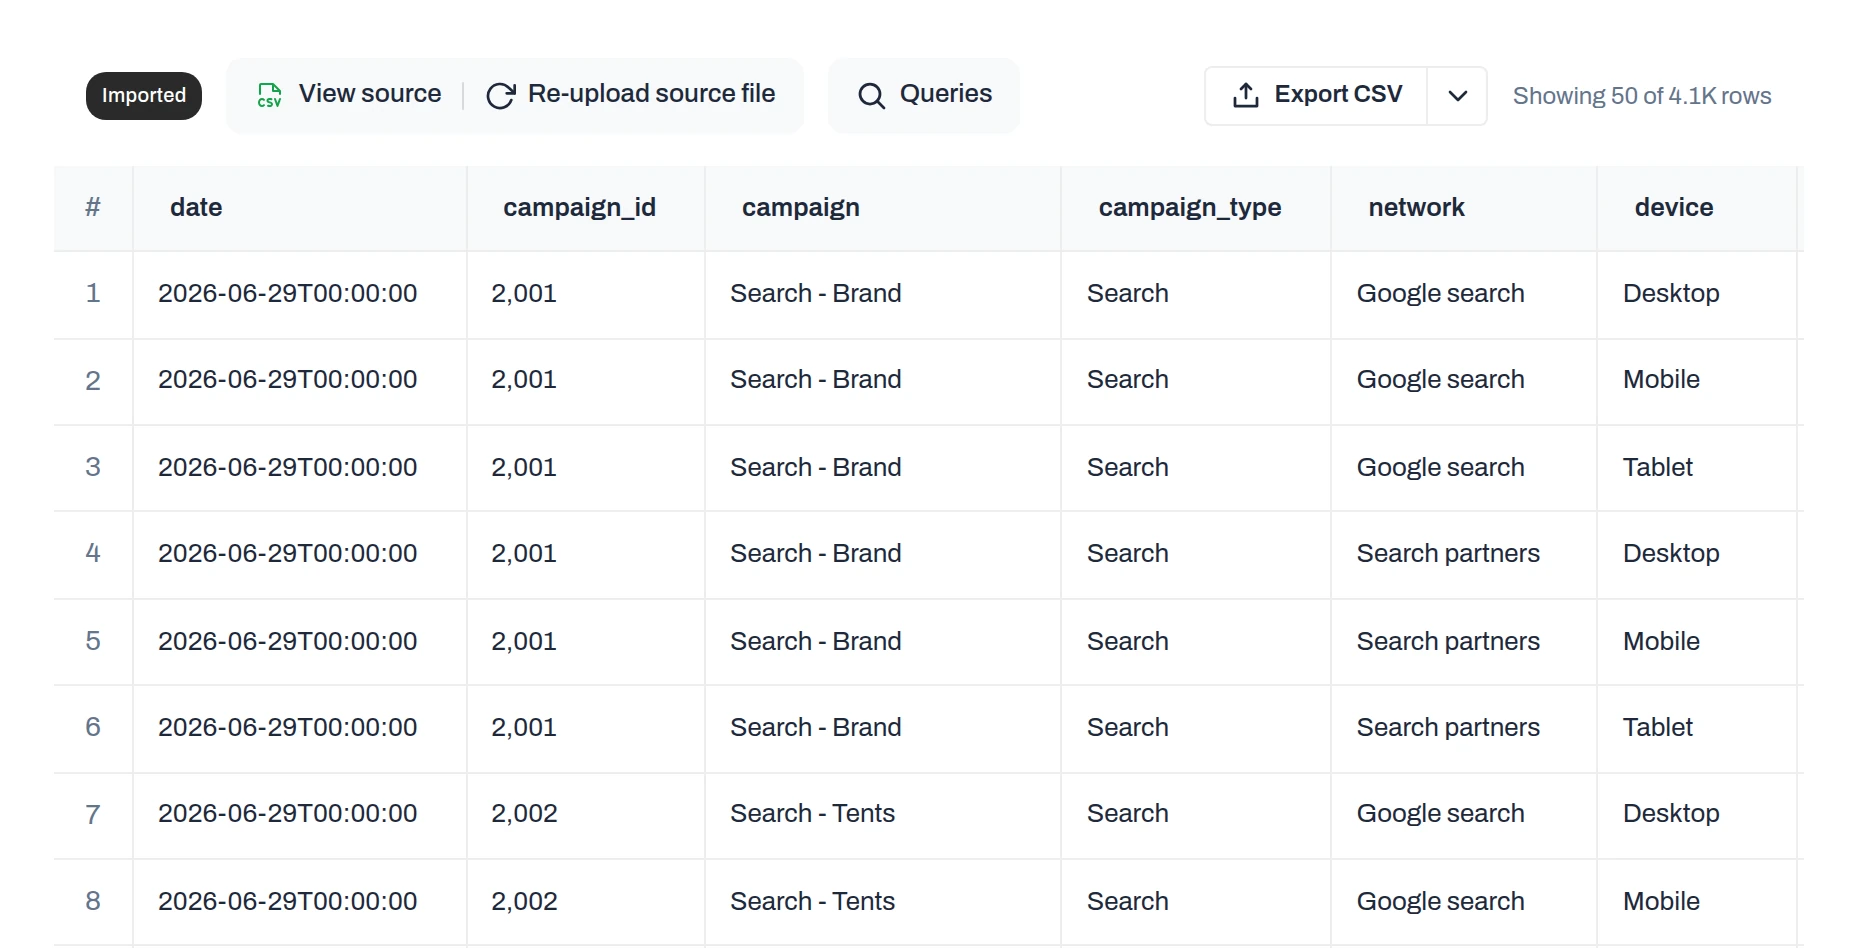
Google Ads export: one row per campaign, network and device per day. First-party Anomaly screenshot; synthetic sample data.
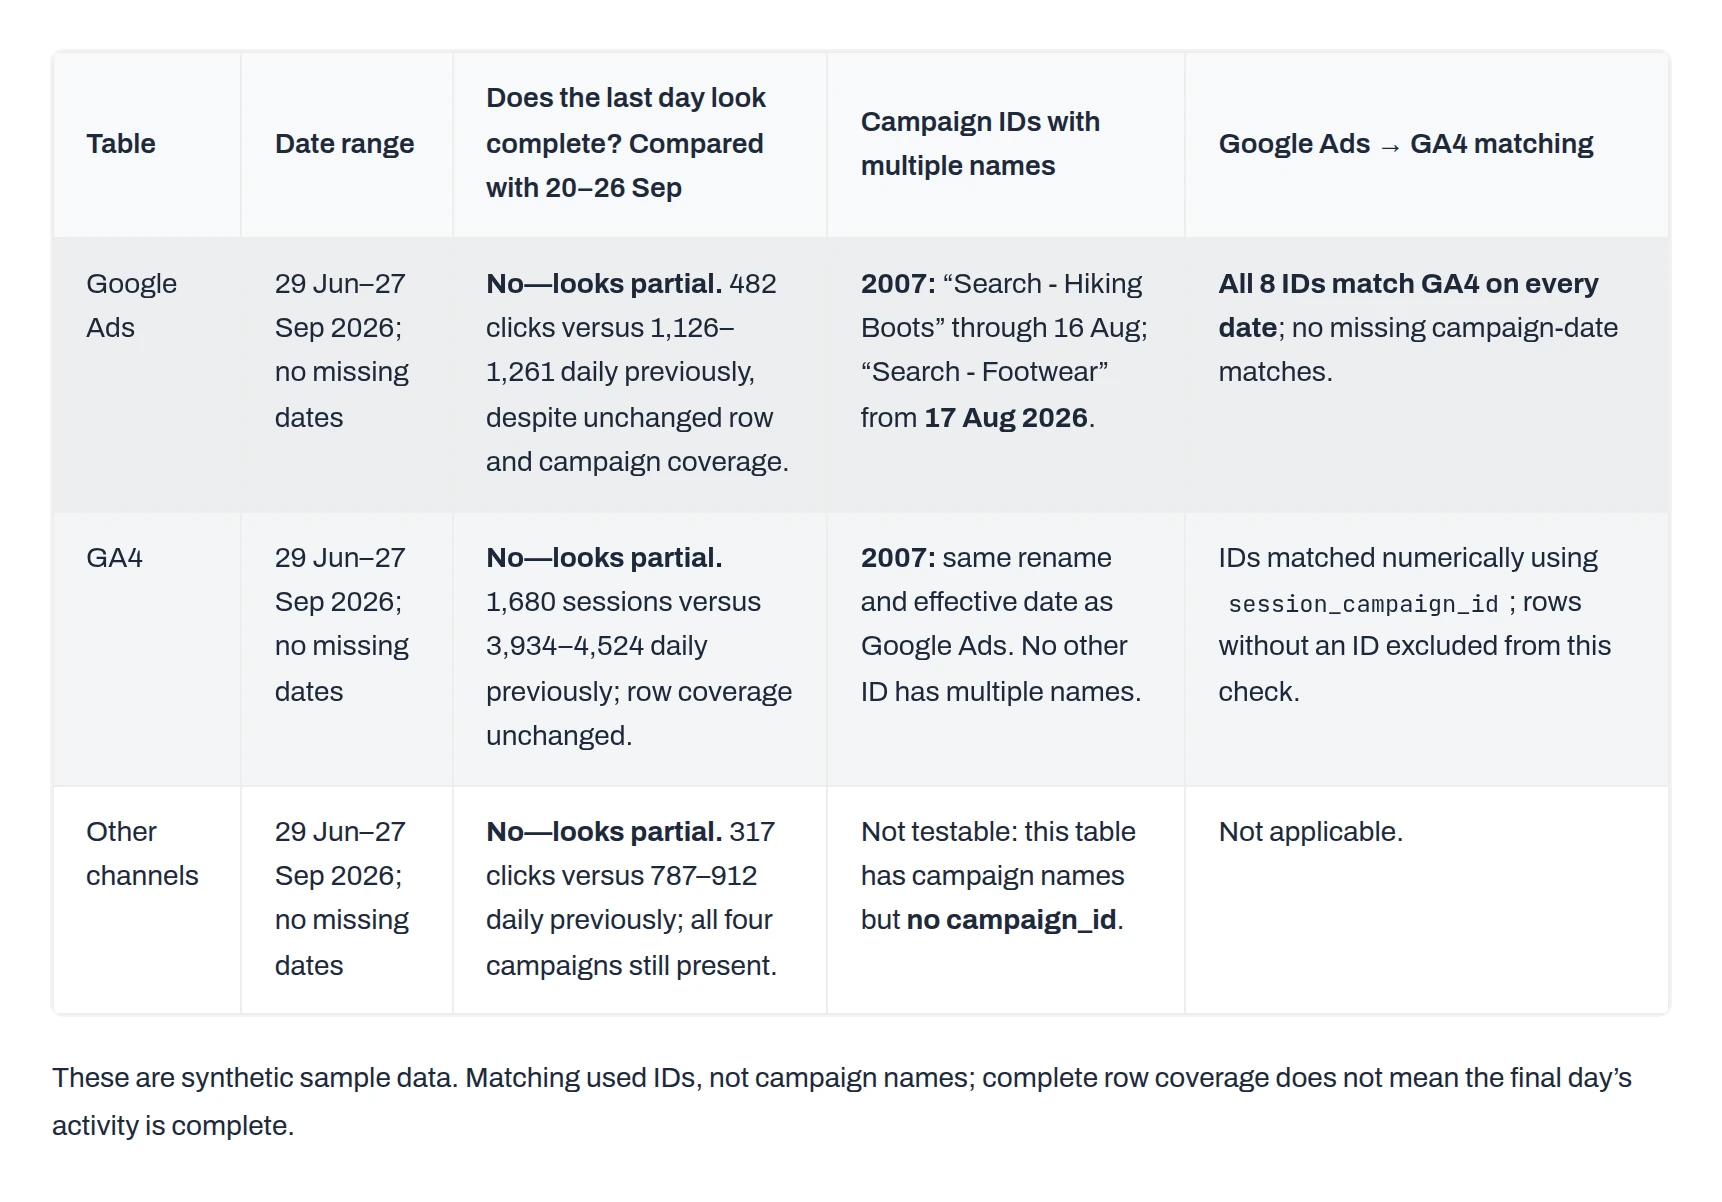
Before any analysis, check the data itself. Are email and paid-social links UTM-tagged, so GA4 can match each visit to its campaign? Is the last day complete? Did a campaign change its name? Does every Google Ads campaign ID appear in GA4?
The checks catch a partial last day and a renamed campaign. First-party Anomaly screenshot; synthetic sample data.
Result: every email and paid-social row in GA4 has a campaign name. 27 September holds only 482 Google Ads clicks, against 1,126 to 1,261 on each of the seven days before, because the export was pulled mid-morning. Campaign 2007 was renamed from “Search - Hiking Boots” to “Search - Footwear” on 17 August, so a join on name would split it in two. Joined on ID, all eight campaigns match GA4 on every date.
03Step 3: Make GA4 and Google Ads agree
The two tools never show the same conversion count, and Google explains why. Google Ads “reports conversions on the ad impression date,” while other tools “attribute them to the conversion date” (Google Ads Help). In this export, that date is the click date. Conversions can arrive up to 90 days after the click. Google Ads counts clicks; GA4 counts sessions (Google Ads Help). GA4 also credits each purchase under its own attribution model, so some go to email or organic visits (Analytics Help).
Google suggests the “Conversions (by conv. time)” column for comparisons with GA4. It moves each conversion to the day it happened. What is left is the attribution and measurement gap.
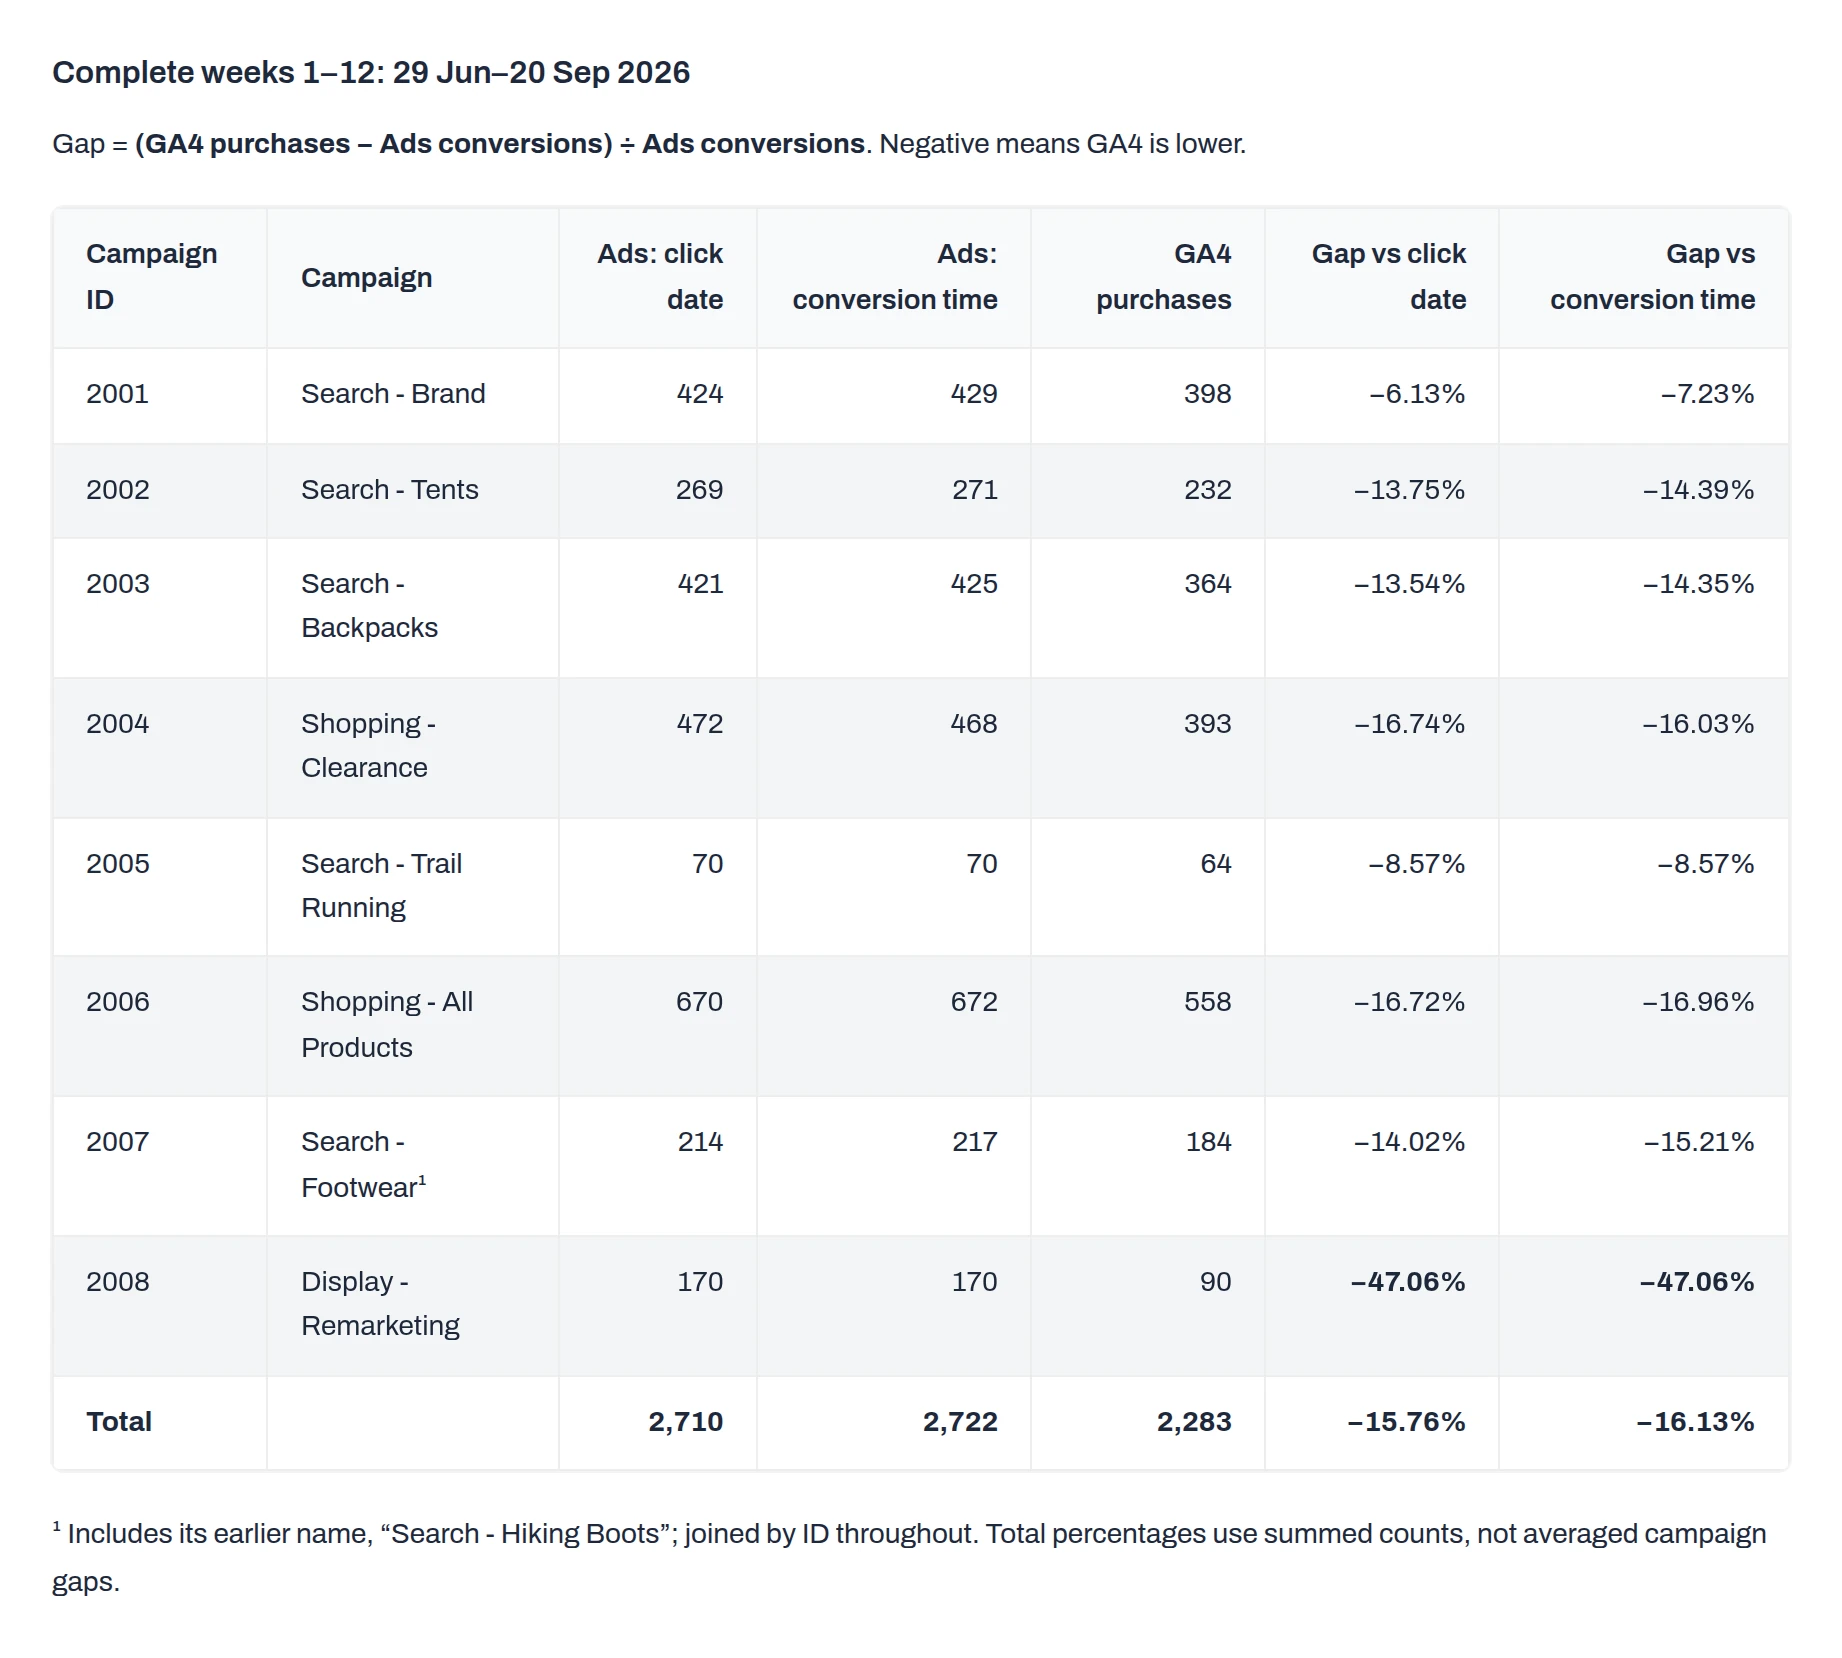
GA4 records 16.1% fewer purchases over twelve weeks; Display remarketing is the outlier at 47.1%. First-party Anomaly screenshot; synthetic sample data.
Result: over the twelve complete weeks, Google Ads reports 2,710 conversions by click date and 2,722 by conversion time. GA4 records 2,283 purchases: 15.8% and 16.1% fewer. The dating matters only in the incomplete week: 136 conversions by click date, 187 by conversion time and 156 in GA4. That is why last week’s ROAS looked so bad: recent clicks had not converted yet, and the last day was partial.
The account’s normal gap is about 16%. A campaign far outside it is a tracking question, not a performance answer: Display remarketing is 47.1% lower in GA4. If your GA4 figures also disagree with themselves, see why GA4 channel and medium numbers disagree.
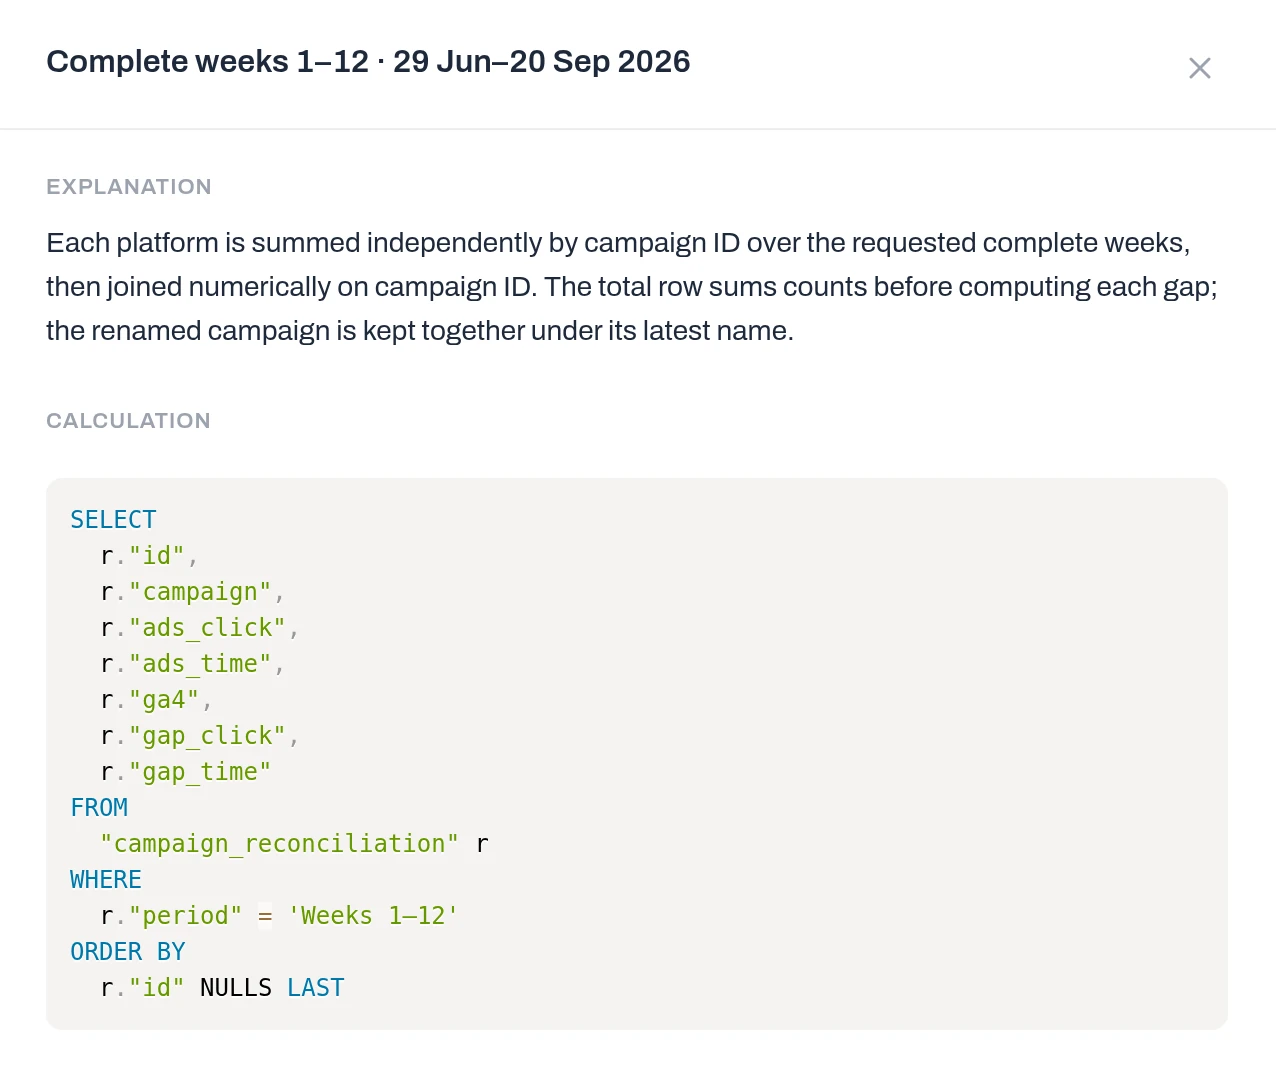
The calculation behind the table: both platforms summed by campaign ID, then joined. First-party Anomaly screenshot; synthetic sample data.
How it was checked: a separate script recomputed every total from the CSV files; all matched, including week 13.
04Step 4: Compare cost per conversion and ROAS by campaign
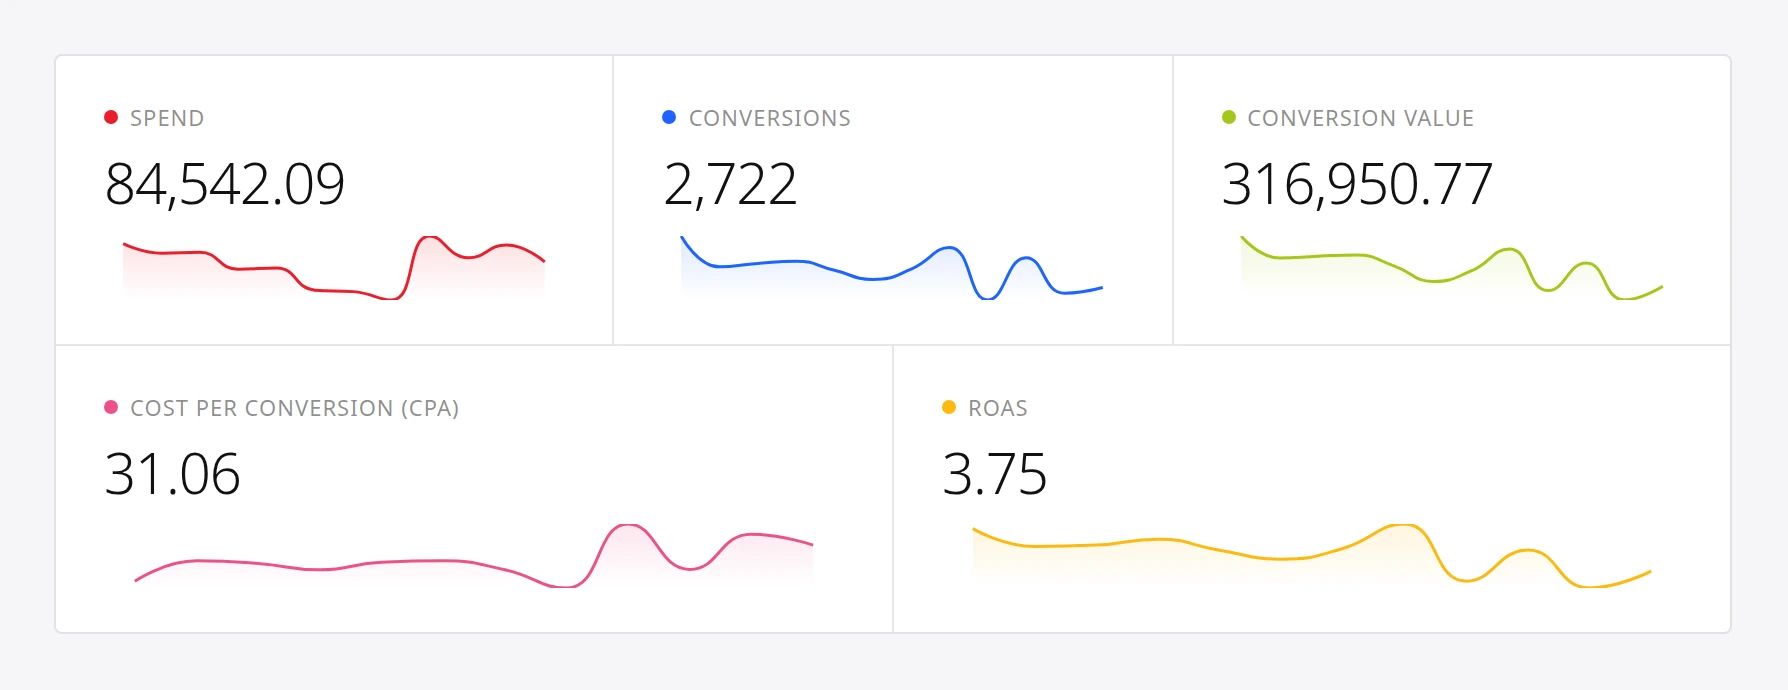
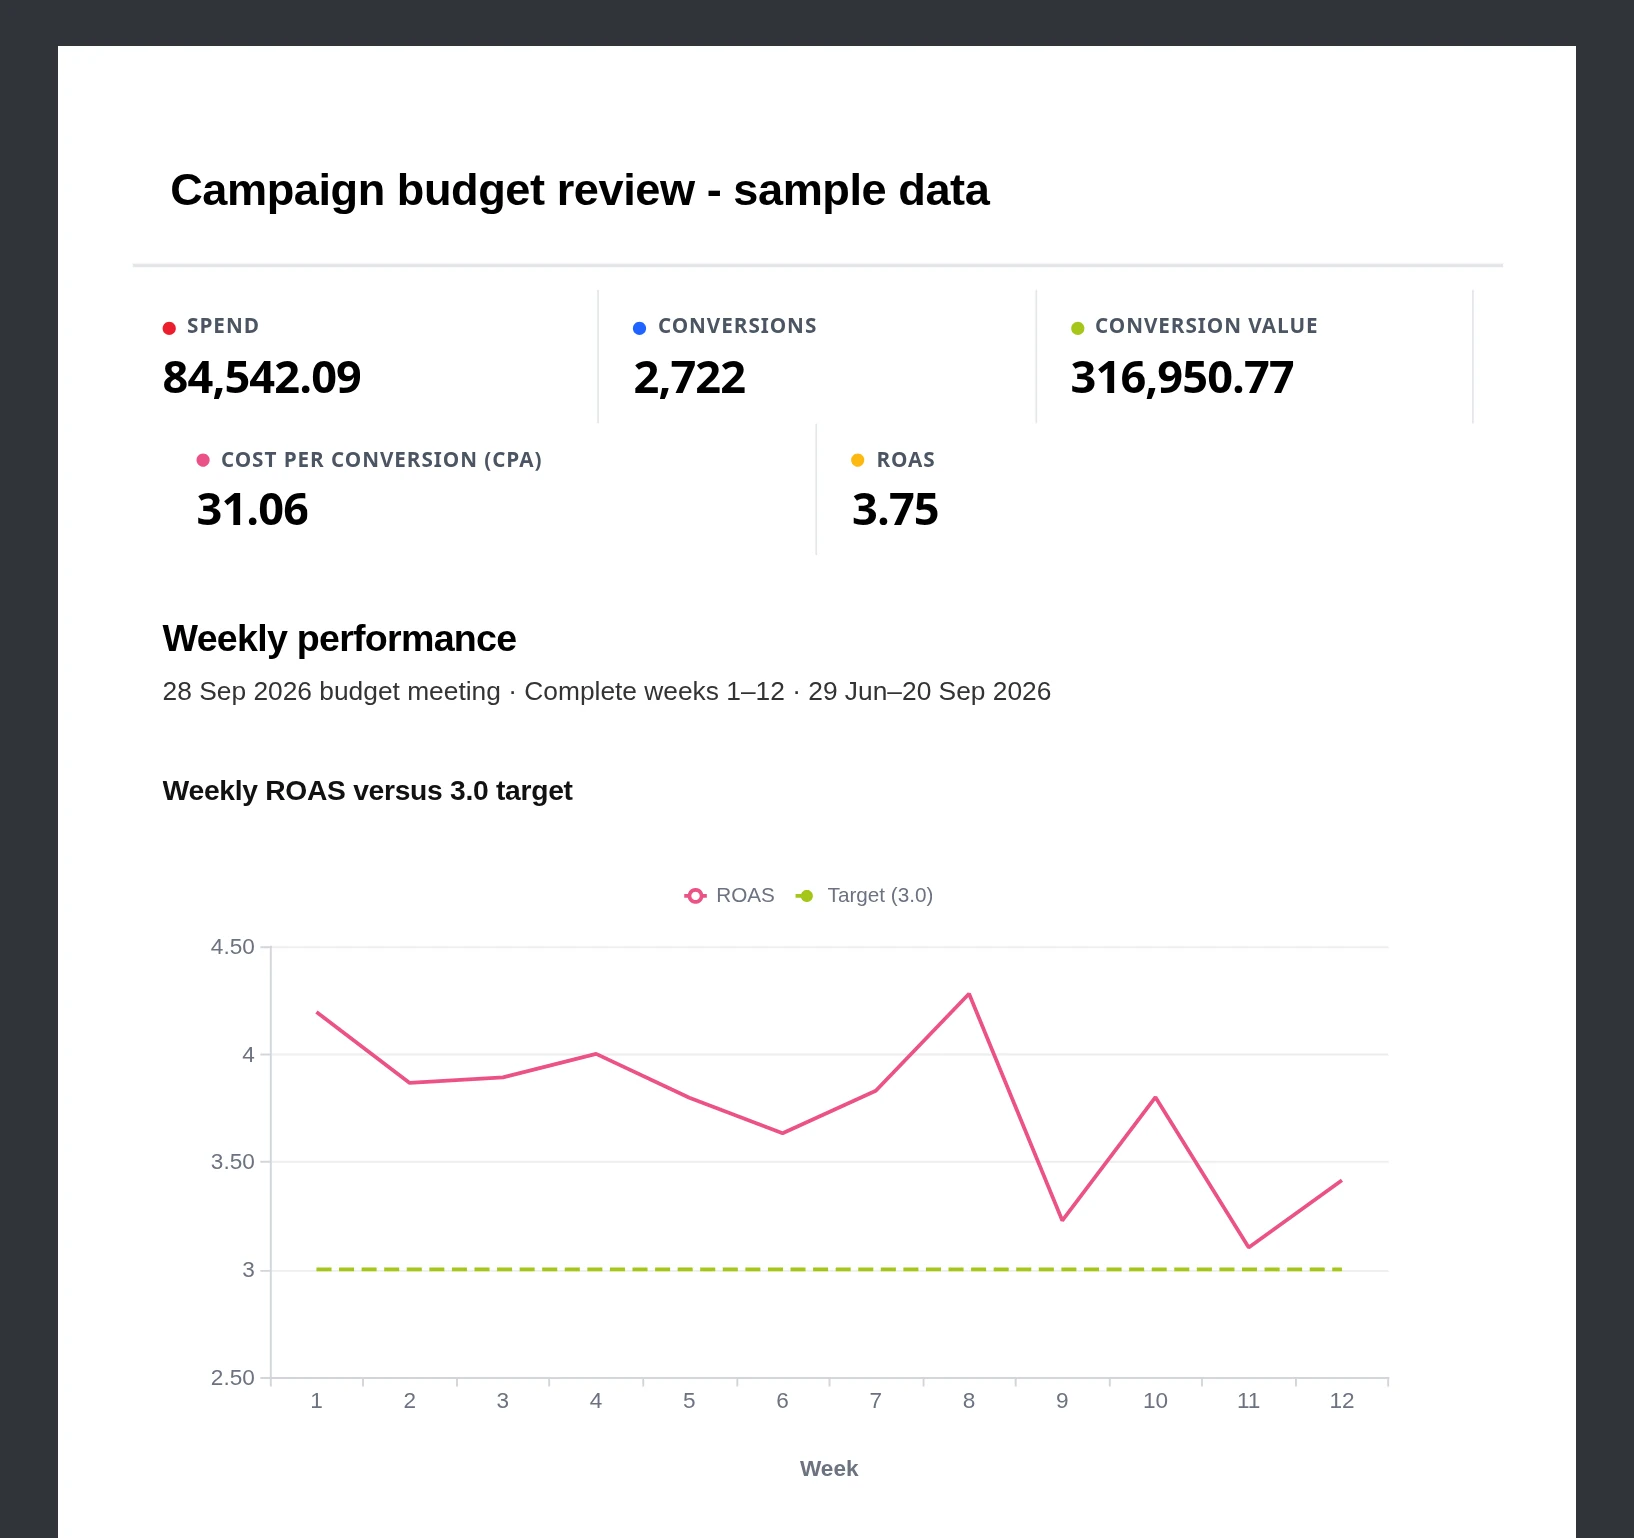
Compare campaigns on one basis: conversion-time columns, complete weeks, joined by ID. Over twelve weeks the account spent $84,542.09 for 2,722 conversions worth $316,950.77. That is a CPA of $31.06 and a ROAS of 3.75 (3.73 on the default click-date columns), above the 3.0 target.
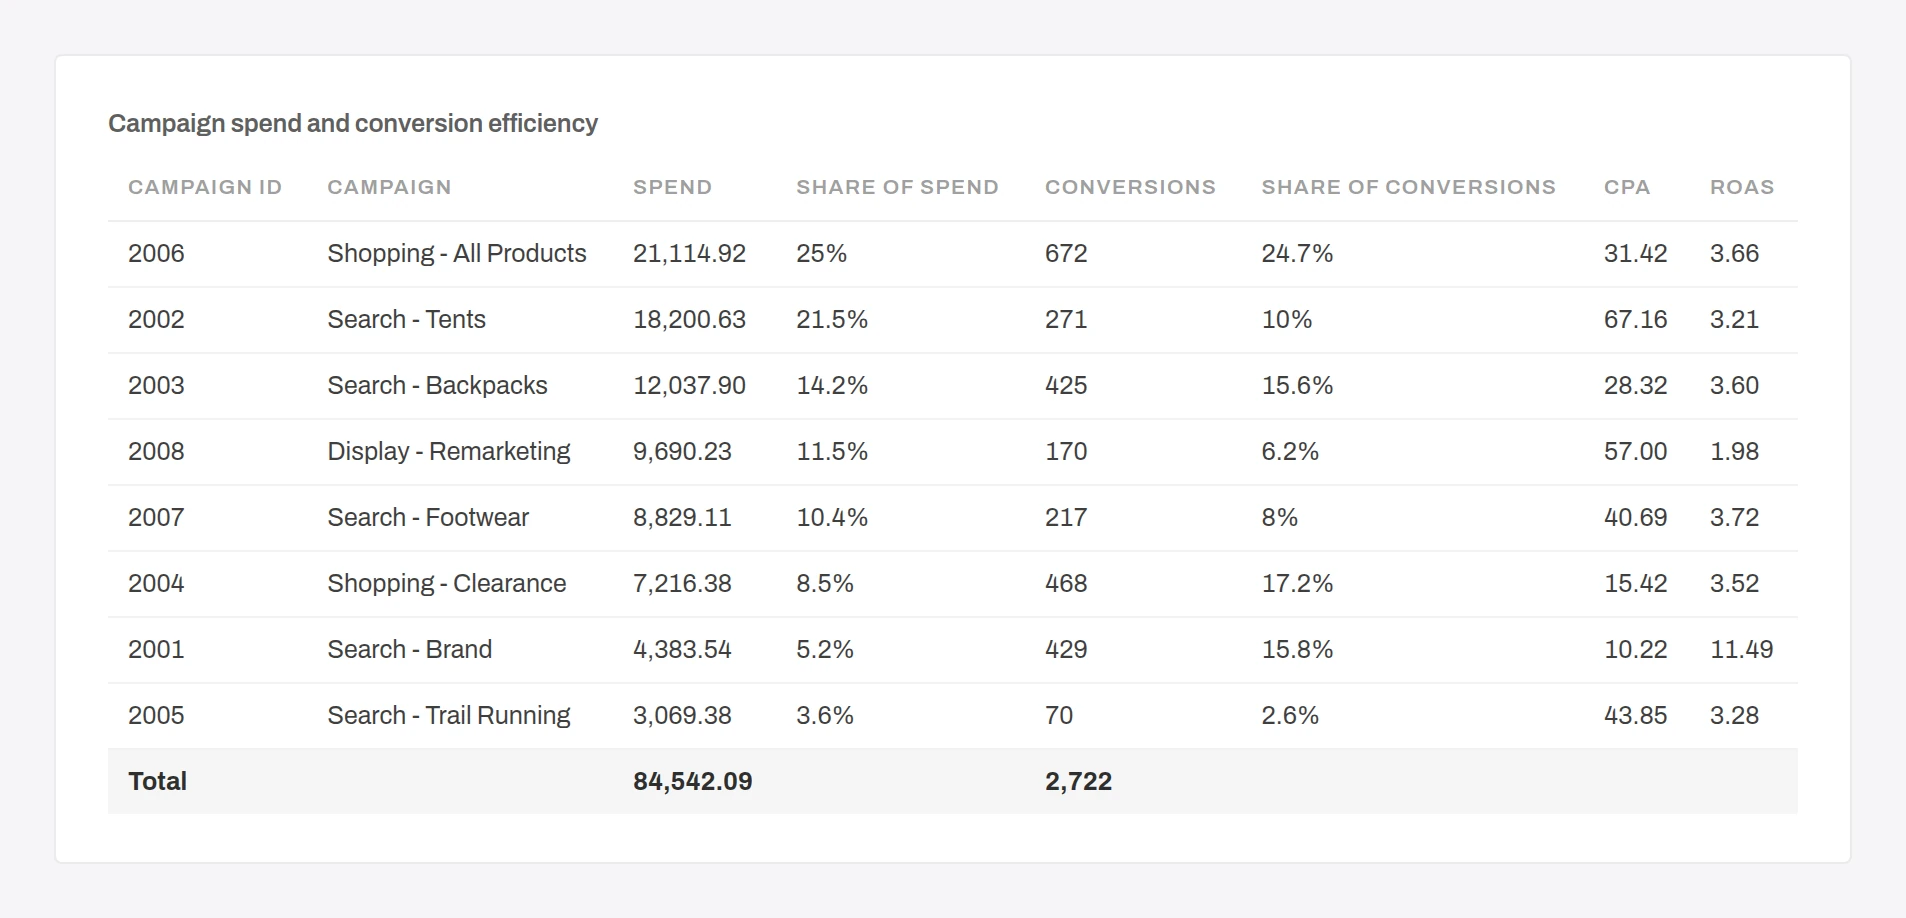
Spend share against conversion share, CPA and ROAS; one column not shown. First-party Anomaly screenshot; synthetic sample data.
Result: Search - Tents takes 21.5% of spend for 10% of conversions, and its CPA of $67.16 is the account’s highest. Yet its ROAS is 3.21, above target, because tents sell for more. Judge on CPA alone and you would cut a profitable campaign. Display remarketing is the laggard: 11.5% of spend, 6.2% of conversions, ROAS 1.98.
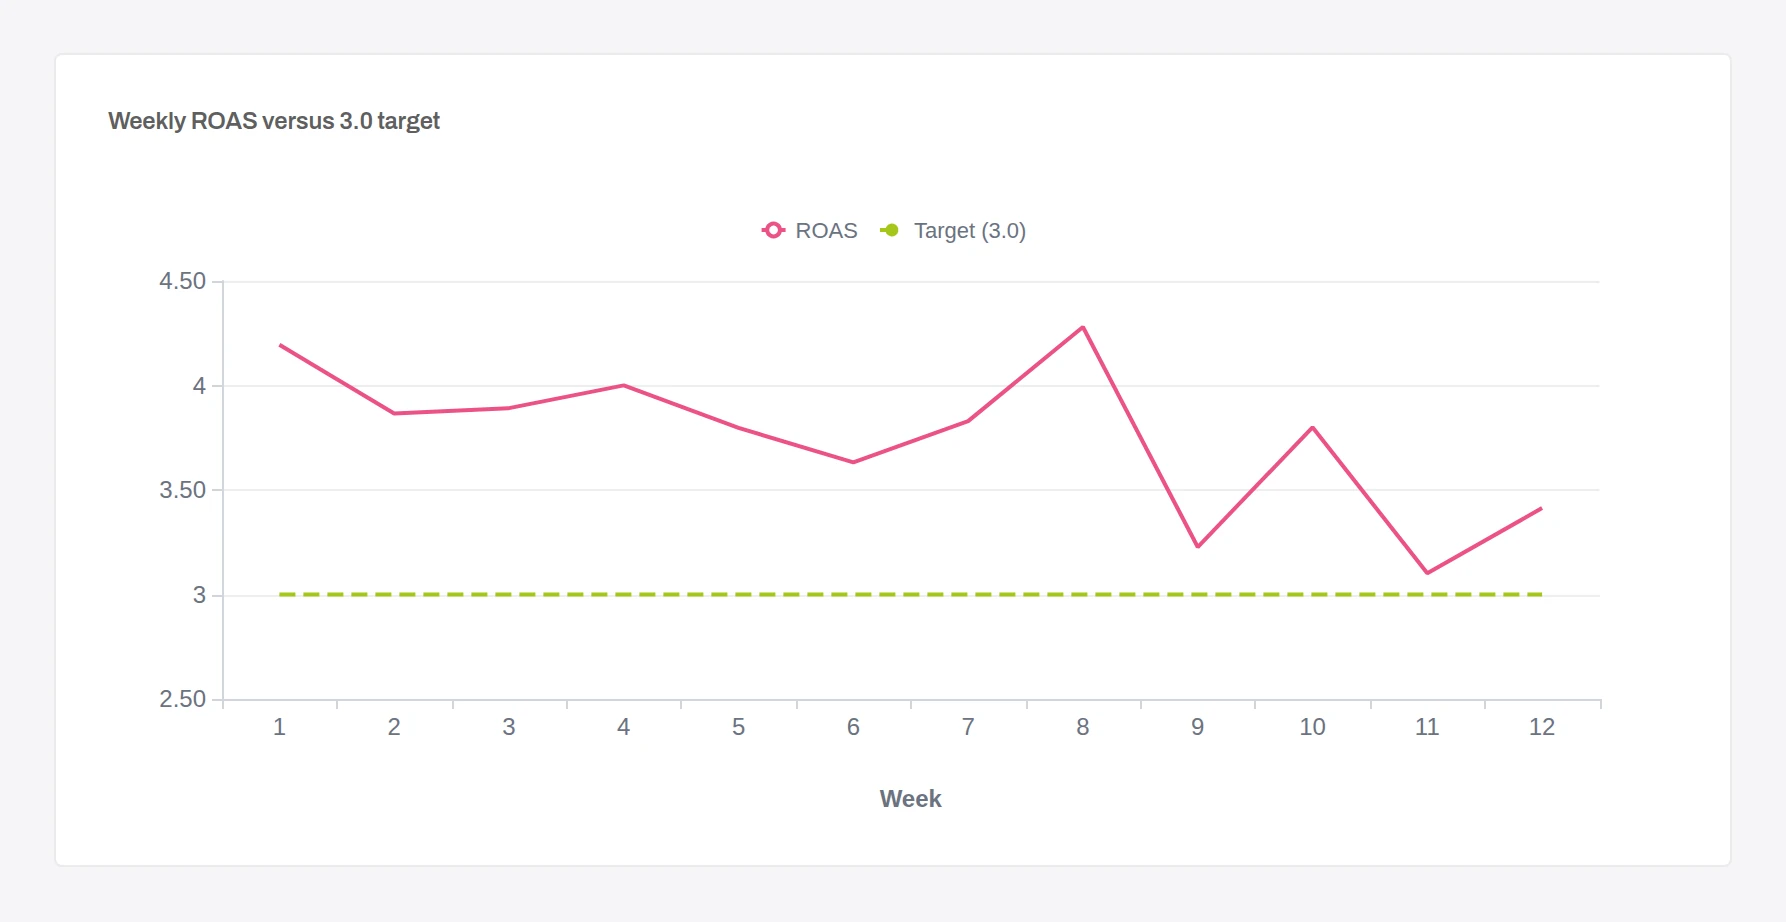
Weekly ROAS dips after week 8 but stays above target (axis starts at 2.5). First-party Anomaly screenshot; synthetic sample data.
On complete data the dip is real but small: weekly ROAS fell to 3.23 in week 9 and 3.10 in week 11. Steps 5 and 6 test whether it is noise or a change worth acting on.
05Step 5: Check whether the gap is real or noise
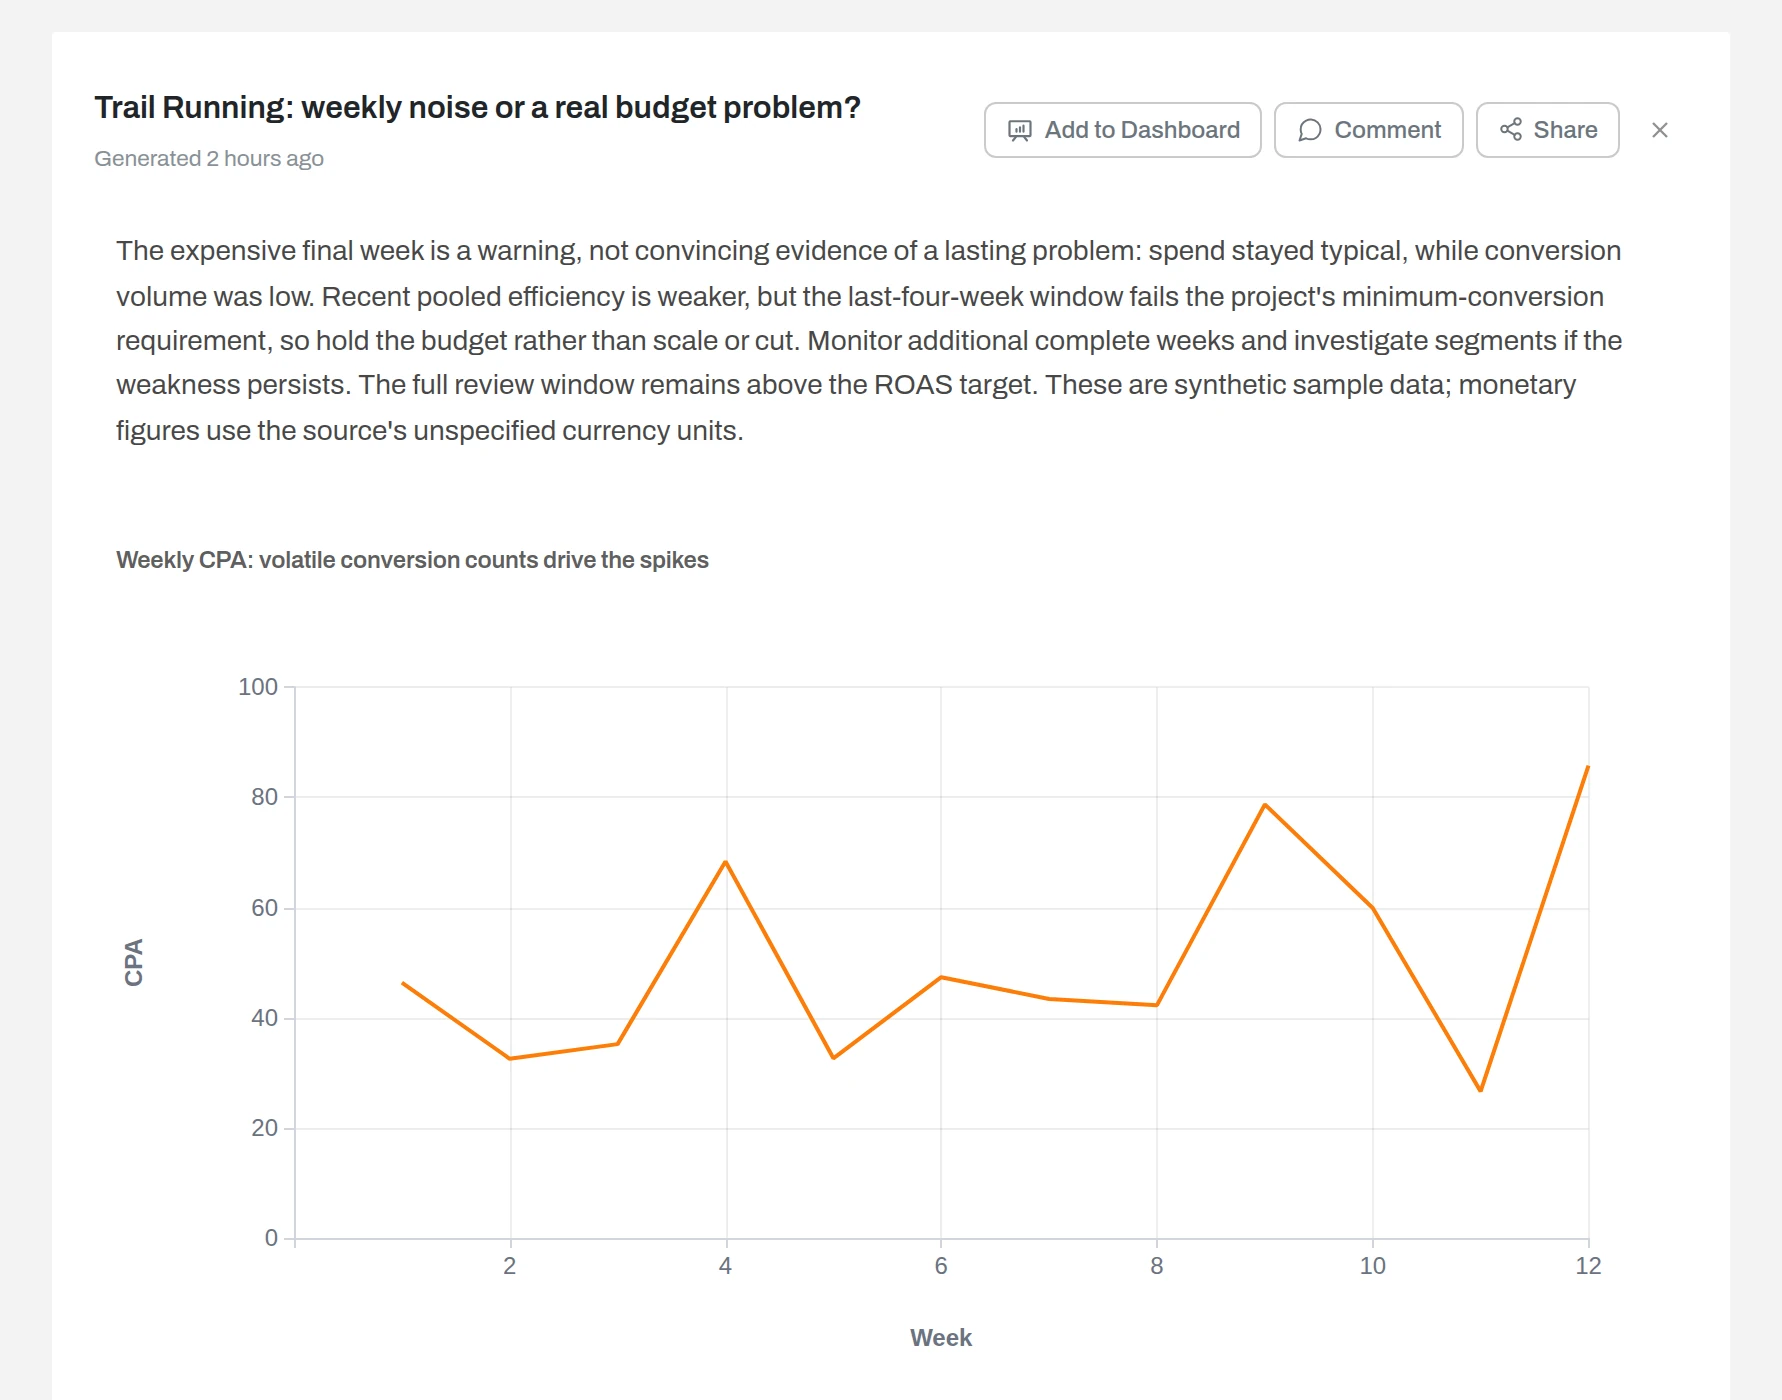
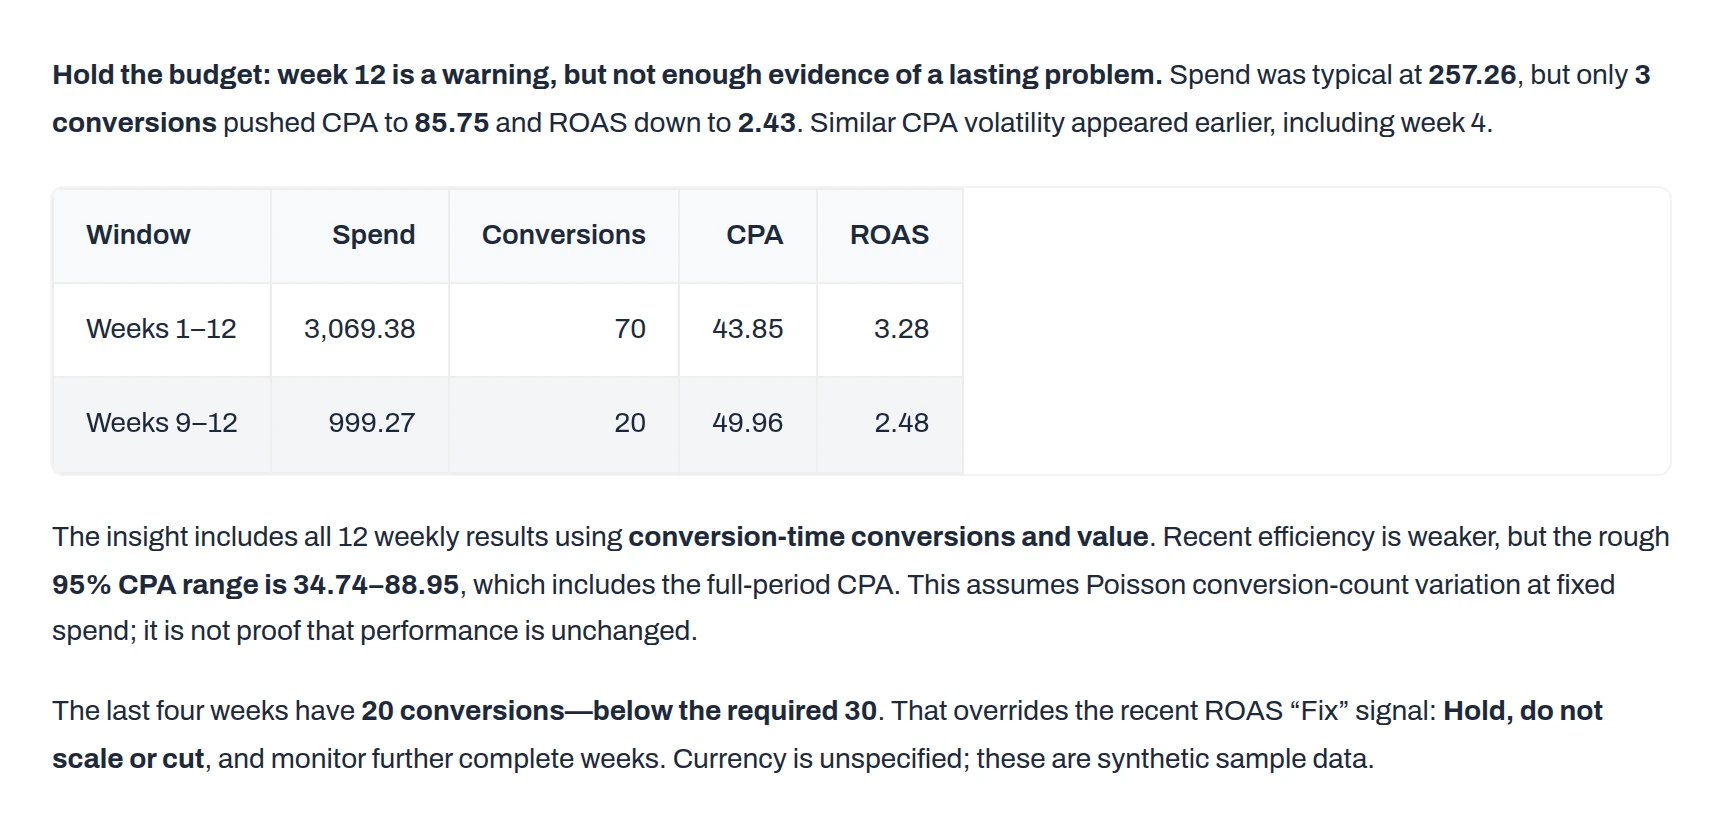
Search - Trail Running looks like a cut. In its last complete week it spent $257.26 for 3 conversions: a CPA of $85.75 and a ROAS of 2.43. But a small campaign swings a lot; one extra sale moves its CPA by a quarter.
Similar CPA spikes in weeks 4 and 9 recovered on their own. First-party Anomaly screenshot; synthetic sample data.
Widen the window, then put a rough range around the result. With 20 conversions, chance alone can move the count by about twice its square root either way. That gives a last-four-week CPA range of $34.74 to $88.95, which includes the 12-week CPA of $43.85.
High CPA on 3 conversions: hold. First-party Anomaly screenshot; synthetic sample data.
Result: over twelve weeks Trail Running spent $3,069.38 for 70 conversions at a ROAS of 3.28, above target. Its last four weeks hold 20 conversions, below the minimum of 30. The decision is hold. To know whether a campaign worked, you need enough conversions, a window longer than a week, and a result outside the range chance can produce. The same rule applies before you call an A/B test.
06Step 6: Find the segment that changed
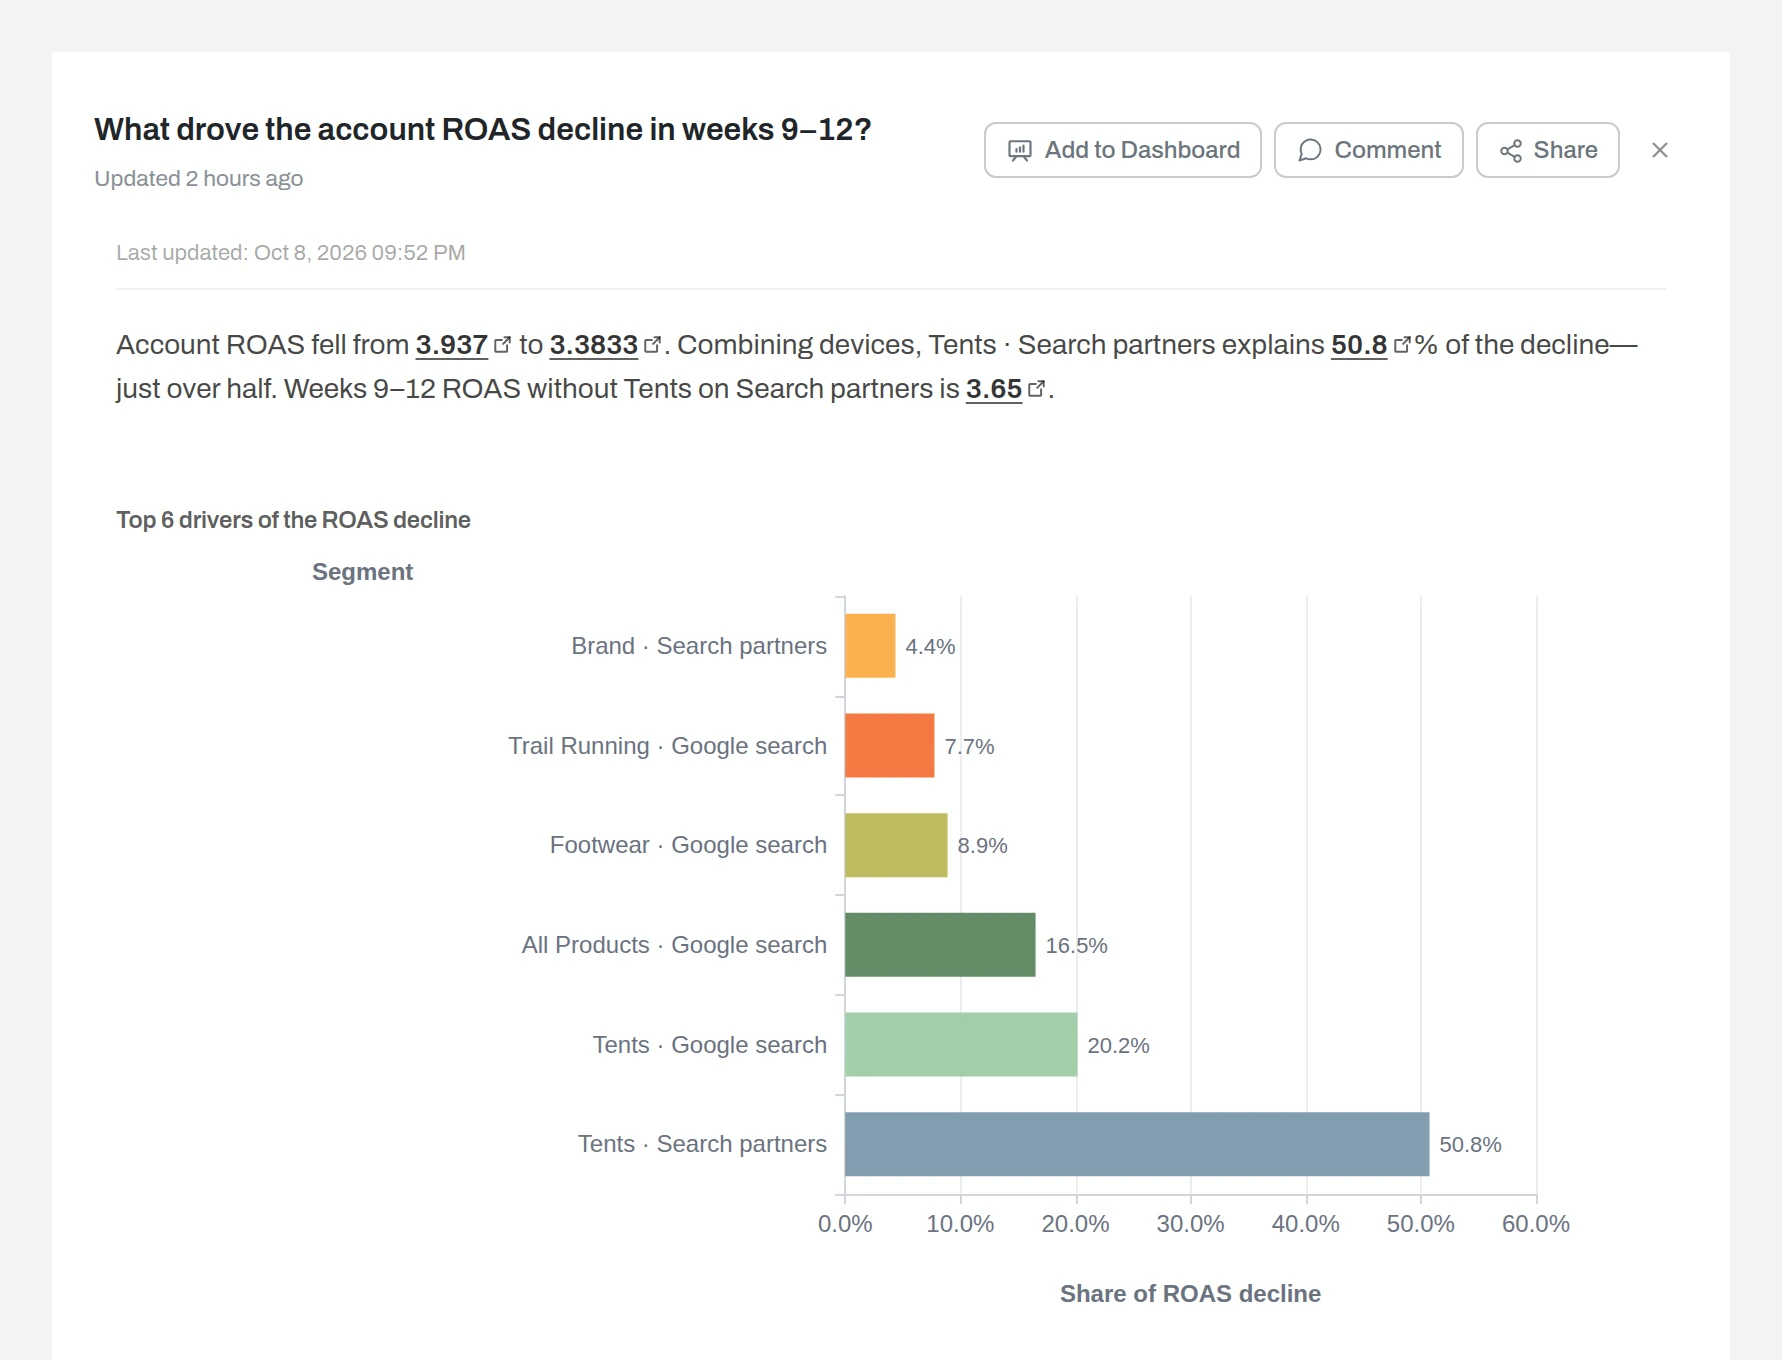
Account ROAS fell from 3.94 in weeks 1 to 8 to 3.38 in weeks 9 to 12. To find out why, split every campaign by network and device, and rank each piece by how much it pulled ROAS down. Add landing page if your export has it; this sample does not. This is where ad performance analysis by segment pays off.
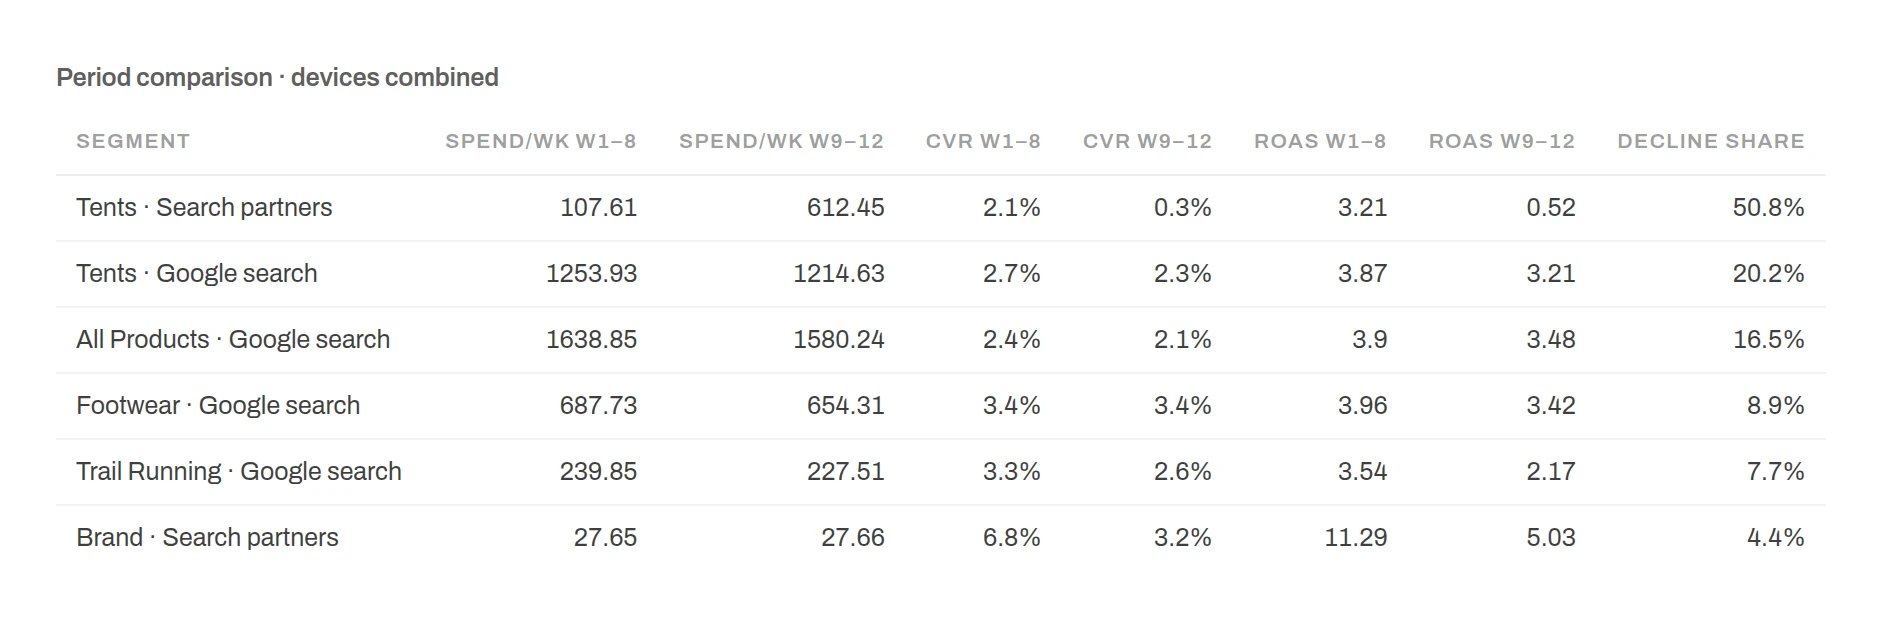
One campaign-network pair explains half the decline. First-party Anomaly screenshot; synthetic sample data.
Tents spend on Search partners rose almost sixfold as conversions collapsed. First-party Anomaly screenshot; synthetic sample data.
Result: the outlier is the Tents campaign on Google’s Search partners network. From week 9 its weekly spend rose from $107.61 to $612.45, while its conversion rate fell from 2.1% to 0.3% and its ROAS from 3.21 to 0.52. That pair explains 50.8% of the decline; without it, weeks 9 to 12 ROAS is 3.65.
To improve performance, fix the segment, not the whole campaign: Tents on Google search still returns 3.21. Turn off Search partners for that campaign and watch it for two weeks. The search terms report in Google Ads shows which searches triggered those clicks.
07Step 7: Decide what to scale, fix, cut or hold, and schedule the check
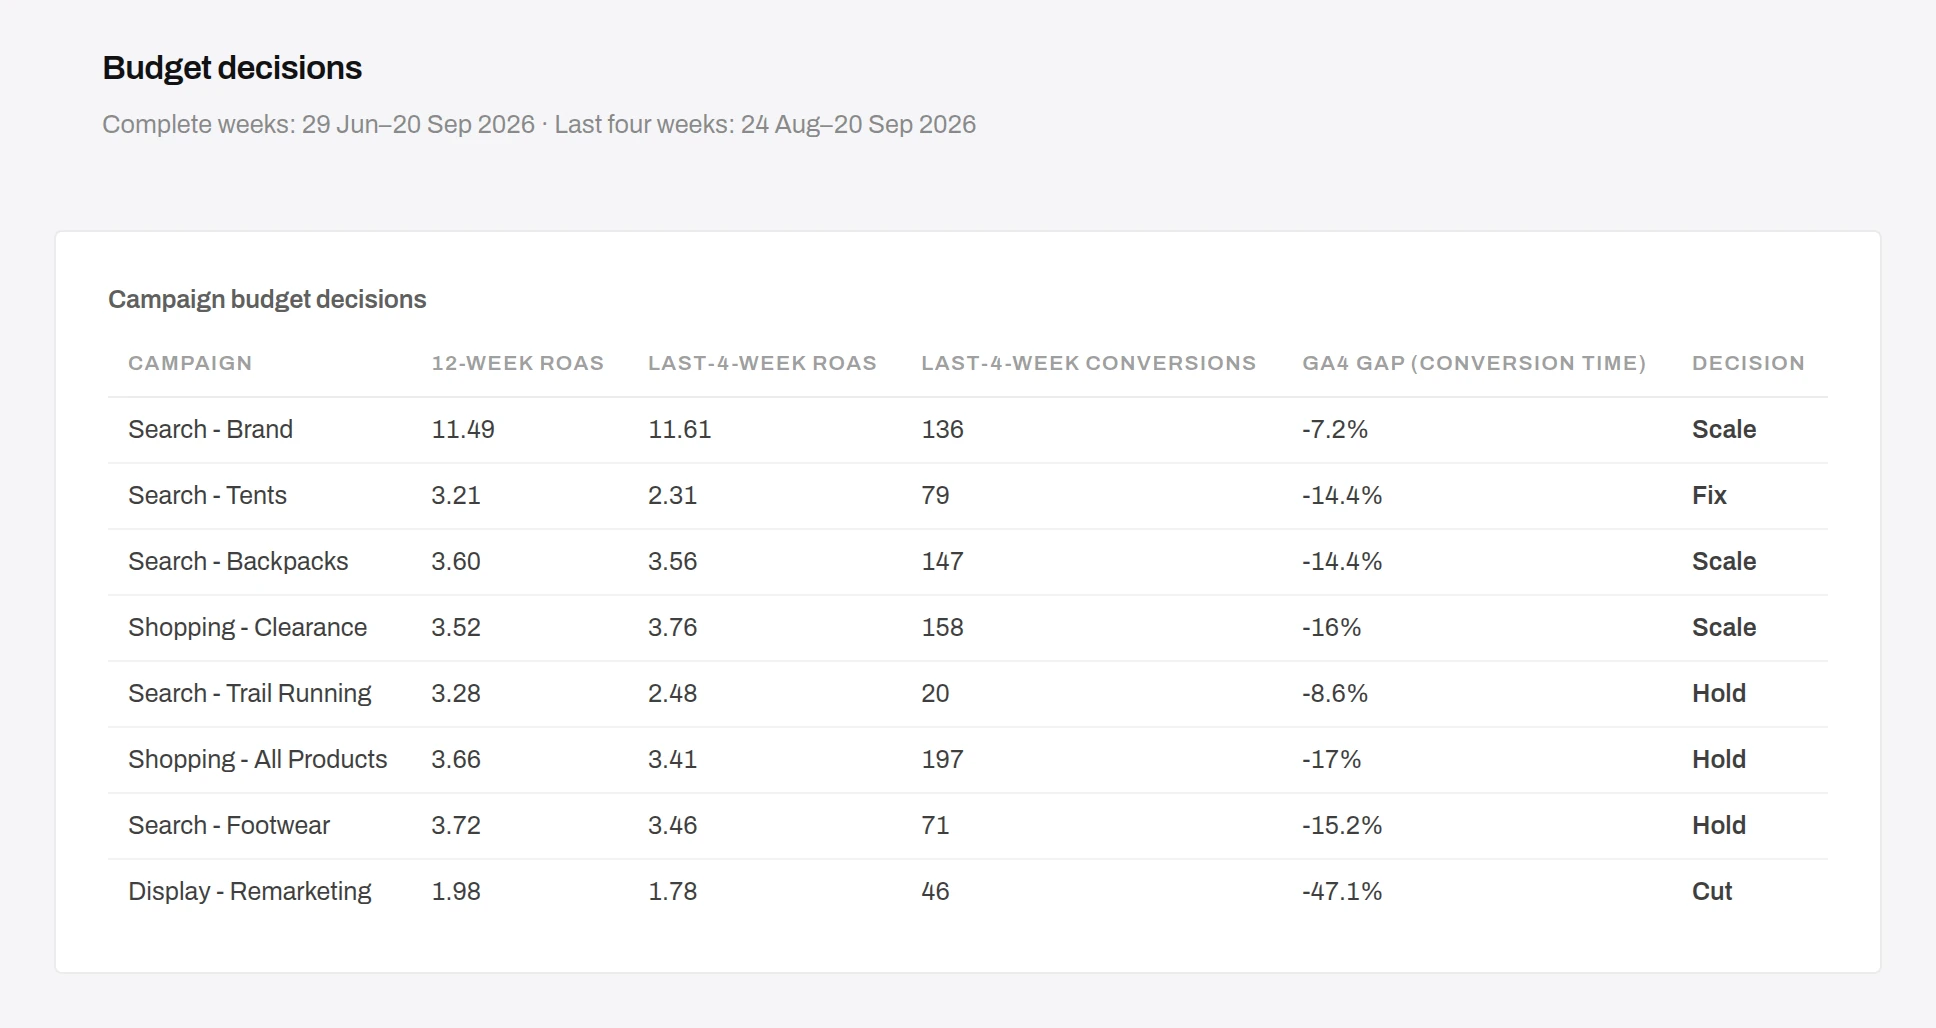
Apply the step 1 rules to every campaign and write each decision down with its numbers.
Every row applies the same written rule; two columns not shown. First-party Anomaly screenshot; synthetic sample data.
Too few conversions (Trail Running), or between the thresholds
The rule is mechanical on purpose; a person still reads each row: Brand can only grow as far as brand searches.
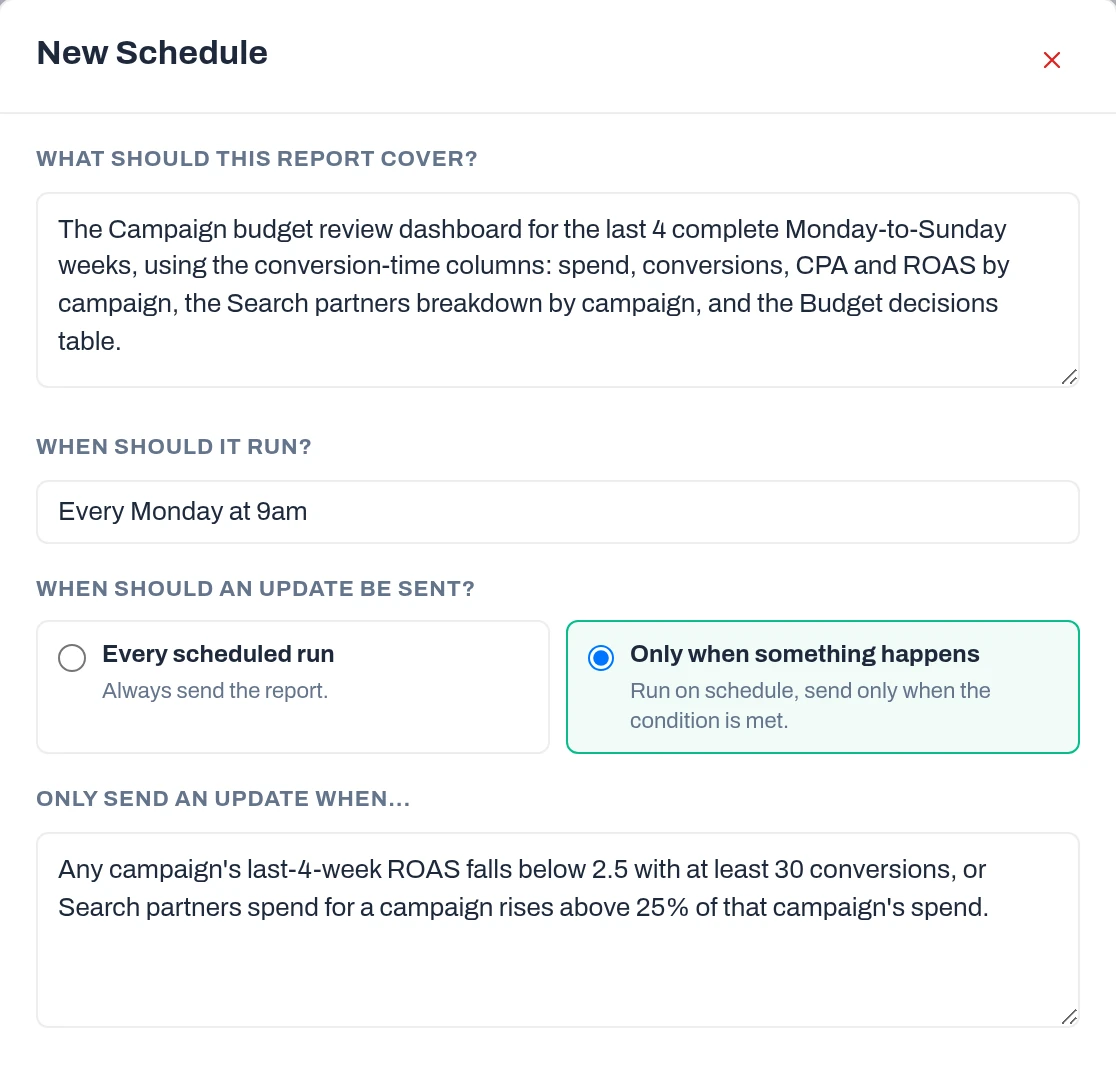
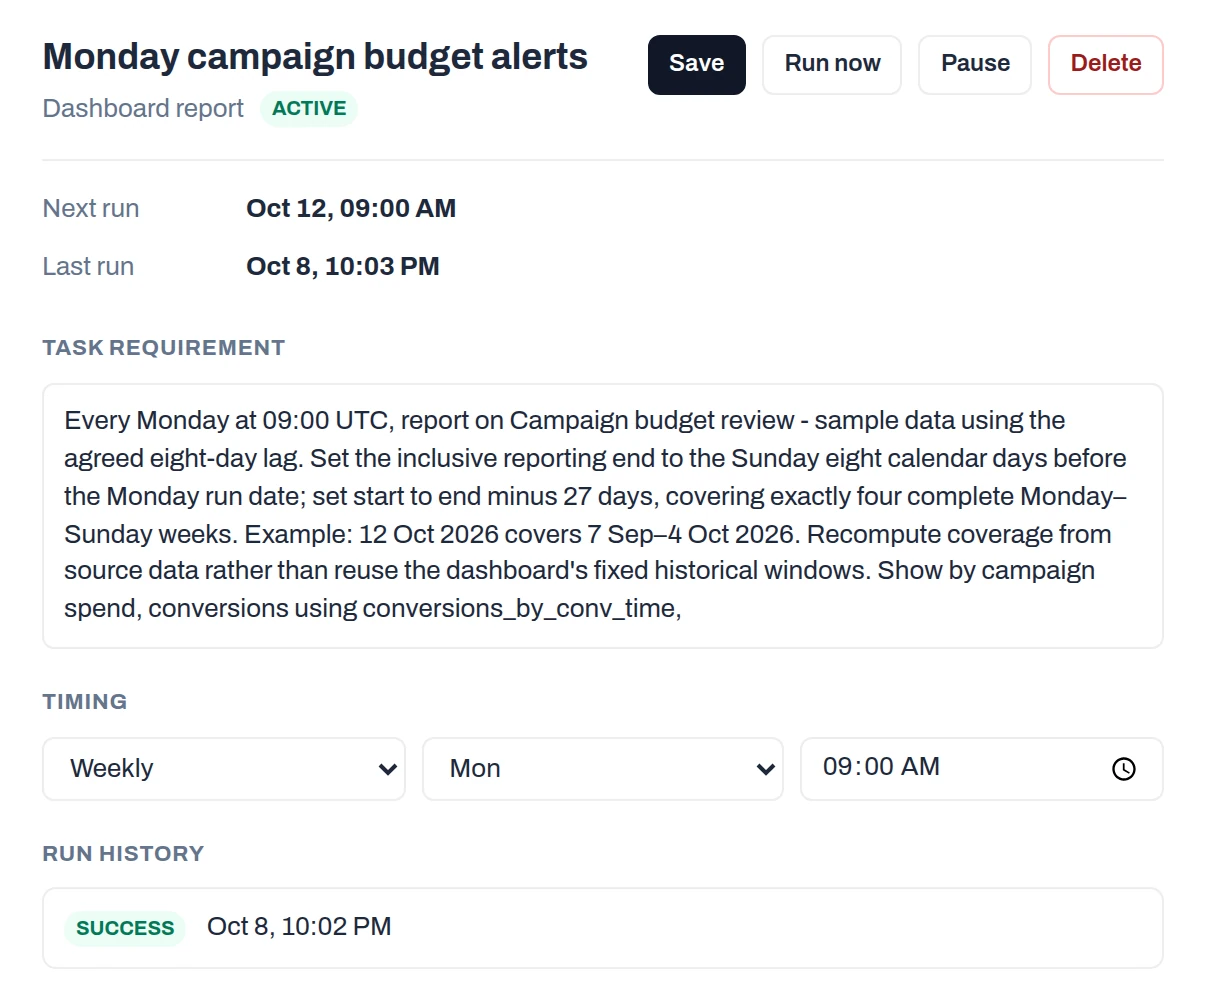
A scheduled report set to “Only when something happens” checks, on every scheduled run, for the change, threshold or exception you describe. The report goes out, by email, Slack or both, only when it is met. Ours runs every Monday at 9am. It sends only if a campaign’s 4-week ROAS falls below 2.5 on 30 or more conversions, or Search partners take over 25% of its spend. Anomaly suggested an eight-day lag, so each report covers four finished weeks. Scheduled reports need the Pro plan ($25 a month, or $20 billed yearly) or above.
The report sends only when a threshold is crossed. First-party Anomaly screenshot; synthetic sample data.
The saved schedule: the eight-day lag in its instructions and a successful test run. First-party Anomaly screenshot; synthetic sample data.
For a one-off copy for the meeting, export the dashboard as a PDF.
Top of page 1 of the PDF export, in Anomaly’s file preview. First-party Anomaly screenshot; synthetic sample data.
Comparing channels: don’t add up each platform’s conversions
Cross-channel marketing analytics needs one referee. Each platform counts conversions its own way, with its own window, dating and view-throughs. Add them together and you count the same sale twice.
In the sample, the platforms report 3,759 conversions over twelve weeks: 2,710 from Google Ads, 443 from email and 606 from paid social. GA4 credits 2,963 purchases to the same channels, 21.2% fewer. The gap is 15.8% for Google Ads, 26.9% for email and 41.3% for paid social. Compare channels on the conversion credit GA4 assigns under your attribution model, and use each platform’s own numbers only to manage that platform. Meta and TikTok Ads can be connected directly; other networks can come in as CSV or Sheets exports, as paid social does here.
Performance also varies by platform for honest reasons. Paid social can reach people early; if a later search or email visit closes the sale, GA4 may credit that visit. A weaker ROAS in GA4 is not always a weaker campaign.
What this analysis can’t tell you
This analysis shows what happened and where it changed, not what would have happened without the ads. That question is incrementality. It needs a held-back group, such as a geographic experiment where some regions see the ads and others do not (Vaver and Koehler, Google, 2011). It is also not media mix modelling or attribution modelling.
That matters for the Cut row. Remarketing can reach people who would have bought anyway, or GA4 could be missing sales the ads drove. Before switching it off, consider pausing it in some regions first.
Watch for four traps: mixed date ranges, a partial last day or unconverted recent clicks, small samples, and renamed campaigns joined by name.
Where AI helps, and where to check it
What people call AI-powered campaign analysis is mostly faster joins and faster follow-up questions. In our run, each step was one request:
“Reconcile Google Ads with GA4 for the eight Google Ads campaigns, joined on campaign_id = session_campaign_id…”
“Search - Trail Running looks expensive in its last complete week. Is that a real problem or normal week-to-week noise?… Apply the minimum-conversion rule from the project knowledge.”
Speed is not accuracy. Ask how each number was counted, which dates it covers and which rows it excludes, then check the important ones against the source rows. We asked for clearer output three times: rounded ROAS, readable chart labels and a tighter chart axis.
Anomaly is an AI data analyst for large datasets and spreadsheets. Here it joined the Google Ads, GA4 and channel exports, applied the saved rules, and built the dashboard, decision table and conditional weekly report. Each table and chart opens to its query, and the project’s saved calculations keep the SQL behind each result.
Eight checks before you move budget
Write the target and the minimum conversions before you look at results.
Use complete weeks and drop a partial last day.
Join on campaign ID, never on campaign name.
Compare GA4 with Google Ads on conversion-time columns.
Treat an unusual GA4 gap as a tracking question before a performance verdict.
Judge ROAS, not CPA alone, when order values differ.
Hold any campaign with fewer than 30 conversions in the window.
Find the segment that changed before cutting a whole campaign.
Frequently asked questions
How do you measure campaign performance?
Set a ROAS or CPA target and a minimum number of conversions before launch. Then compare each campaign’s spend with the conversions and value it produced over complete weeks, using one source for decisions and another as a cross-check.
Which campaign performance metrics matter most?
ROAS and CPA decide budget, because they tie spend to results. CTR, CPC and conversion rate explain why ROAS or CPA moved. Use ROAS rather than CPA alone when products sell at very different prices.
Why do GA4 and Google Ads show different conversion numbers?
Google Ads dates a conversion to the ad, while GA4 dates it to the day it happened. GA4 also counts sessions, not clicks, and credits purchases under its own attribution model. Compare on the conversion-time columns and watch for unusual gaps.
What is the difference between campaign reporting and campaign analysis?
Reporting shows what happened: spend, clicks and conversions. Analysis compares the results with a target, tests whether differences are real, finds what changed, and ends with a decision to scale, fix, cut or hold.
How often should you review and report on campaign performance?
Check and report weekly, but decide budgets on four or more complete weeks so small campaigns have enough conversions. Run a post-campaign analysis after the conversion window closes, not on the campaign’s last day.
Can AI do campaign performance analysis?
Yes, for the joins, comparisons and follow-up questions: it can line up Google Ads and GA4 exports, rank segments and draft a decision table. A person should still set the target, check how each number was counted, and decide.
Founder, Anomaly AI (ex-CTO & Head of Engineering)
Abhinav Pandey is the founder of Anomaly AI, an AI data analysis platform built for large, messy datasets. Before Anomaly, he led engineering teams as CTO and Head of Engineering.