Marketing reporting software for GA4, Google Ads and Search Console
Connect your channels once, check every number, and send the same report every week by email or Slack.
Quick answer — what marketing reporting software does
Marketing reporting software pulls your channel data into one place, calculates each metric the same way every time, and sends the report to the people who need it. Anomaly connects GA4, Google Ads, Search Console, Meta / Instagram Ads, TikTok Ads and more, builds the dashboard from one request, and keeps the query behind every number. It sends the report daily, weekly or monthly, or only when a condition you set is met.
Sources
Connect the channels your report already uses
Sign in to your analytics and ad accounts, or upload exports. Each source becomes a table in the same project, so one report can put Google Ads cost next to GA4 key events.
 Google Analytics 4
 Google Ads
 Search Console
 Meta / Instagram Ads
 TikTok Ads
 Shopify
 HubSpot
 Google Sheets
 Excel and CSV
 BigQuery
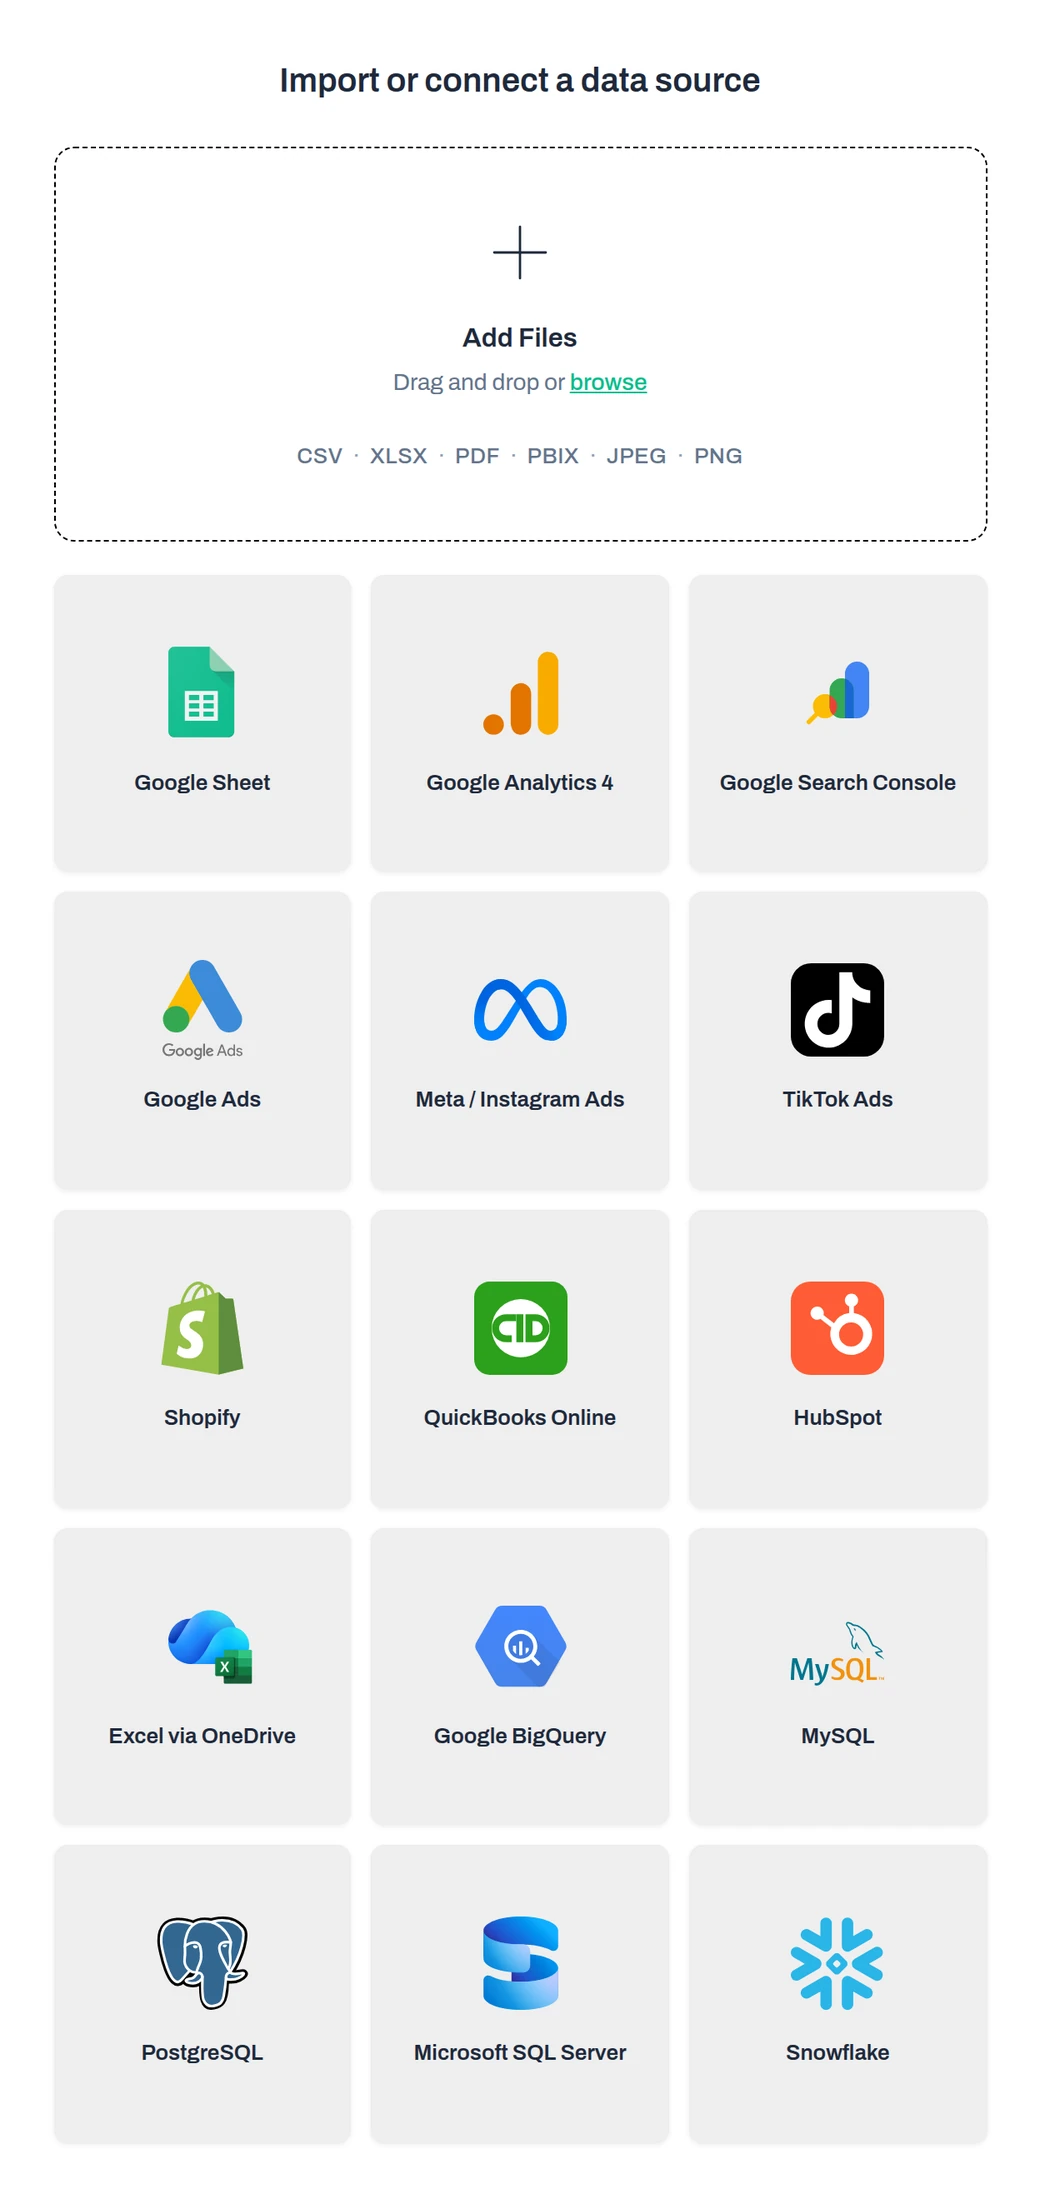
Also Excel via OneDrive (refreshable), MySQL, PostgreSQL, Microsoft SQL Server, Snowflake, QuickBooks Online and tables from PDF files. Excel and CSV uploads go up to 1 GB. See all connectors
How it works
From connected sources to a scheduled report
Four steps, shown with real screenshots from an Anomaly test workspace and synthetic GA4, Google Ads and Search Console data.
Step 1: Connect or upload your data
Pick a connector and sign in, or drop in CSV or Excel exports. Connected sources refresh before each scheduled run. An uploaded file stays as it is until you replace it, and Anomaly warns you about that when you schedule it.
Step 2: Ask for the report in plain English
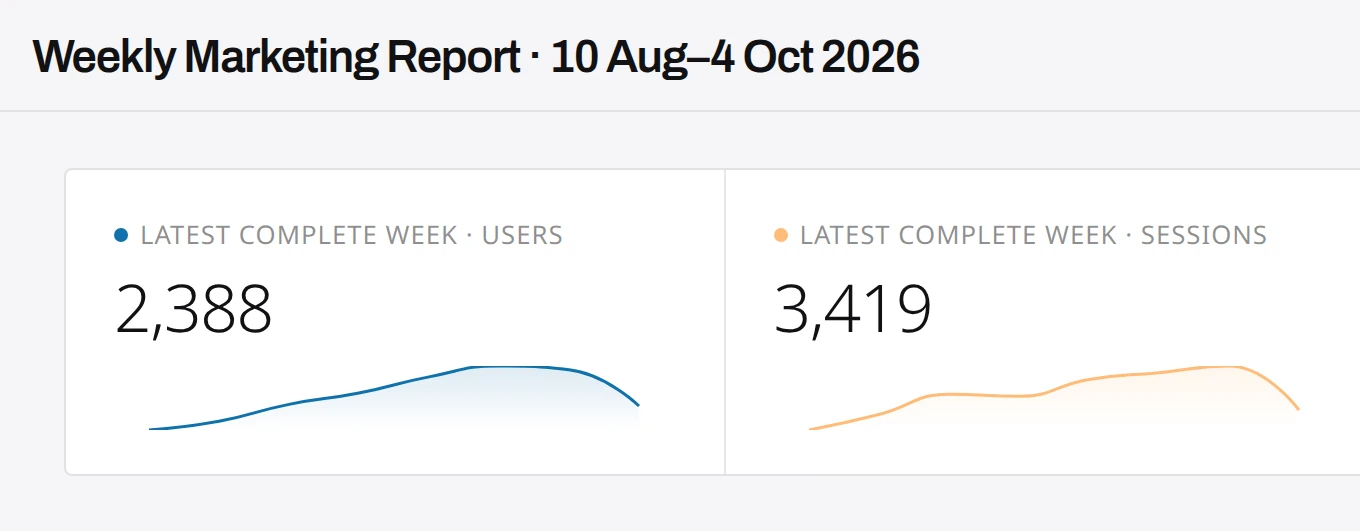
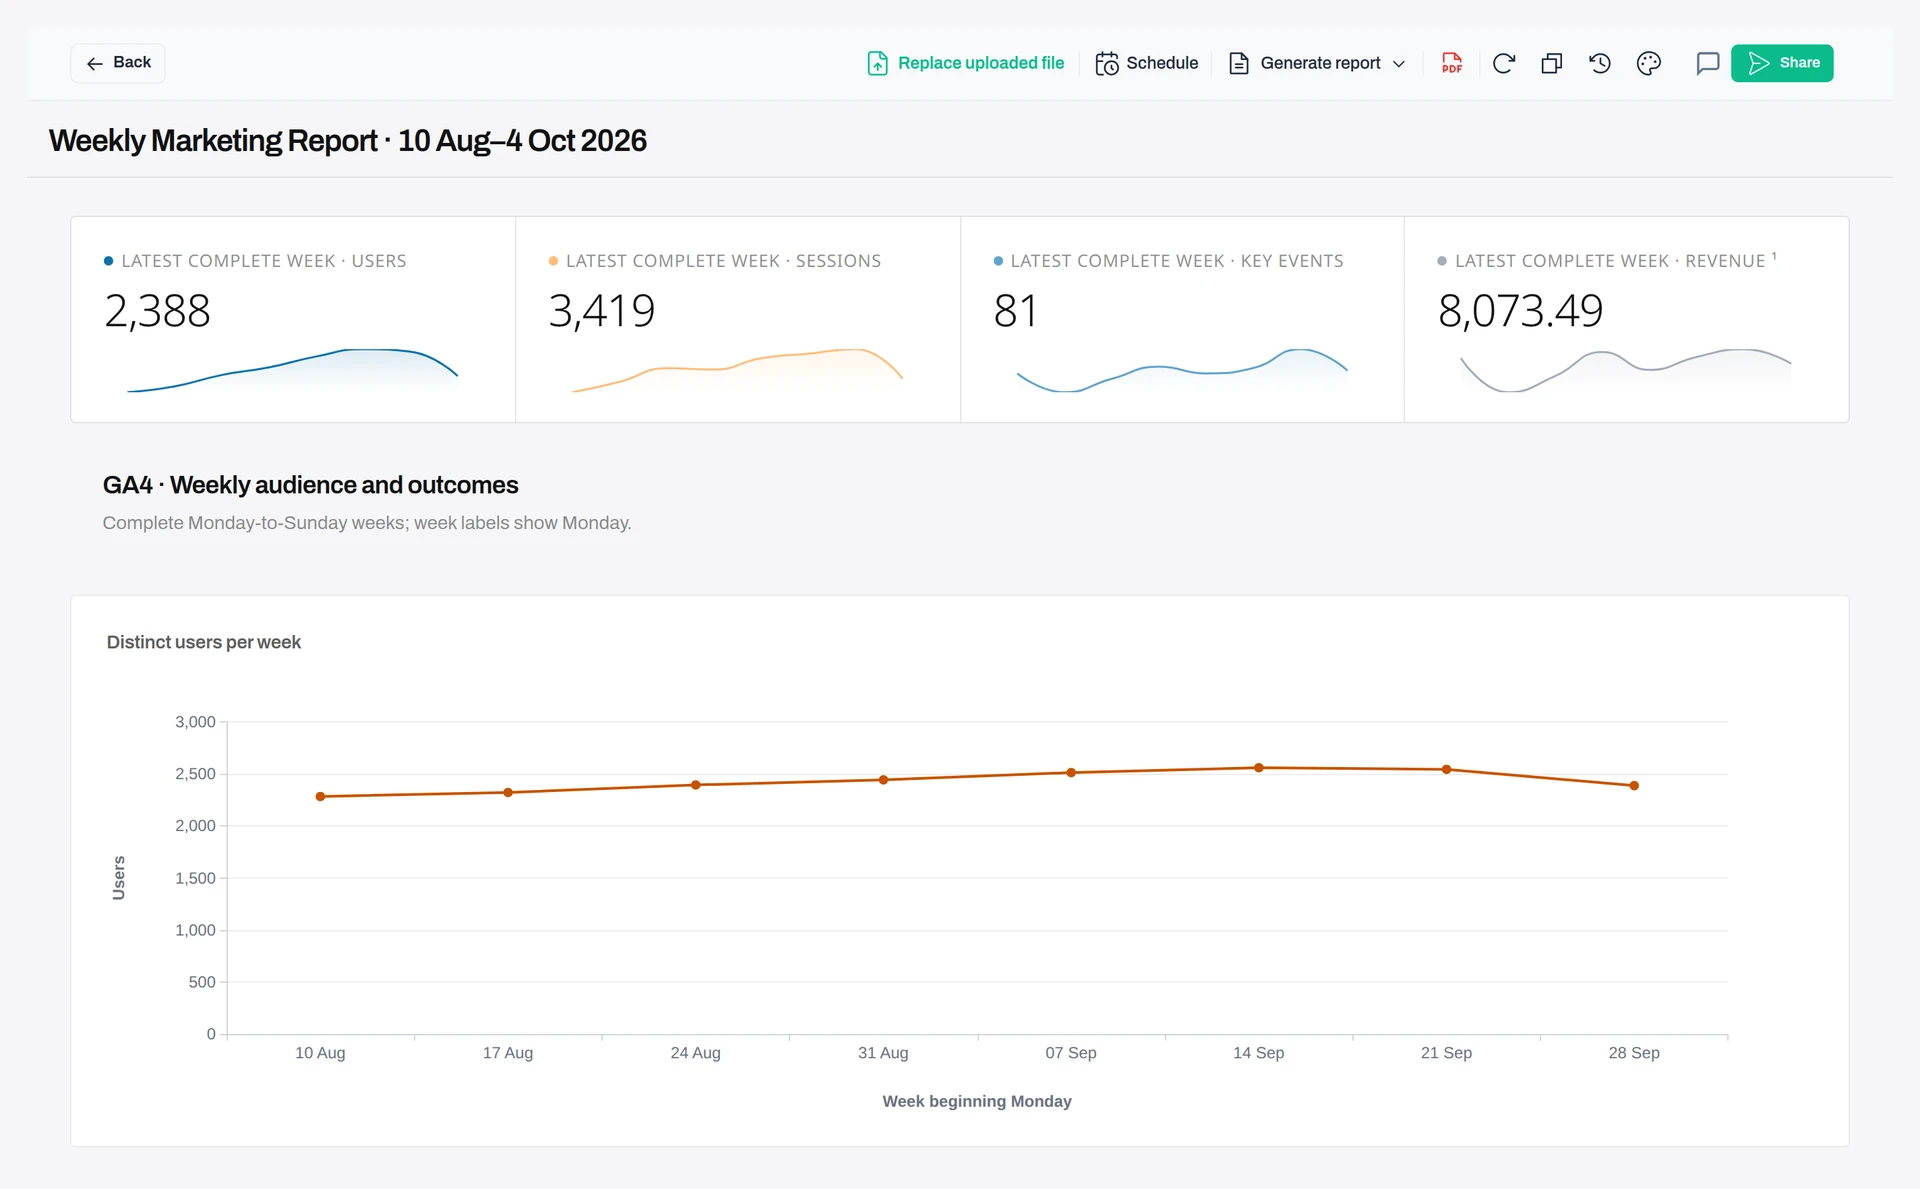
Name the sources, the weeks you report on and the metrics. Anomaly checks that each week has complete data, then builds the dashboard: headline numbers, weekly trends, Google Ads by campaign and Search Console by week. Ours had 11 cards from one request. To decide what belongs on yours, see the marketing analytics dashboard guide; to judge campaigns, see campaign performance analysis.
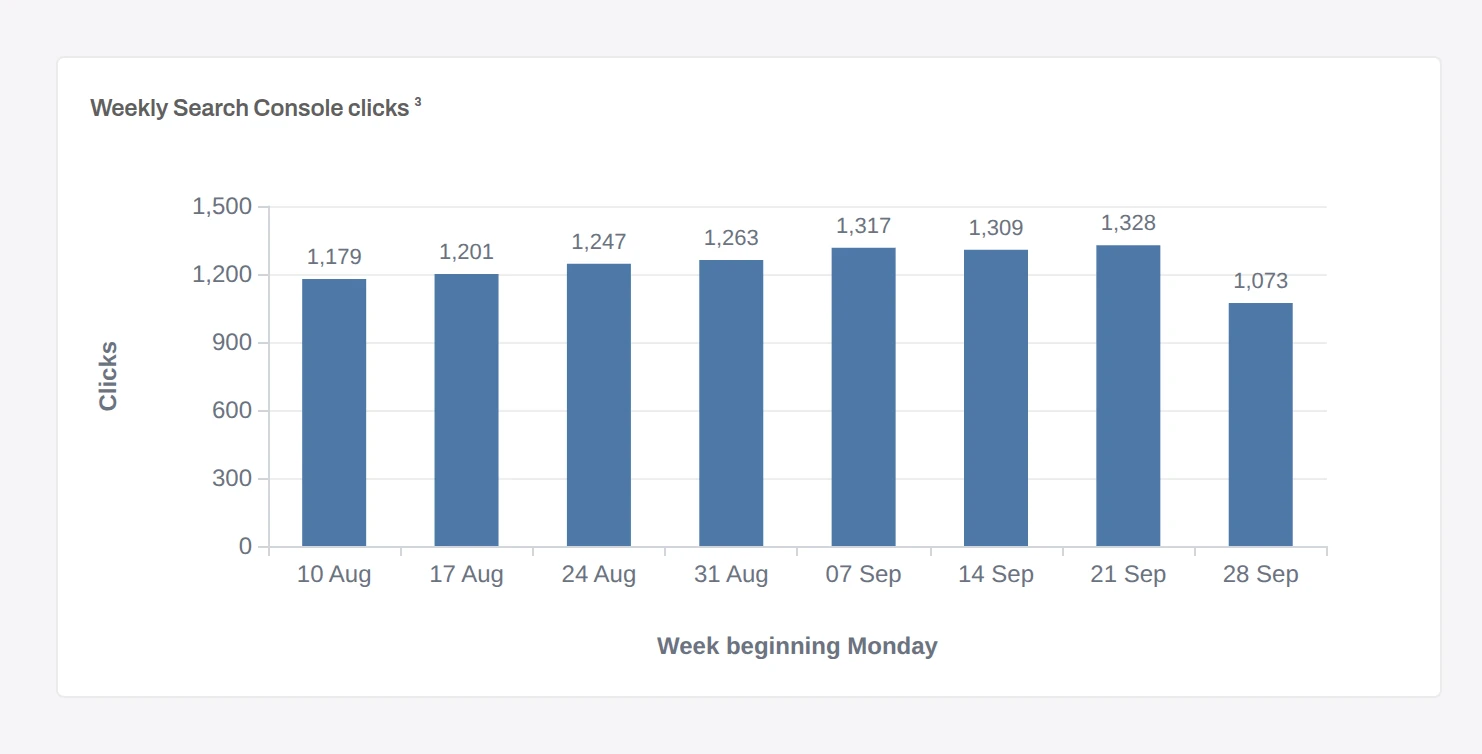
Step 3: Check each number before it goes out
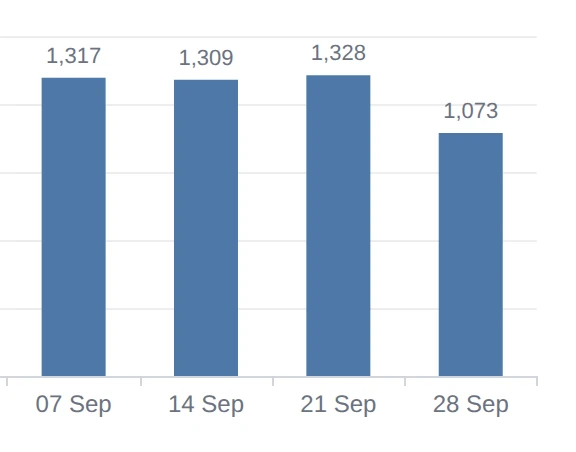
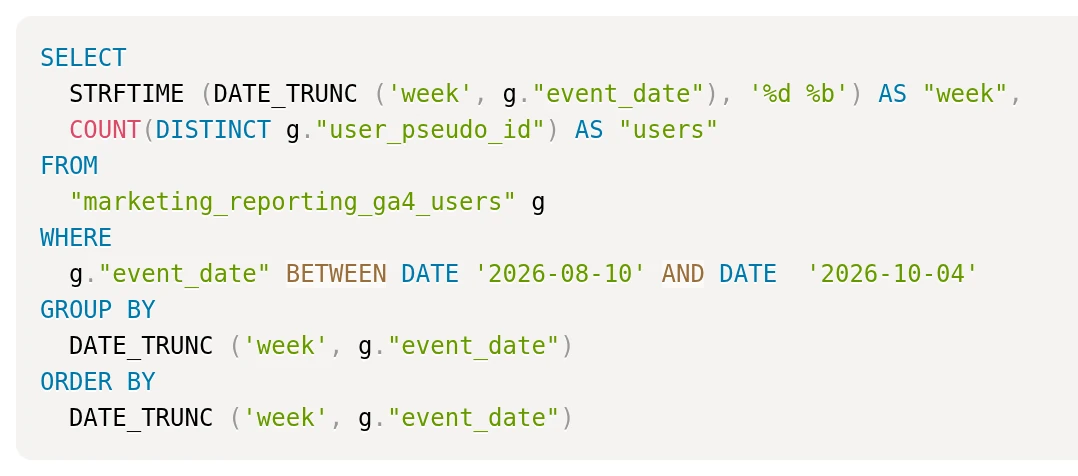
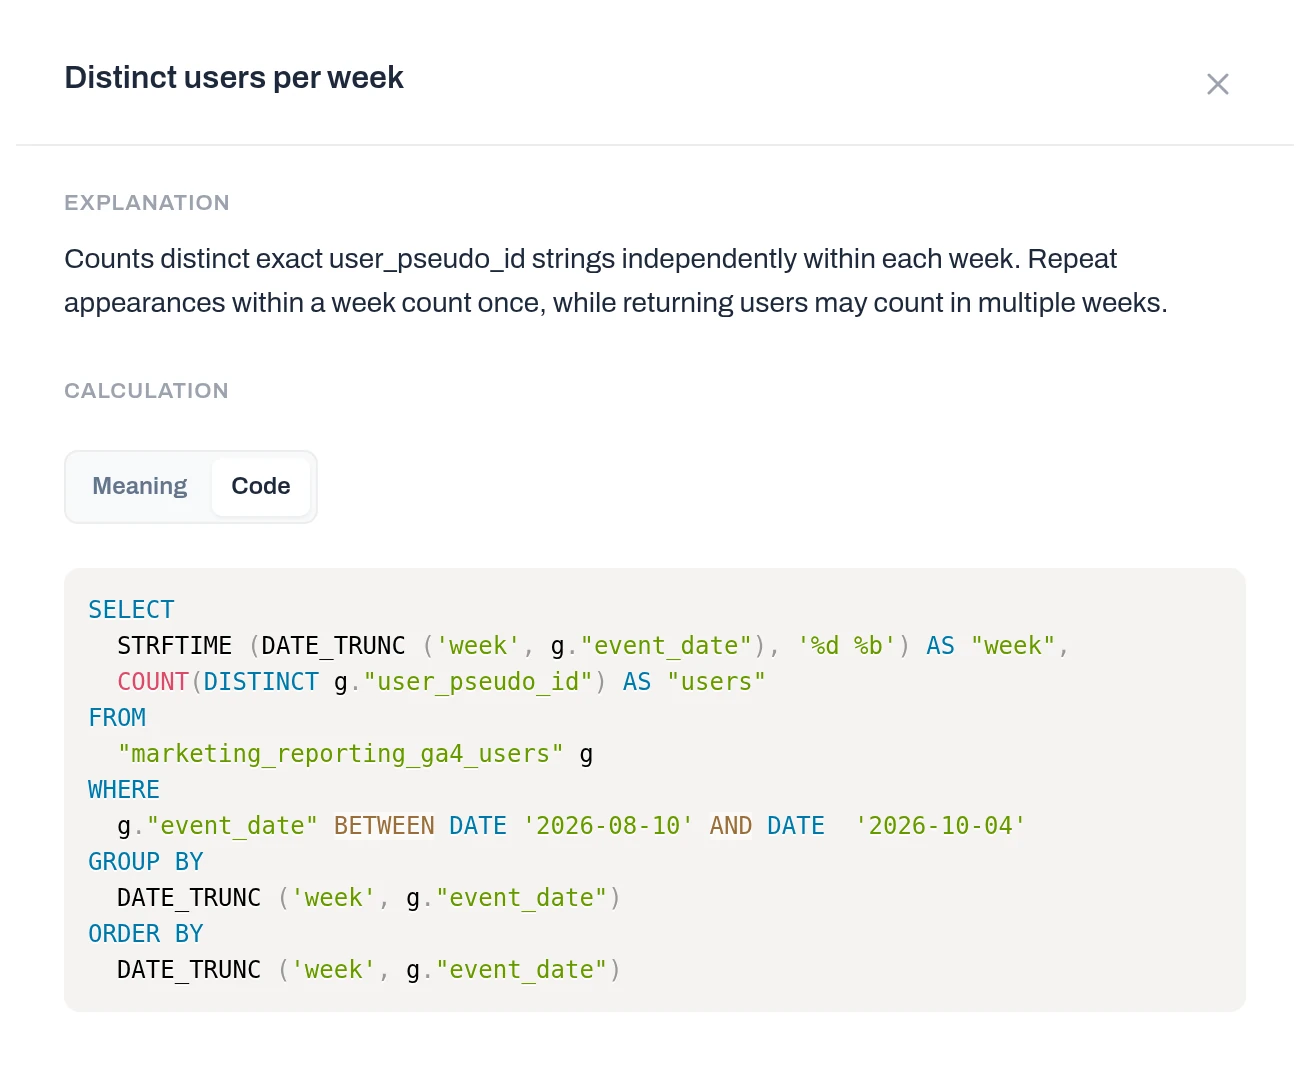
Every tile has View calculation, which explains the number in plain words and shows the query, and View data, which shows the rows. You can also ask Anomaly to verify the whole dashboard: it recomputes each tile from the source tables and lists anything it could not check.
Step 4: Schedule it
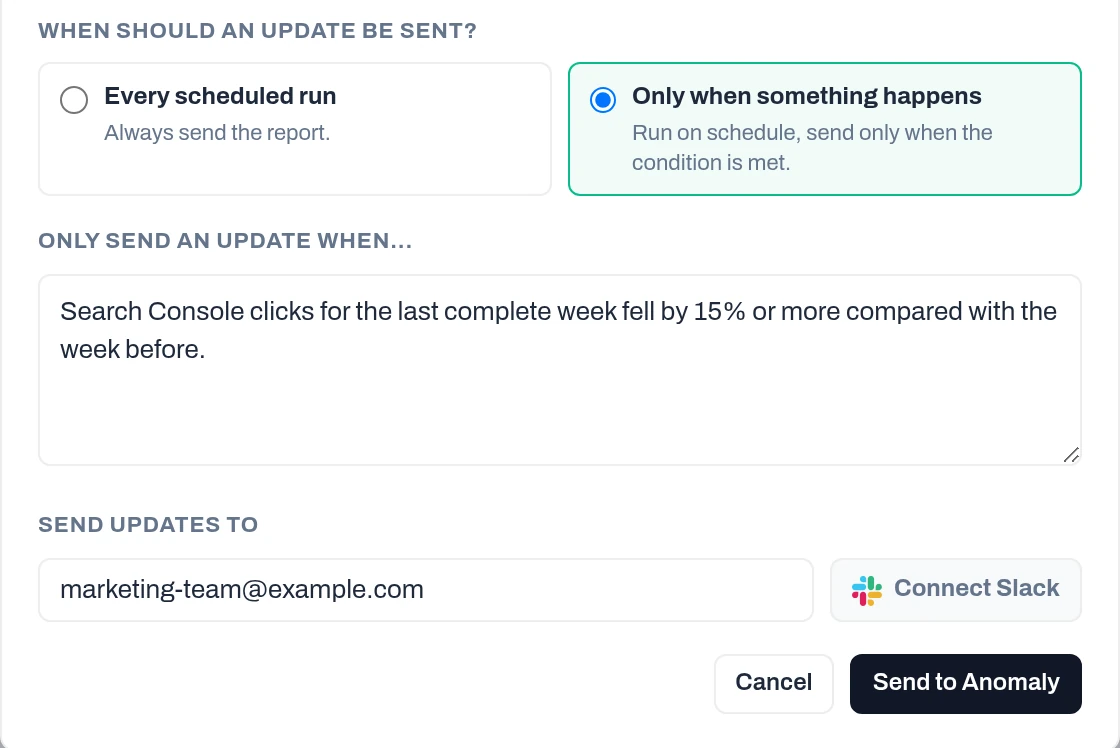
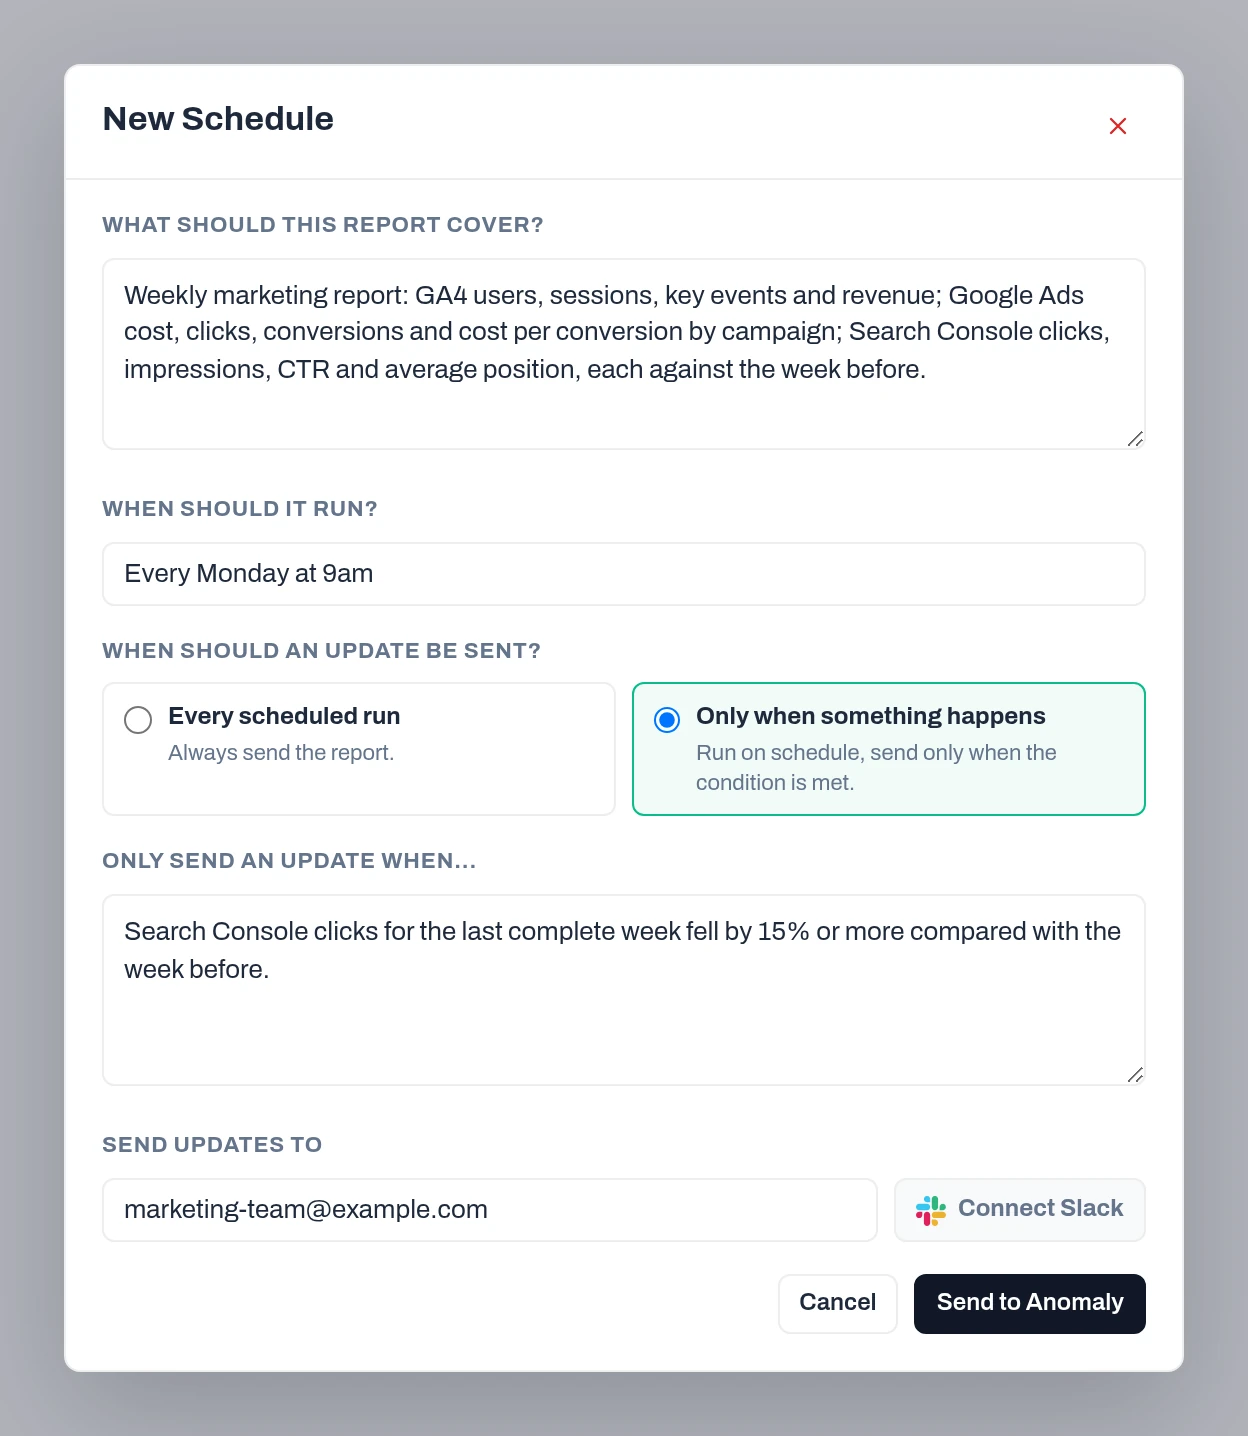
Open Schedule on the dashboard. Describe what the report covers and when it runs, add email recipients or connect Slack, and choose whether to send on every run or only when something happens. Scheduled reports are on Pro and above.
Outputs
What you get
The same report, in the form each reader needs: a dashboard for the team, a file for the client, a message on a fixed day.
Interactive dashboard
Headline numbers, weekly trends and tables in one place. Ask for changes in plain English and refresh it when new data arrives.
PDF, PowerPoint, Word and Excel
Export the report as a file for a client or a manager. The PDF carries a small “Analyzed using Anomaly AI” footer.
Scheduled email and Slack delivery
Daily, weekly or monthly, to email, Slack or both. Each email carries the PDF and a short written summary.
Share link with an access code
Share the live dashboard by link. New links are password protected, so viewers need the access code you send them.
Saved definitions
Each tile’s calculation is saved in the project’s Calculations library, so next week’s number means the same thing.
MCP for Claude and ChatGPT
Your team’s AI assistant can ask Anomaly for the same numbers through the Anomaly MCP server, on Pro and above. Each question uses credits.
Alerts
Get the report only when a number moves
Anomaly runs anomaly detection on a schedule. Set a scheduled report to Only when something happens and describe the change, threshold or exception in plain words, such as “Search Console clicks fell 15% or more week over week”. Every scheduled run checks that condition and sends the report by email, Slack or both only when it is met. When it is not, nothing is sent.
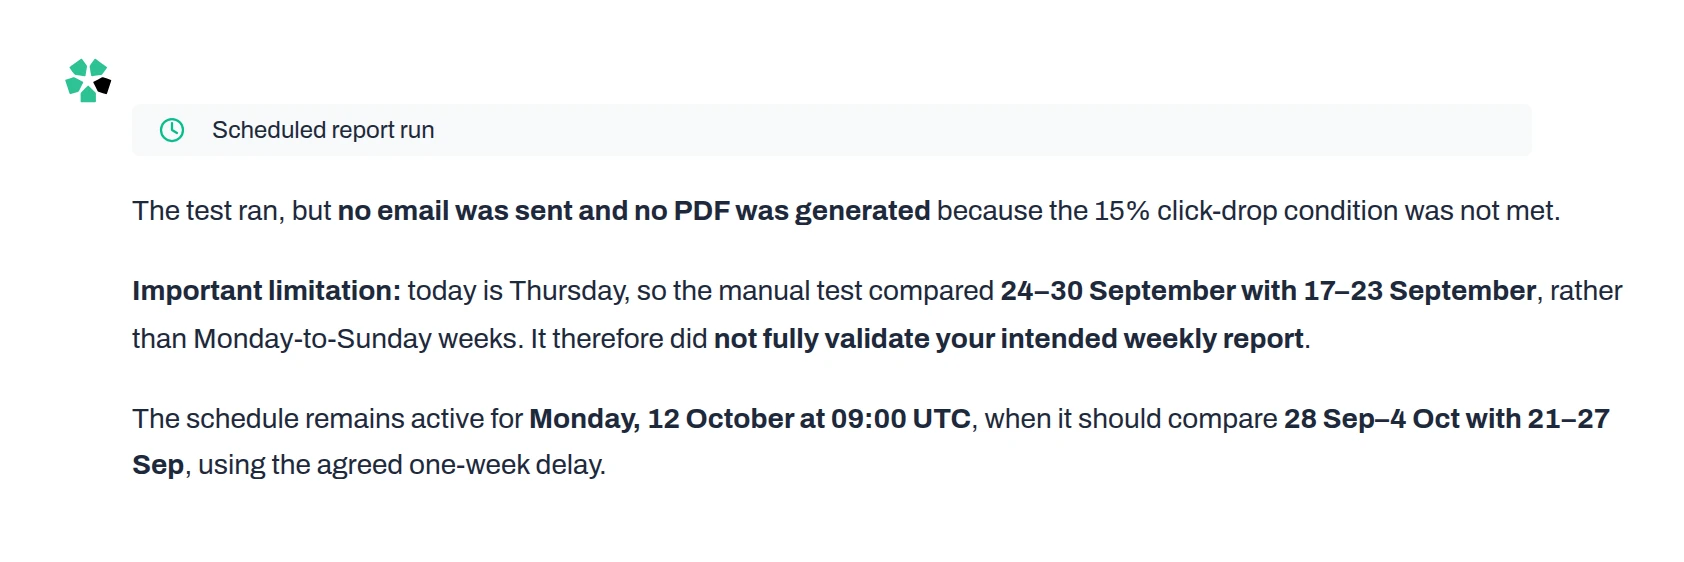
The check runs at the times you schedule, daily, weekly or monthly; it is not a real-time monitor. Anomaly also flags timing risks before a schedule starts: it warned us that a Monday check on the week that ended the day before could show a false drop while Sunday’s data was still arriving, and offered to check the last complete week instead.
Proof
Weekly users, counted the way you defined them
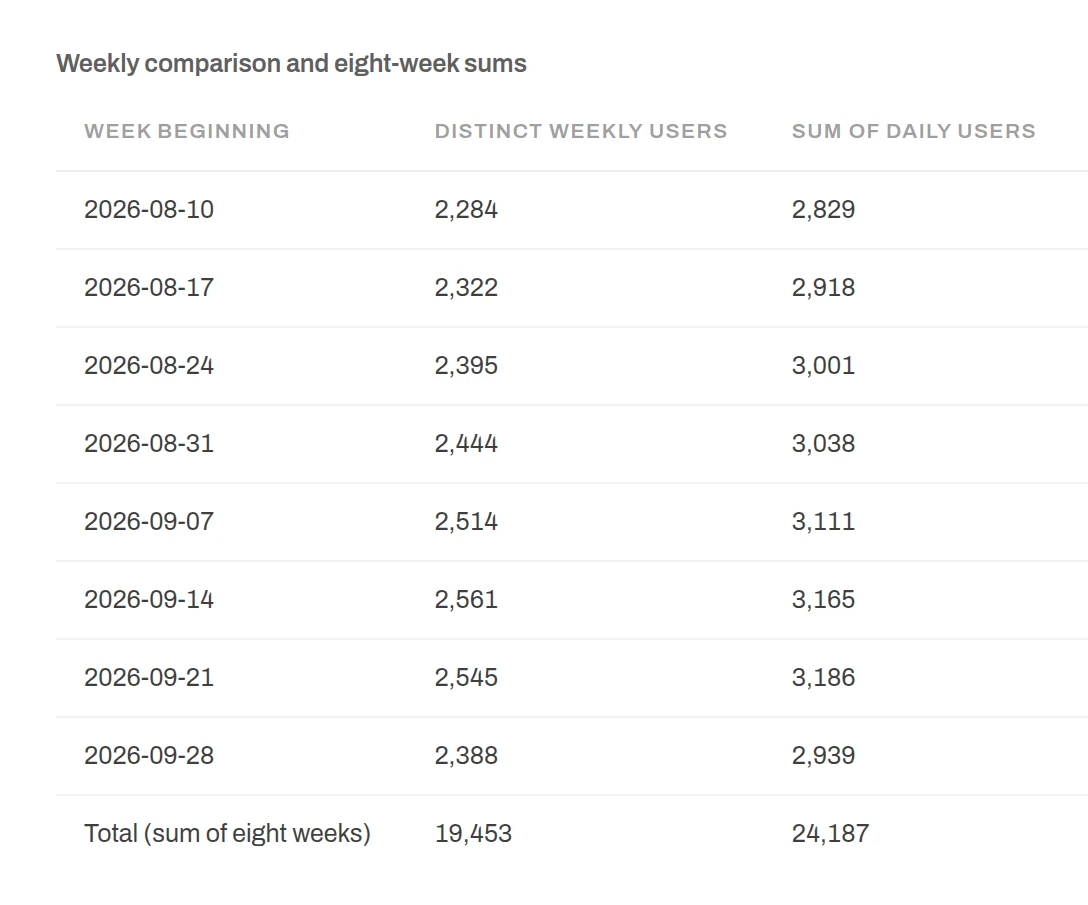
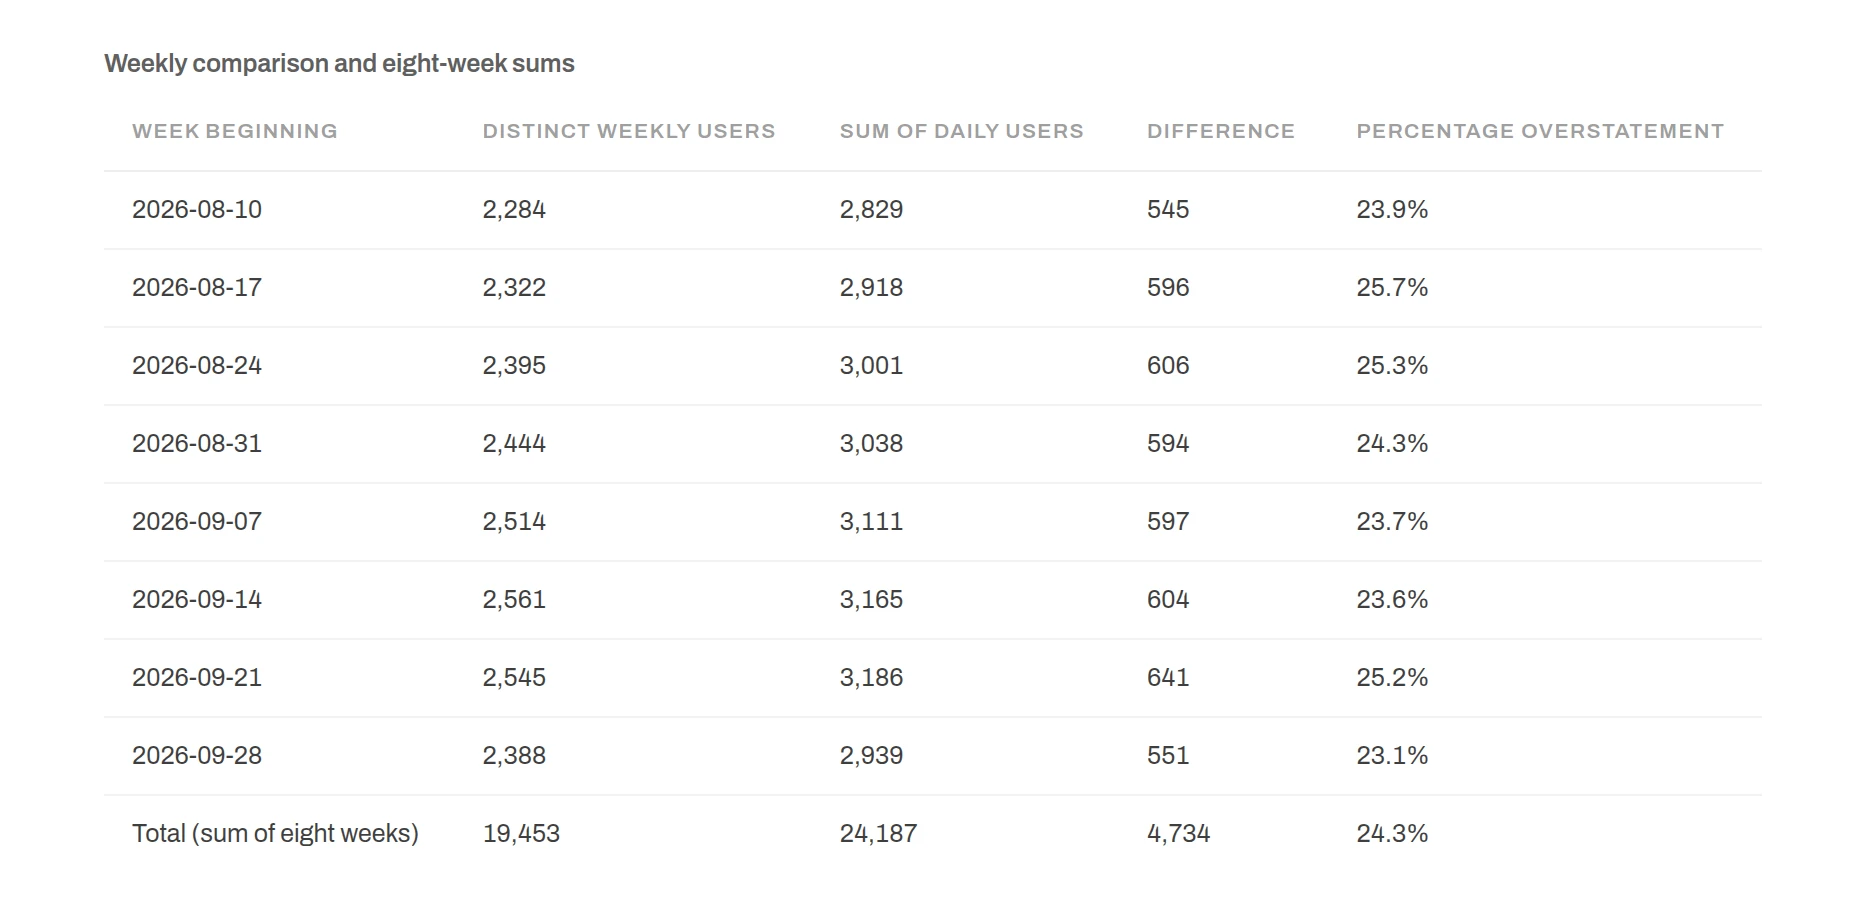
In our sample, adding up daily users overstated weekly users by 24.3% across eight weeks (24,187 against 19,453), because a person who visits on two days is counted twice. Anomaly counted distinct users within each week, as asked, and every row matched our separate Python recount.
Reproduce it with the same synthetic data: the workbook with definitions and the answer key (XLSX), GA4 users by day (CSV, 2.4 MB), Google Ads campaigns by day (CSV) and Search Console queries by day (CSV).
Alternatives
When another kind of tool fits better
Marketing reporting tools fall into a few groups, and the right one depends on the job. Pick by the job below, not by the length of the feature list.
Anomaly AI is our product. The other tools are described from their public product and pricing pages, checked on 8 October 2026; we did not test them hands-on, and they are not scored or ranked. Most of them also charge by client, dashboard or data source as you grow.
Branded client portals for many client accounts
White-label agency reporting
AgencyAnalytics ($20 per client a month, billed annually); DashThis (from $44 a month billed yearly, 3 dashboards); Whatagraph (from $1,118 a month billed annually)
Fits when: Clients log in to a portal with your brand, and you manage dozens of accounts the same way.
Many ad networks fed into Sheets, a BI tool or a warehouse
Marketing data connectors
Supermetrics (from $44 a month billed yearly); Funnel (from $300 a month billed annually)
Fits when: You already build reports in another tool and need many sources piped into it on a schedule.
Do-it-yourself Google dashboards
Dashboard builder
Google Data Studio, formerly Looker Studio (no charge; Pro $9 per user per project a month)
Fits when: Someone on the team builds and maintains the charts, and checking definitions by hand is acceptable.
Checked recurring reports on GA4, Google Ads, Search Console and ad platforms
AI data analysis workspace
Anomaly AI (Pro $25 a month, or $20 a month billed yearly)
Fits when: You want one request to build the report, the query behind each number, and a schedule that can send only when something changes.
Running an agency that needs a white-label marketing reporting platform? Our comparison of client reporting tools for agencies goes deeper. Prices from AgencyAnalytics, DashThis, Whatagraph, Supermetrics, Funnel and Google Data Studio.
Pricing
Plans for recurring reports
Most marketing report software is priced per client, dashboard or data source. Anomaly charges a plan price that includes credits, which pay for what the agent produces, such as a query, a dashboard card or a report.
Free
$0
No card required
- 30 credits every 30 days
- To try the product
- No scheduled reports
Pro
$25 a month
or $20 a month billed yearly
- 1,000 credits a month
- About 150 dashboards
- Scheduled reports and MCP
Analyst
$90 a month
or $72 a month billed yearly
- 4,000 credits a month
- About 600 dashboards
- Everything in Pro
Team
$45 a seat
a month, minimum 2 seats
- 2,000 credits a seat, pooled
- About 300 dashboards each
- Everything in Pro
Enterprise plans are priced to your team. Our whole run, from upload to a scheduled alert, used 17.6 credits; one scheduled run that refreshed the dashboard used 3.5. See full pricing
FAQ
Questions about marketing reporting
What is marketing reporting software?
It pulls data from your marketing channels into one place, calculates the same metrics the same way every time, and delivers the result to the people who need it. Most marketing reporting tools are used for a weekly or monthly report: a dashboard plus a file or message that goes out on a fixed day.
Which data sources can a marketing report use?
GA4, Google Ads, Google Search Console, Meta / Instagram Ads, TikTok Ads, Shopify and HubSpot connect directly. You can also add Google Sheets, Excel via OneDrive, Excel or CSV files up to 1 GB, BigQuery, MySQL, PostgreSQL, Microsoft SQL Server and Snowflake. For other ad networks, upload a CSV or Sheets export.
Does Anomaly do automated marketing reporting?
Yes, on Pro and above. A scheduled report runs daily, weekly or monthly and goes to email, Slack or both, every time or only when a condition you describe is met. Connect your accounts rather than uploading exports, so each run refreshes the data first.
Can Anomaly alert me when a marketing metric drops?
Yes, on a schedule. Set a scheduled report to “Only when something happens” and describe the change, threshold or exception. Every scheduled run checks it and sends the report only when it is met; otherwise nothing is sent.
Is the report real-time?
No. Connected sources refresh before each scheduled run and when you refresh a dashboard; uploaded files stay as uploaded until you replace them. GA4 can take 24–48 hours to finish processing a day, so weekly reports should cover complete weeks.
Can I white-label the reports for clients?
No. Anomaly does not offer white-label client portals, and the PDF carries a small Anomaly footer. Agencies keep one project per client and share a dashboard by link with an access code, or send the PDF. If branded portals matter most, a white-label tool fits better.
How do I check the numbers before a report goes out?
Every dashboard tile has View calculation, which shows what the number means and the query behind it, and View data, which shows the rows. You can also ask Anomaly to verify a dashboard: it recomputes each tile from the source tables and lists anything it could not check.
Build your weekly marketing report
Connect GA4, Google Ads, Search Console or your ad accounts, or upload exports, and ask for the report in one request. Scheduled reports are on Pro and above.