
Turn a GA4 Exploration export into a client-ready dashboard and report
Export your GA4 Exploration as a CSV, upload it to Anomaly, build a dashboard, verify the numbers, and export a stakeholder-ready PDF — with logic you can inspect before you share.
Beginner·6 steps
Before you begin
- — A GA4 Exploration you can export (a free-form exploration works well).
- — An Anomaly account. The free plan covers the core path — upload, build the dashboard, verify the numbers, and export the report. Sharing dashboards and scheduling email reports are Pro-plan features (see pricing).
- — The first dashboard takes the most effort; reusing it later is lighter.
This is a supported, current-product workflow: you upload a file and Anomaly builds and exports the report. It is not real-time monitoring or automatic anomaly detection.
The product screenshots below use synthetic example data to show the workflow. They are not customer results or performance benchmarks.
Export your GA4 Exploration as a CSV
In Google Analytics 4, open the Exploration you use for the report. Use the export icon in the top-right of the exploration and choose CSV. This tutorial uses CSV because it works from an Exploration you already have. If you want the data to refresh or resync instead of re-uploading exports, use Anomaly's GA4 connector or GA4 BigQuery export path. A free-form export may include a few comment/metadata lines at the top and, in some cases, a grand-total row — if yours does, that is expected, and the next steps handle it.
Upload the CSV to Anomaly
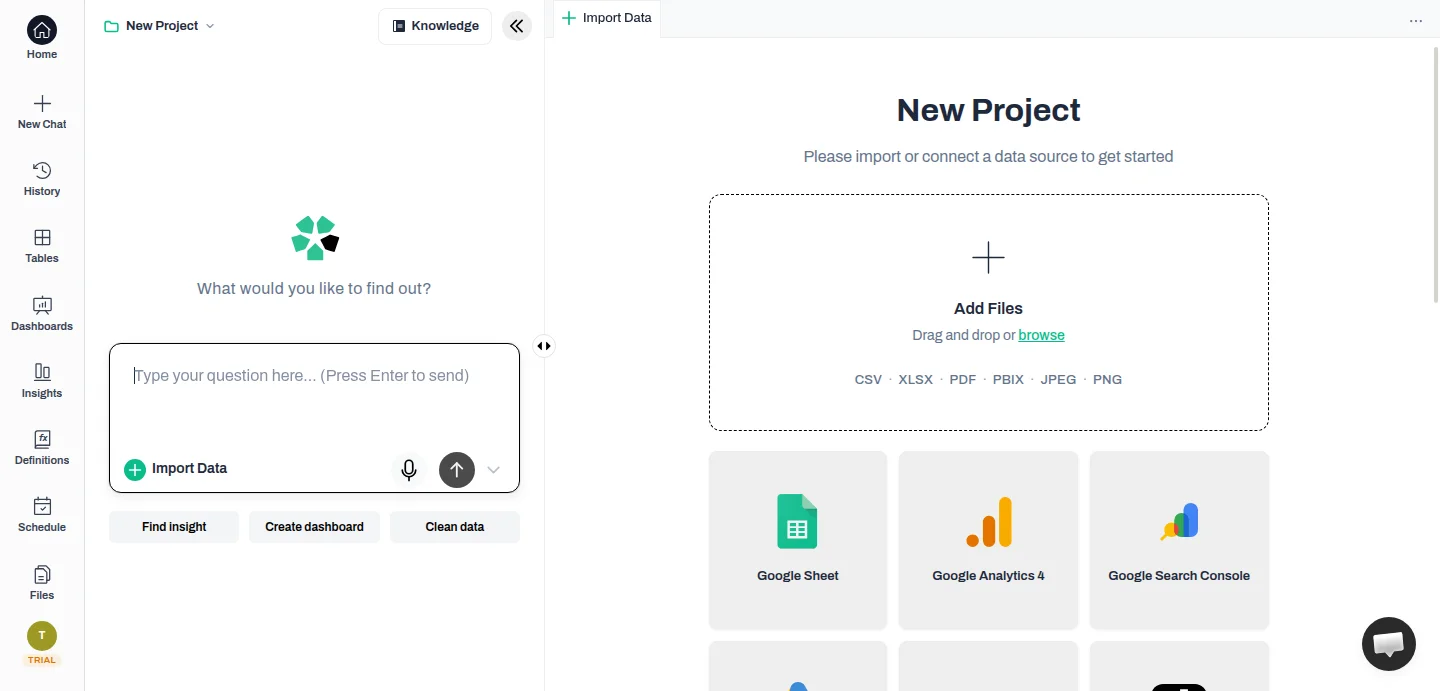
Create a project in Anomaly and upload the exported .csv (uploads are supported up to 1GB). Anomaly reads the GA4 export format directly: it skips any leading comment lines, detects the real header row, parses the dates, and turns thousands like "22,017" into numbers. You do not need to reformat the file first.
Warning — If your export includes a grand-total row (blank dimensions with summed metrics), delete that "Totals" row so a manual total or a labeled totals row cannot double-count.
Ask Anomaly to build a client-ready dashboard
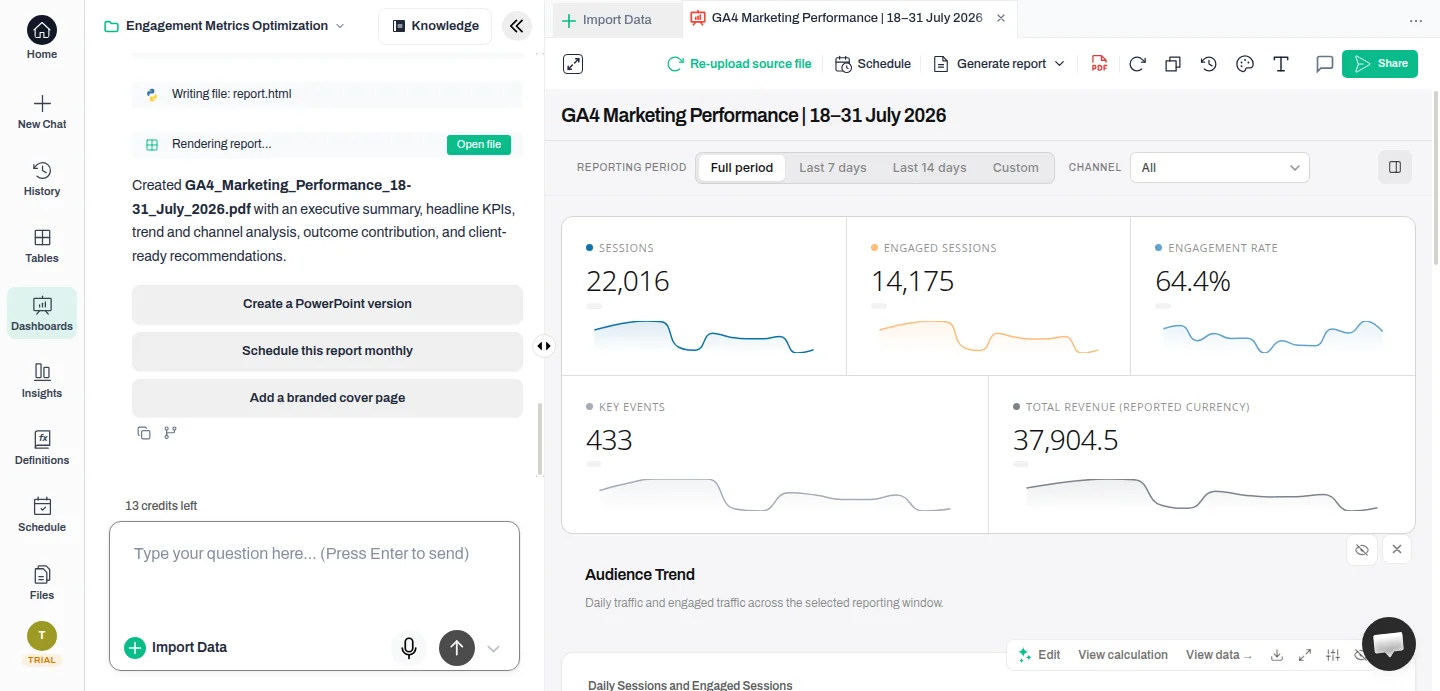
In the chat, ask for the dashboard you want. Anomaly writes the SQL, picks chart types, and assembles a multi-tile dashboard with reporting-period and channel filters.
Build a client-ready marketing performance dashboard from this GA4 export — daily sessions and engaged sessions, sessions by channel, engagement rate by channel, and key events and revenue by channel.
Verify the numbers before you share
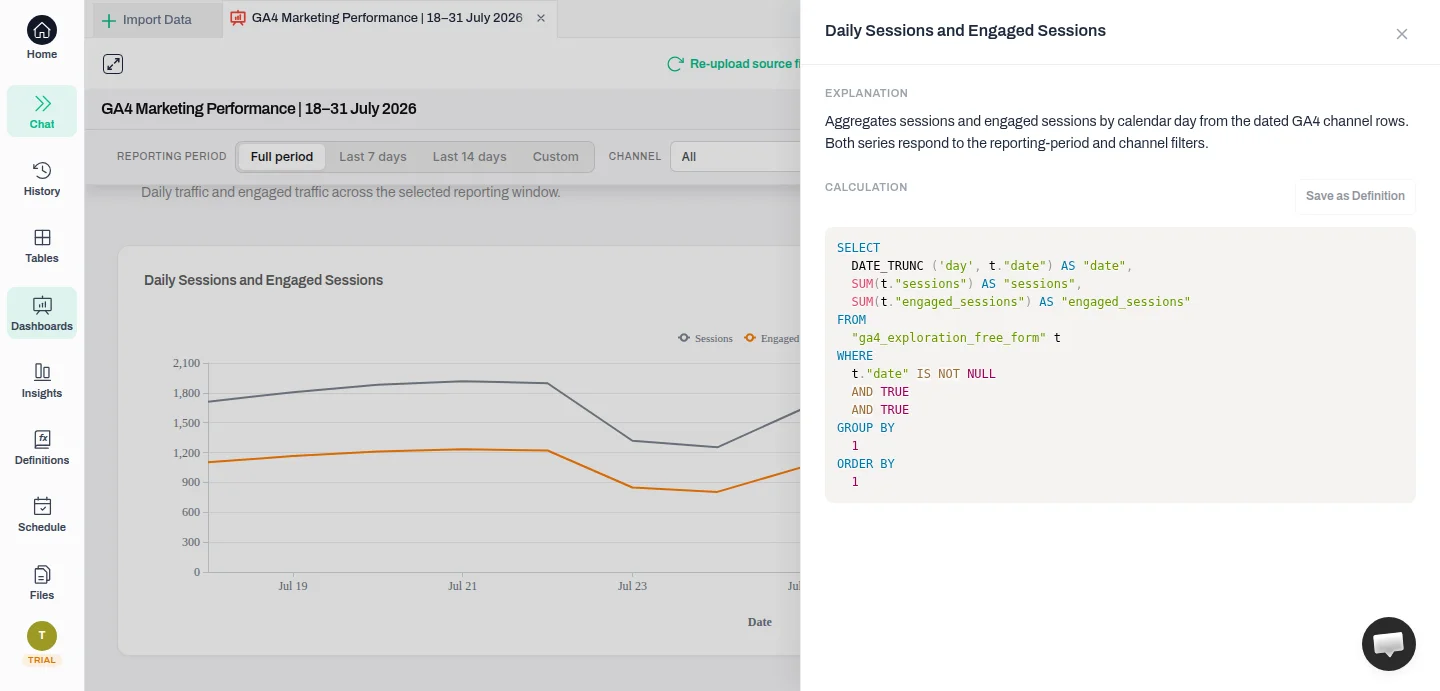
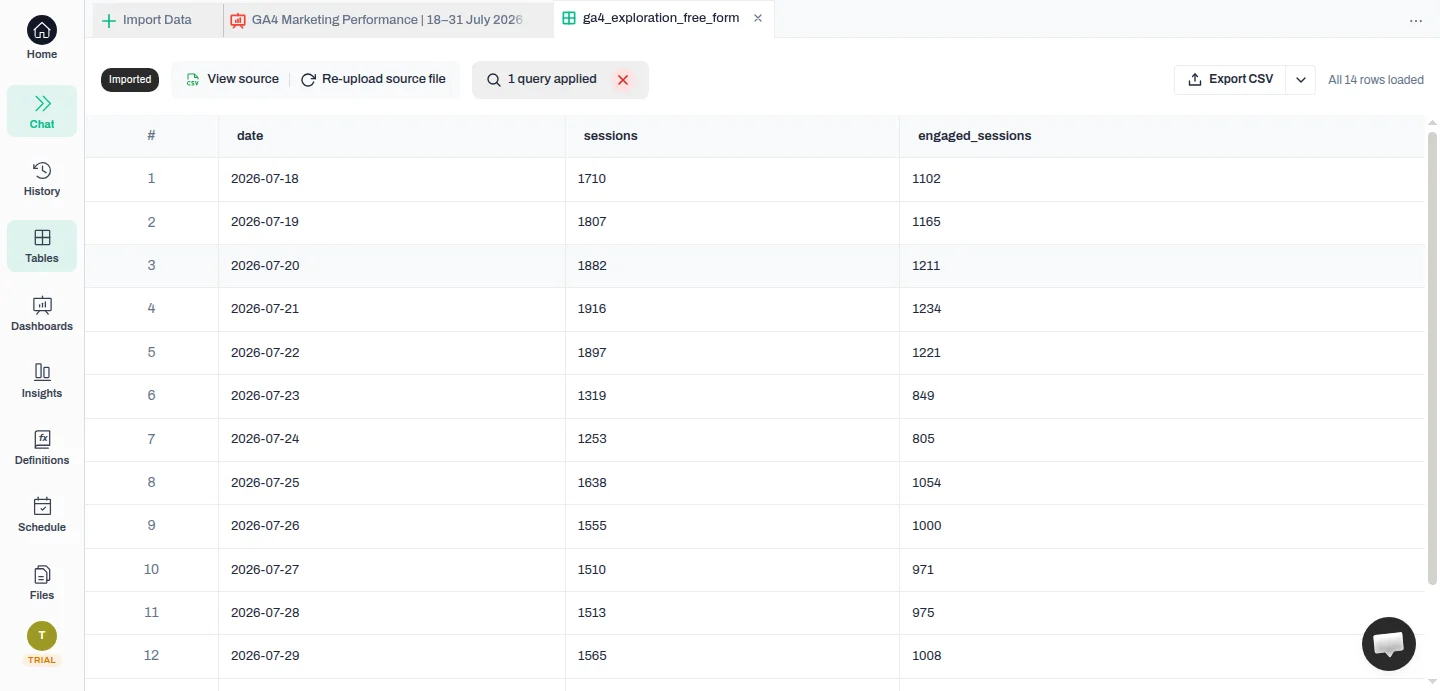
This is the step that makes the report defensible. On any tile, open "View calculation" to read the exact SQL behind the number, and "View data" to see the underlying rows. Confirm the figure reconciles before it goes to a client — for example, that a Sessions total is the sum of the daily rows and does not include the export's grand-total row.
Tip — If your exported columns do not identify a currency, Anomaly labels revenue "reported currency" instead of assuming a symbol. Keep that neutral label until you confirm the property's reporting currency.
Warning — A number can look finished and still be wrong. Reconcile at least one headline figure to its rows before the report leaves your hands.
Generate the report
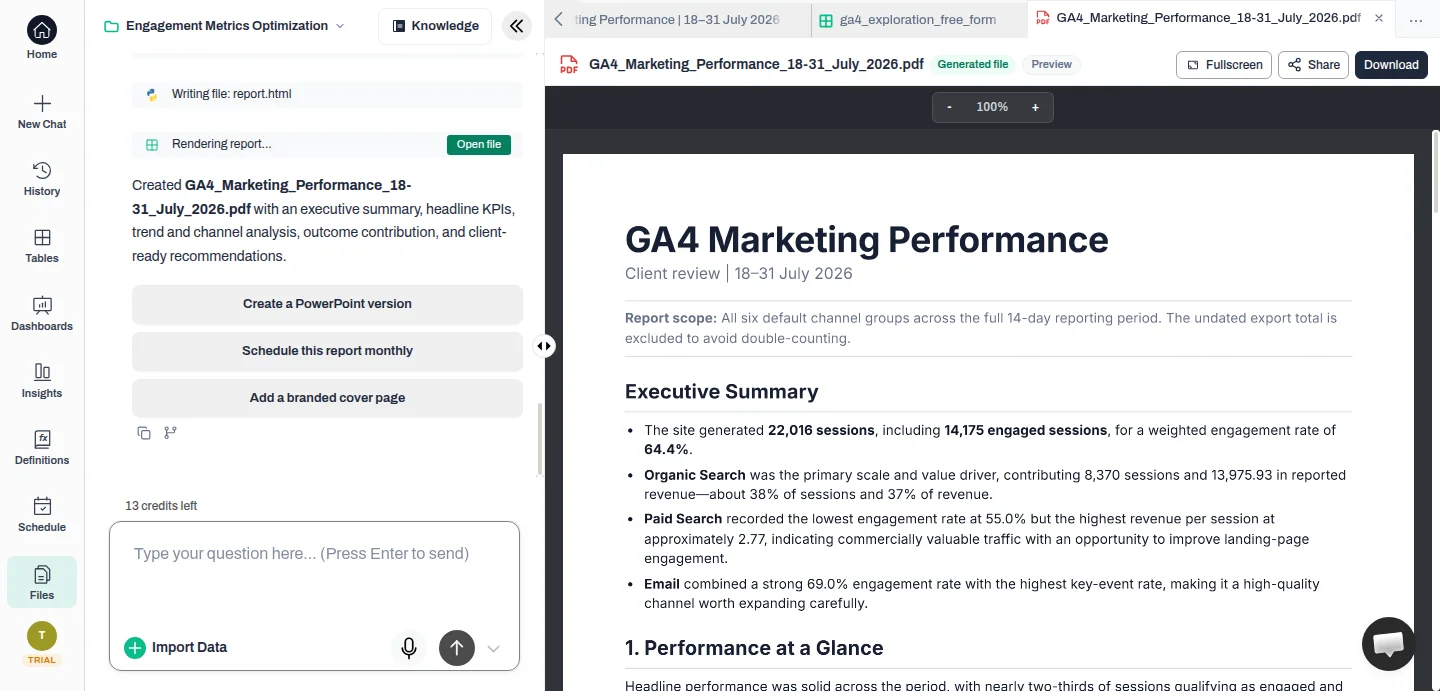
When the dashboard is right, generate the deliverable: use "Generate report", then choose the "PDF report" format for a stakeholder-ready PDF (executive summary, KPIs, and charts). Word and PowerPoint formats are also available. Sharing the dashboard with your workspace and scheduling recurring email reports are Pro-plan features.
Review the generated report before you send it
The report adds a written executive summary and recommendations that were not part of the dashboard you already checked, so review it before it leaves your hands. Open the generated file and reconcile its headline figures, date range, filters, and currency label against the dashboard. Read the narrative and recommendations against the source evidence, and rewrite or remove any statement that asserts a cause the data does not show. Only when the numbers and the words both hold up is the report client-ready — then download or send it.
FAQ
Do I connect GA4 directly, or upload a file?
This tutorial uses a GA4 free-form Exploration exported to CSV and uploaded to Anomaly. Other Exploration types can export to different layouts, so check your export's columns before relying on this exact flow. If you want recurring reporting with refresh or resync instead of repeated uploads, use Anomaly's GA4 connector or GA4 BigQuery export workflow.
Do I need to clean the GA4 export first?
Almost never. Anomaly skips any GA4 comment/metadata header automatically. If your export includes a grand-total row (blank dimensions with summed metrics), delete that "Totals" row so a manual total or a labeled totals row cannot double-count. When you build the dashboard, open "View calculation" on the headline tiles to confirm the query counts the rows you expect and does not fold in a summary row.
Why does revenue show as "reported currency"?
If your exported columns do not identify a currency, Anomaly labels revenue "reported currency" instead of assuming a symbol. Keep that neutral label until you confirm the GA4 property's reporting currency or supply a reviewed currency definition, then note it in your report.
Can I schedule this GA4 report?
Yes, on the Pro plan. You can schedule an email report on a daily, weekly, or monthly cadence. For a dashboard built from an uploaded file, the scheduled report uses the current uploaded data. For recurring GA4 reporting that should refresh or resync from the source, use Anomaly's GA4 connector or GA4 BigQuery export workflow. Delivery is by email.
What's next
- — For one-off reports, re-upload a fresh GA4 export when the data changes. For recurring reports, use Anomaly's GA4 connector or GA4 BigQuery export path so the source can refresh or resync.
- — Save and reuse the dashboard so the next report is lighter than the first.
Ready to Try AI Data Analysis?
Experience AI-driven data analysis with your own spreadsheets and datasets. Generate insights and dashboards in minutes with our AI data analyst.