AI dashboard generators vs interactive data workspaces is not a debate about whether AI can make charts. It can. The real question is whether your team needs a fast visual artifact or a traceable analytical workflow.
Quick answer — AI dashboard generators vs interactive data workspaces
Use an AI dashboard generator when you need a fast prototype, simple KPI view, exploratory chart, or one-off presentation artifact from clean data. Use an interactive data workspace when the source data is messy, metric definitions need review, logic must be inspectable, teams need to iterate, outputs must be exported, or the reporting workflow repeats.
Start With the Job: Dashboard Artifact or Analysis Workspace?
When choosing between AI data tools, the decision comes down to what you are trying to produce: a visual artifact or a traceable analytical environment.
AI-assisted dashboard and report creation is real, useful technology. For teams working inside established business intelligence systems, mature BI copilots can speed up report building. For instance, Microsoft Power BI Copilot helps with report creation, report summaries, conversational data exploration, DAX query development, and semantic-model-backed analysis. Microsoft also notes that reliable AI output depends on data preparation and semantic-model preparation.
Similarly, Tableau Agent helps operators explore data, generate visualizations, suggest analytical questions, select chart types, create and explain calculations, filter, and sort. That assistant works with the context of the connected workbook and data source.
If your data is already clean, modeled, and ready for visualization, an AI dashboard generator can be an excellent way to spin up a quick visual layout.
If the underlying business data is messy, spread across inconsistent spreadsheets, or full of contested definitions, a one-shot dashboard generator is not enough. In that case, you need an interactive data workspace: a place to inspect fields, verify logic, define metrics, keep caveats close to the output, and repeat the workflow. That is the same category distinction behind the broader AI spreadsheet vs AI data analyst workspace question.
AI Dashboard Generators vs Interactive Data Workspaces: Comparison Matrix
Use this matrix as the decision point. The question is not whether dashboard generation is useful. It is whether the dashboard is the whole job.
| Decision factor |
AI dashboard generator |
Interactive data workspace |
Buyer question |
| Best fit |
Clean data, fast prototypes, simple KPI views, one-off presentations. |
Messy data, repeatable reporting, multi-source analysis, inspectable logic. |
Are you making a visual artifact or operating a repeatable workflow? |
| Data readiness |
Works best when data is already cleaned, modeled, and labeled. |
Better when the workflow needs source checks, caveats, and review notes before publishing. |
How much trust do you already have in the source file or model? |
| Source count |
Usually strongest on one clean table, one semantic model, or one prepared report surface. |
Useful when spreadsheets, sheets, warehouse tables, and business exports must be reconciled. |
Is the answer in one source or spread across several? |
| Metric definitions |
Often inherits existing fields, model definitions, or inferred labels. |
Lets teams define and review metrics, assumptions, and business rules close to the analysis. |
Will someone challenge what the metric means? |
| Logic review |
The final dashboard may be easier to see than the logic behind it. |
The logic, filters, joins, assumptions, and source fields can be inspected before sharing. |
Can a reviewer trace the number back to its source? |
| Data quality review |
May display clean-looking charts from imperfect data. |
Can keep completeness, duplicate, date-window, and caveat checks beside the analysis. |
What data problems need to travel with the output? |
| Collaboration |
Good for sharing the finished visual. |
Better for shared review of definitions, logic, caveats, and output packaging. |
Do teammates need to edit the logic or only view the result? |
| Interactivity |
Standard dashboard filters and visual exploration. |
Follow-up questions, source inspection, logic review, and output iteration in one place. |
Does the team need to ask why, or only see what happened? |
| Export types |
Often dashboards, images, PDFs, or platform-native reports. |
Dashboards, business reports, source-backed summaries, and exports where the workflow needs them. |
Is the dashboard the final deliverable or just one output? |
| Scheduled reporting |
Helpful when the BI platform already supports the reporting cadence. |
Useful when the repeatable workflow also needs definitions, review notes, and output packaging. |
Will this become a weekly or monthly report? |
| Governance |
Depends on the host BI or dashboard platform. |
Depends on source-backed calculations, metric definitions, and business rules. |
Where will trust live: in the model, the dashboard, or the workflow? |
| One-off prototype fit |
Excellent. |
Usually more setup than a quick visual mockup needs. |
Is this a throwaway visual or a reusable reporting asset? |
Use an AI Dashboard Generator When Speed Matters More Than Repeatability
An AI dashboard generator is a strong choice when speed, presentation, and quick visualization are the primary goals. If your data is already structured, clean, and hosted in one place, AI-generated dashboards can be the fastest path to a finished visual.
They fit best when you need:
- A quick prototype: Build a draft layout to show stakeholders what a final dashboard might look like.
- A simple KPI view: Track standardized metrics such as daily signups, total sales, or weekly spend from a single trusted source.
- Exploratory charts: Use conversational commands to plot variables, swap chart types, or test visual approaches.
- A one-off presentation artifact: Create a polished visual for a meeting when the underlying data does not need a full review workflow.
- Visual idea testing: Ask the tool to suggest ways to display a known dataset.
That is real value. The Tableau Agent documentation shows the direction clearly: AI can suggest analytical questions, build visualizations, choose chart types, create calculations, and filter views. Power BI Copilot similarly supports report authoring, summaries, and data questions inside a prepared Power BI environment.
The key phrase is prepared environment. Dashboard generation is strongest when the source data and definitions are already stable enough that the visual layer can move quickly.
Use an Interactive Data Workspace When the Logic Needs Review
Dashboard generators are useful for presentation. They are not designed to own every part of messy analytical work.
When the steps behind the metric matter as much as the chart itself, use an interactive data workspace. That usually means:
- The source data is messy: You need to inspect missing values, duplicate rows, inconsistent headers, date formats, or stale exports.
- Multiple sources must be reconciled: The answer depends on spreadsheets, Google Sheets, warehouse tables, CRM exports, GA4 exports, or finance files.
- Metric definitions are contested: Revenue, active customer, churn, qualified lead, and conversion may all need business rules.
- Logic must be inspectable: A manager, client, analyst, or finance reviewer needs to see which filters, joins, and calculations were used.
- The workflow repeats: The same report has to run again next week or next month without reinventing the whole process.
The importance of defined metrics is not theoretical. Google Looker Conversational Analytics uses Looker's semantic model, including LookML definitions, as the source of truth for business concepts such as revenue or churn. That is the point: conversational analytics becomes more reliable when the definitions are explicit.
The broader analytics category shows the same pattern. Hex describes itself as a collaborative workspace for data science and analytics, combining SQL, Python, no-code, AI assist, data apps, reports, collaboration, versioning, and the feedback loop between published artifacts and underlying logic. Its AI docs also describe AI assistance inside the analysis workflow rather than only at the finished-chart layer.
That is the practical difference. A generator helps make the chart. A workspace helps defend the number.
Why Messy Data Breaks One-Shot Dashboard Generation
The biggest limitation of one-shot dashboard generation is not visual quality. It is assumption quality.
Business data rarely arrives as one perfect table. It arrives as an export from a CRM, a finance workbook, a product event table, a campaign sheet, a manually refreshed CSV, and a renamed file someone sent five minutes before the meeting. A dashboard generator can make that look tidy. It cannot magically know which assumptions are safe.
Common failure points include:
- Inconsistent headers: Client_ID in one export, customer_id in another, and Account in a third.
- Duplicate IDs: Multiple rows for the same customer, deal, shipment, student, campaign, or invoice.
- Missing rows: Blank dates, dropped transactions, incomplete weekly exports, or partial backfills.
- Conflicting definitions: One team counts booked revenue, another counts collected revenue, another counts net revenue.
- Merged exports: Manual trackers combined with database extracts, each with different grain and update cadence.
- Stale extracts: A dashboard that looks current but is built from last week's file.
The GOV.UK Data Quality Framework is useful here because it names the dimensions teams actually need to check: completeness, uniqueness, consistency, timeliness, validity, and accuracy. It also emphasizes caveats, metadata, and explaining data processing decisions so users can judge whether data is fit for purpose.
That is exactly why a workspace matters. The goal is not to slow the team down with process. The goal is to stop a polished dashboard from laundering uncertain data into confident-looking charts.
If your work starts from messy source files, borrow the intake discipline from repeatable client dashboards from messy CSVs: validate the source, map the fields, define the metric, document the caveat, then build the output.
Where Anomaly Fits: Full Dashboards Inside a Traceable Workspace
Anomaly AI can build full dashboards, but that is not the whole story. The stronger reason to use Anomaly is that the dashboard lives inside a verifiable AI data analysis workspace.
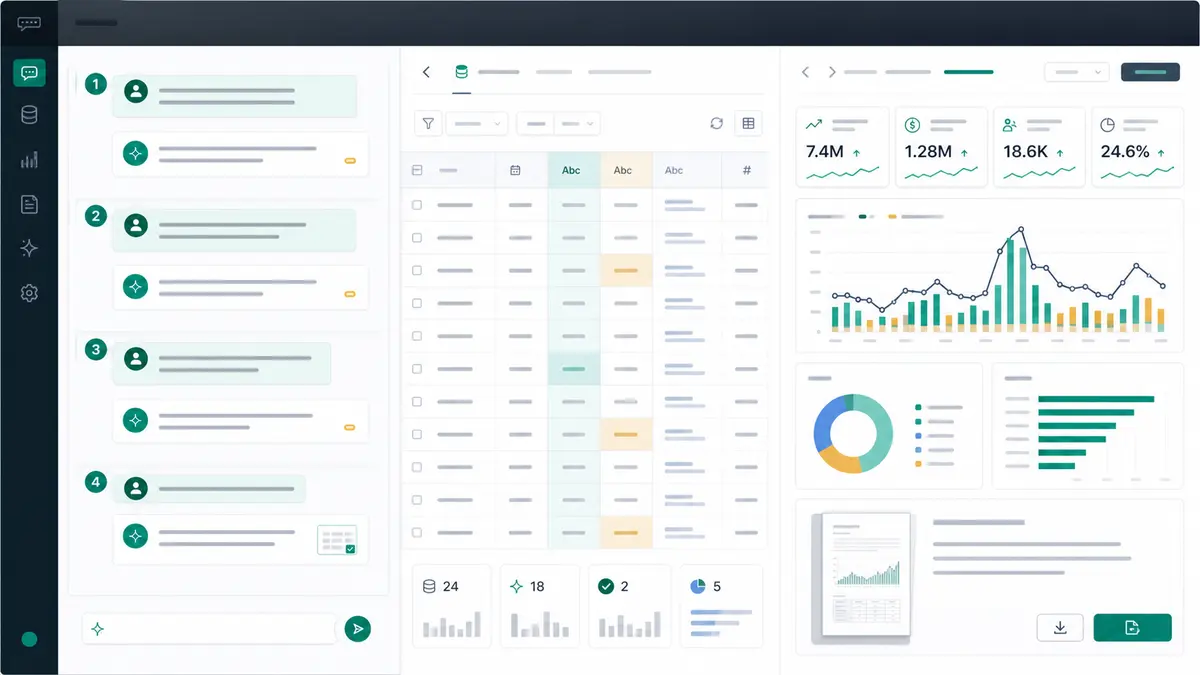
In Anomaly, the workflow can start with uploaded or connected business data. Supported uploads include .xlsx, .xls, and .csv files up to 1GB. Available source workflows include Excel/CSV uploads, Google Sheets, GA4, BigQuery, Snowflake, and MySQL where available. The supported Anomaly connectors page is the best starting point for source coverage.
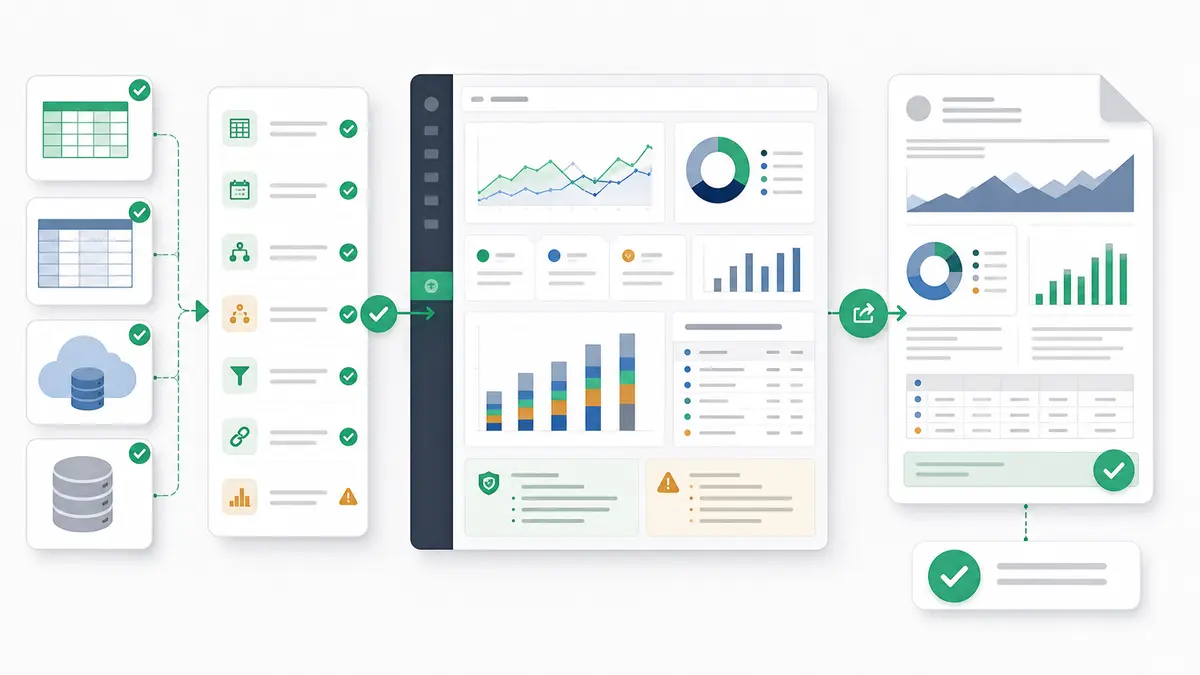
From there, the workflow is reporting-first:
- Upload or connect the data.
- Ask for the dashboard you need.
- Inspect the source fields, filters, joins, and generated logic.
- Define the metric definitions and business rules that should govern the analysis.
- Turn the result into an interactive dashboard, business report, source-backed summary, export, or scheduled reporting workflow where supported.
That matters because many business reporting jobs do not end at the first dashboard. A team lead needs the same KPI packet every week with the same definitions. A consultant needs caveats and source notes to travel with the deliverable. A finance reviewer needs numbers that can be traced back to source.
Anomaly is built for that review layer: traceable analysis, source-backed calculations, metric definitions, business rules, and logic your team can inspect. It is not a real-time monitor, an automatic anomaly detector, a guaranteed root-cause engine, a spreadsheet editor, a DAX or Power Query clone, a warehouse replacement, a Parquet uploader, a live OneDrive/SharePoint sync layer, a SOC 2-complete product, or a Slack/webhook/SMS alerting tool.
Use Anomaly when the dashboard needs to survive review, not just look finished.
Buyer Checklist Before You Choose
Before selecting a tool, run through this checklist.
- Data readiness: Is the source already clean, modeled, and documented? If yes, a dashboard generator may be enough. If no, use a workspace.
- Source count: Is the answer in one table or spread across spreadsheets, sheets, databases, and exports?
- Metric challenge: Will someone question what the metric means? If yes, definitions and business rules need to be visible.
- Logic inspection: Does a reviewer need to trace filters, joins, date windows, and formulas before sharing?
- Output type: Is the dashboard the final asset, or do you also need exports, source-backed summaries, PDFs, or scheduled reports?
- Repeat cadence: Is this a one-off presentation, or will the same reporting workflow run weekly or monthly?
- Enterprise BI needs: Do you need certified semantic models, organization-wide BI governance, and centralized admin? If yes, a governed BI platform may still be necessary.
- Caveats: What caveats need to travel with the output so readers do not overtrust the chart?
The answer may be mixed. A dashboard generator can be perfect for the first visual draft. An interactive workspace becomes necessary when the workflow turns into repeated decision support. That is also why some advanced Excel workflows move faster in Anomaly AI: the value is not the chart alone, but the verifiable workflow around it.
FAQs About AI Dashboard Generators and Interactive Data Workspaces
What is an AI dashboard generator?
An AI dashboard generator uses natural language or AI assistance to create charts, KPI layouts, and dashboard views from a dataset. It is best for fast visual prototyping, clean data, simple KPI views, and one-off presentation artifacts.
What is an interactive data workspace?
An interactive data workspace is an environment where teams can inspect, analyze, define, and package data work before sharing it. It keeps source data, logic, assumptions, metric definitions, outputs, and review notes closer together than a one-shot dashboard generator.
When is an AI dashboard generator enough?
An AI dashboard generator is enough when the source data is already clean, the metric definitions are stable, the visual is mostly exploratory, and the output is a one-off dashboard or presentation artifact.
When do you need an interactive data workspace?
You need an interactive data workspace when data is messy, sources need reconciliation, definitions are debated, logic must be reviewed, or the reporting workflow repeats. That is where the workspace protects the dashboard from becoming a polished view of uncertain logic.
Can Anomaly build dashboards?
Yes. Anomaly can build complete interactive dashboards. The important distinction is that Anomaly builds dashboards inside an AI data analysis workspace where teams can inspect source fields, verify the logic, define business rules, and package the result into stakeholder-ready formats.
Does Anomaly replace BI tools?
No. Anomaly does not replace governed enterprise BI, semantic models, warehouse architecture, or real-time operational monitoring. It is better understood as an AI data analysis workspace for teams that need verifiable dashboards, reports, exports, and repeatable reporting workflows from uploaded or connected business data.
Build the Dashboard Where the Logic Can Survive Review
AI dashboard generators are valuable when the data is clean and the job is a fast visual artifact. Use them for prototypes, simple KPI views, exploratory charts, and presentation drafts.
Interactive data workspaces matter when the dashboard has to stand up to questions. Where did this number come from? Which source was used? What date window is included? What business rule defines the metric? What caveat should the reader see before acting on the chart?
That is the real distinction in AI dashboard generators vs interactive data workspaces. The generator creates the visual. The workspace helps the logic survive review.
If you need dashboards, reports, exports, and scheduled reporting workflows that keep source checks and metric definitions close to the output, get started with Anomaly.