The fastest way to choose between an AI spreadsheet and an AI data analyst workspace is to ask what the unit of work is. If the work happens inside cells, keep the spreadsheet. If the work is a business question that needs larger files, multiple sources, inspectable logic, dashboards, and refreshed reporting, you need a workspace built around analysis.
Quick answer — AI spreadsheet vs AI data analyst workspace
Use an AI spreadsheet when the job is still cell-first: formulas, edits, small tables, quick cleanup, and familiar spreadsheet collaboration. Use an AI data analyst workspace when the job needs larger files, multiple sources, repeatable business logic, traceable analysis, dashboards, reports, exports, or scheduled stakeholder outputs. A spreadsheet helps you work in cells; a workspace helps you turn data into a reviewed business answer.
This distinction matters because AI is now appearing in almost every data surface. That does not mean every surface should be used for the same job. An AI spreadsheet can make formulas, summaries, formatting, and small-table analysis faster. A data analyst workspace is designed for the work that comes after the spreadsheet starts becoming fragile: source joins, metric definitions, business rules, audit trails, dashboards, exports, and recurring reporting.
What an AI Spreadsheet Is Good At
An AI spreadsheet is built on a cell-first foundation. It is the right tool when you need to make direct edits, write or explain formulas, clean up small tables manually, and collaborate in a familiar grid.
That is where spreadsheet-native AI is useful. Copilot in Excel can help create and understand formulas, analyze data for insights, and import outside data. Microsoft's Copilot Excel insights guidance also says Excel can surface insights as charts, PivotTables, summaries, trends, or outliers. Gemini in Google Sheets can create tables and formulas, generate analysis and insights, build charts and graphs, create pivot tables, format, sort, filter, find and replace, and perform spreadsheet actions.
Those are valuable jobs. If your team already lives in Excel or Sheets, AI can reduce the friction around everyday Excel data analysis and Google Sheets data analysis. It can help a marketer build a cleanup formula, help an operator summarize a tab, or help a consultant make a quick chart before a call.
But the grid still has boundaries. Microsoft's official Excel specifications and limits list 1,048,576 rows by 16,384 columns per worksheet, and open workbooks are still limited by available memory and system resources. Google says Google Sheets supports up to 10 million cells or 18,278 columns for Sheets created in or converted to Sheets, including Excel and CSV imports.
Those limits do not make spreadsheets bad. They define the job they are best at: flexible, human-editable, cell-level work.
What an AI Data Analyst Workspace Is For
An AI data analyst workspace starts from a different premise. The goal is not to make cell editing more convenient. The goal is to turn business data into a reviewed answer, report, dashboard, or repeatable workflow.
That matters when the analysis becomes larger than one sheet. You may have a CSV that strains Excel, a workbook with several tabs, a Google Sheet refreshed by another team, GA4 data, a BigQuery table, or a MySQL/Snowflake source that needs to be compared with uploaded files. At that point, the hard part is not typing a formula. The hard part is keeping source definitions, joins, filters, assumptions, and outputs consistent enough for someone else to trust.
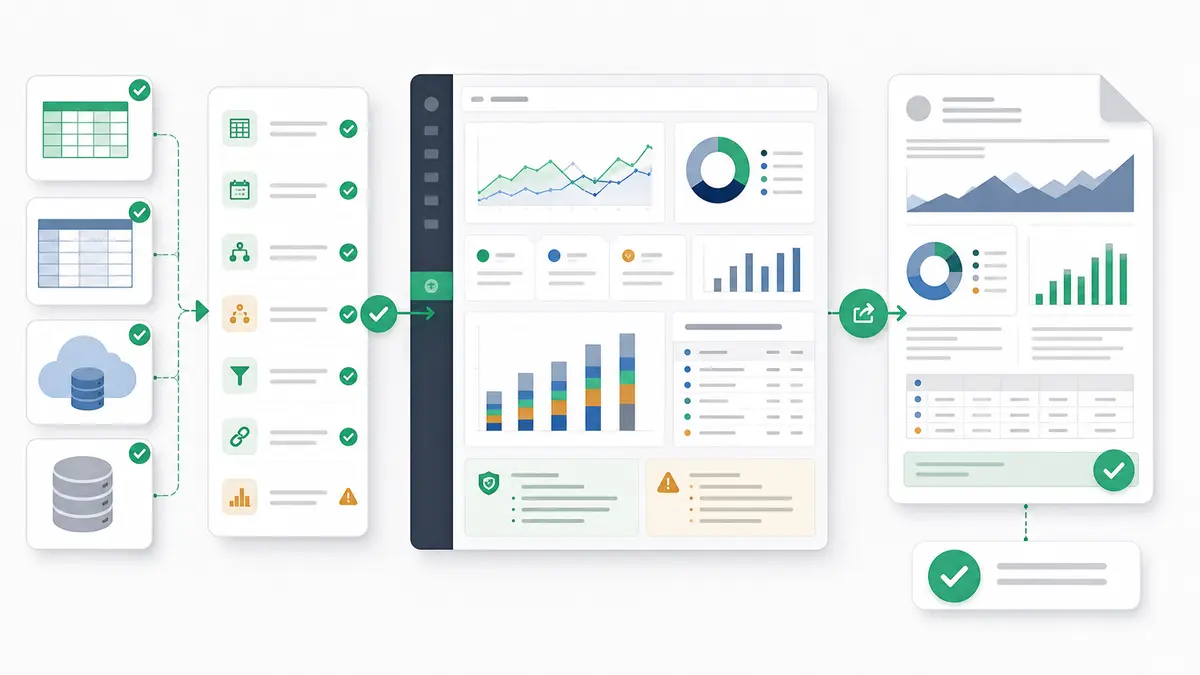
A data analyst workspace is designed around repeatable logic. Instead of hiding a critical calculation across thousands of cells, the workflow should make the logic inspectable. Instead of manually copying a chart into a slide every week, the workflow should produce stakeholder-ready outputs. Instead of asking one spreadsheet to be a database, reporting layer, audit trail, and presentation tool at the same time, the workspace keeps the analysis environment separate from the output.
That does not mean every spreadsheet should become a workspace. It means the moment your question depends on larger files, multiple sources, metric definitions, business rules, and repeatable reporting, the spreadsheet is no longer the safest center of gravity.
AI Spreadsheet vs AI Data Analyst Workspace: Comparison Matrix
| Decision factor |
AI spreadsheet fit |
AI data analyst workspace fit |
Review question |
| Best fit |
Cell-first work: formulas, edits, formatting, small tables, and quick summaries. |
Analysis-first work: larger files, multi-source questions, repeatable logic, and stakeholder outputs. |
Is the main task editing cells or answering a business question? |
| Data size |
Works well while the file stays within spreadsheet limits and performance remains acceptable. |
Better when files are large enough that spreadsheet performance, crashes, or manual cleanup become a risk. |
Is file size now changing how the team works? |
| Source count |
Best for one workbook, one table, or a small set of manually managed tabs. |
Better for uploaded files plus connected sources such as Google Sheets, GA4, BigQuery, MySQL, or Snowflake where available. |
Are people copying data between exports to make the answer? |
| Formulas and cells |
Strong when the deliverable is a formula, edited cell, or grid-native model. |
Not meant to clone spreadsheet formulas; stronger for source-backed analysis and reusable business logic. |
Does the answer need a formula, or does it need an auditable workflow? |
| Collaboration |
Familiar for cell-level co-editing, comments, and manual review. |
Better when the team needs inspectable logic, shared outputs, and repeatable reporting assets. |
Are reviewers checking cells, or checking conclusions and assumptions? |
| Auditability |
Often depends on tracing formulas, hidden tabs, manual edits, and cell references. |
Designed for traceable analysis, verifiable outputs, inspectable logic, and source-backed calculations. |
Can another person verify how the number was produced? |
| Business logic |
Usually spread across formulas, notes, tabs, and analyst memory. |
Better for explicit metric definitions, business rules, and repeatable reporting workflows. |
Where do definitions live after the meeting ends? |
| Outputs |
Grids, charts, pivot tables, and manually assembled exports. |
Dashboards, business reports, source-backed summaries, and exports where the workflow needs them. |
Does the stakeholder need a sheet, or a finished output? |
| Scheduled reporting |
Usually manual: refresh, inspect, export, send. |
Better for recurring reporting workflows where the data source and workflow support scheduling. |
Is this a one-time analysis or a recurring operating cadence? |
| When a spreadsheet is still enough |
One clean table, bounded question, light editing, quick formulas, and manual review are acceptable. |
Not necessary if the spreadsheet is still simple, fast, and easy to verify. |
Would a workspace add clarity, or just ceremony? |
| When BI or a warehouse is warranted |
Not the right layer for governed company-wide semantic models or production ETL. |
Useful before heavy BI when the team needs repeatable, source-backed outputs without building a full BI stack. |
Is the organization solving one recurring workflow, or standardizing analytics for many teams? |
Use an AI Spreadsheet When the Work Is Still Cell-First
Use an AI spreadsheet when the spreadsheet itself is the work surface. That sounds obvious, but it is the most common place teams overcomplicate the tooling decision.
Stick with an AI spreadsheet when you need to:
- Write, debug, or explain formulas.
- Clean a small table with manual judgment.
- Format rows and columns for a human reviewer.
- Build a quick chart or pivot-style summary.
- Change assumptions directly in cells.
- Collaborate inside an existing spreadsheet workflow.
- Deliver the result as a workbook or Sheet.
This is especially true when the data is small enough, the source count is low, and the analysis is not meant to become a recurring operating process. A quick weekly tab, a one-off budget model, a sales ops cleanup file, or a simple client workbook does not need a heavier layer just because AI is available somewhere else.
The caution is that "still works" and "safe to rely on" are not the same thing. If a workbook has become slow, full of fragile formulas, dependent on hidden tabs, or hard to explain to a stakeholder, the team may already be asking the spreadsheet to do too much.
Use an AI Data Analyst Workspace When the Work Has Outgrown Cells
Use an AI data analyst workspace when the work has become a repeatable analysis problem, not just a spreadsheet task. This is the point where the question starts to involve multiple files, recurring data refreshes, stakeholder outputs, and definitions that need to survive beyond one analyst's memory.
Common signs include:
- Excel crashes, slows down, or becomes unreliable on larger files.
- CSVs, workbooks, and Sheets need to be compared or joined.
- The same analysis is repeated before every meeting.
- Stakeholders ask for the "same report" with refreshed numbers.
- Metric definitions are debated after the output is shared.
- The final deliverable is a dashboard, report, export, or narrative summary rather than a grid.
- Reviewers need to understand the logic, not just see the result.
For a narrow large-file problem, start with the specific workflow: analyze a 1GB CSV without Python, safely parse and analyze .xls and .xlsx files with AI, or analyze multi-tab Google Sheets with AI. If the issue is broader, such as repeatable reporting, source-backed summaries, or recurring stakeholder exports, the workspace becomes the better fit.
That is also where the "AI spreadsheet vs AI data analyst workspace" distinction becomes practical. The spreadsheet helps you manipulate cells. The workspace helps you preserve the logic behind the answer.
Where Anomaly Fits
Anomaly AI fits on the workspace side of this decision. It is an AI data analysis workspace for uploaded or connected business data, not a spreadsheet editor.
In Anomaly, teams can work with direct uploads of .xlsx, .xls, and .csv files up to 1GB. They can also use available source workflows such as Google Sheets, GA4, BigQuery, MySQL, and Snowflake through supported data connectors. The point is not to recreate every cell interaction from Excel or Google Sheets. The point is to make the analysis verifiable and the output usable.
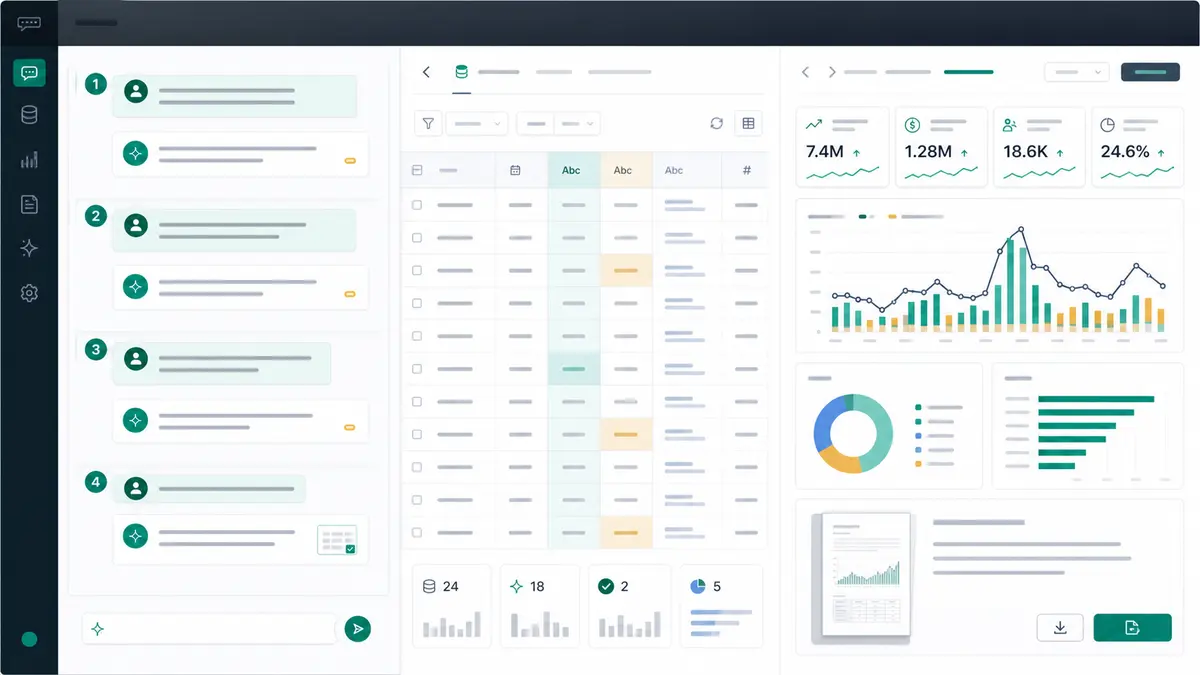
Anomaly helps teams define metric definitions and business rules, run traceable analysis, inspect the logic, and produce outputs that match real business workflows. The core outputs are interactive dashboards, business reports, source-backed summaries, and scheduled reporting workflows, with exports available where the source and workflow support them.
The guardrails are important. Anomaly is not a full spreadsheet replacement. It is not an Excel or Google Sheets editor, a formula engine clone, a DAX or Power Query clone, a semantic-model replacement, a full enterprise BI replacement, or an automatic data warehouse. It is not a live OneDrive/SharePoint sync layer, a guaranteed root-cause engine, a real-time monitor, a Parquet uploader, a SOC 2-complete product, or a Slack/webhook/SMS alerting system.
The right use case is narrower and more useful: when your spreadsheet work has become a data analysis workflow, Anomaly gives that workflow a place to run, review, and produce outputs without forcing every operator into a heavyweight BI build. For a deeper Excel-specific version of this tradeoff, see the guide to advanced Excel workflows faster in Anomaly AI.
Do Not Overbuild: Spreadsheet, Workspace, or BI?
The wrong tool creates drag in both directions. Stretching a spreadsheet too far creates brittle analysis. Overbuilding a BI stack for a one-off messy file creates process theater. The right decision is usually visible once you ask what must be trusted and repeated.
Use this buyer-fit checklist:
| Choose |
When it fits |
When it does not |
| AI spreadsheet |
The work is cell-first, small enough, manually edited, and the spreadsheet is the final surface. |
The file is slow, the logic is hard to audit, or the output must become a repeatable stakeholder report. |
| AI data analyst workspace |
The work involves larger files, multiple sources, repeated questions, inspectable logic, dashboards, recurring reports, or scheduled outputs. |
The team only needs simple cell edits, or the company needs a governed semantic layer across many teams. |
| BI or warehouse stack |
The organization needs centralized governance, production ETL, permissions, shared semantic models, and durable company-wide reporting. |
The need is an operator-led analysis workflow, a messy spreadsheet rescue, or a client-ready report that needs to ship quickly. |
This is why the answer is not "spreadsheets are dead" or "BI is always overkill." Spreadsheets are still excellent for cell-first work. BI is strong for governed recurring analytics across teams. A workspace is the middle layer for operators who need more trust and output quality than a spreadsheet can provide, without turning every reporting job into a platform project.
If you are also comparing heavier reporting stacks, the guide to free Power BI alternatives for messy spreadsheets covers that side of the decision.
FAQs About AI Spreadsheets and AI Data Analyst Workspaces
Is an AI spreadsheet enough for business analysis?
Yes, if the analysis is small, cell-first, easy to verify, and meant to stay inside the spreadsheet. AI spreadsheet tools are useful for formula help, quick summaries, cleanup, formatting, charts, and pivot-style exploration. They become riskier when the analysis depends on large files, multiple sources, hidden logic, recurring refreshes, or stakeholder-ready outputs.
Does Anomaly replace Excel or Google Sheets?
No. Anomaly is not a spreadsheet replacement, Excel editor, Google Sheets editor, or formula engine clone. It is an AI data analysis workspace for uploaded or connected business data. Use Excel or Sheets when you need to work directly in cells. Use Anomaly when the spreadsheet job has become a larger reporting workflow.
What is the biggest difference between a spreadsheet and a data analyst workspace?
A spreadsheet is a flexible grid for editing cells. A data analyst workspace is an environment for turning data into a verifiable business answer. The biggest difference is not AI quality; it is the operating model. One starts with cells. The other starts with sources, logic, outputs, and review.
When should I move from spreadsheet AI to a workspace?
Move when the spreadsheet starts creating risk: large files, slow performance, repeated manual refreshes, multiple exports, unclear metric definitions, fragile formulas, or outputs that need to become dashboards, recurring reports, or scheduled updates. That is the moment the problem has moved beyond cell assistance.
When should I move from a workspace to BI or a warehouse?
Move to BI or a warehouse when the organization needs governed semantic models, production ETL, centralized permissions, and shared reporting across many teams. A workspace is not a substitute for that full enterprise layer. It is the practical layer for analysis workflows that need to be repeatable and verifiable without a long BI build.
What outputs can Anomaly create?
Anomaly can create interactive dashboards, business reports, source-backed summaries, and scheduled reporting workflows, with exports available where the source and workflow support them.
If your spreadsheet question has become a multi-source reporting workflow, try Anomaly AI free.