When you load a dataset into an AI tool for the first time, the temptation is to type a vague prompt like "analyze this" or "tell me what changed."
That approach is a fast track to generic summaries, superficial observations, and invented business context. Because the AI does not know your business rules, your metric definitions, or the decision you need to make, it has to guess.
Getting useful insights from your first Anomaly session is not about letting the AI run wild. It is about guiding the first few turns of the conversation. Four deliberate messages can move the work from raw data to a first useful, verifiable output without pretending that the first answer is final.
Quick answer — first Anomaly session
Use four messages: tell Anomaly the business question and dataset context, ask for a first read of the most important patterns, ask it to show the evidence and assumptions behind the answer, then ask for the output you need: dashboard, Excel report/export, PowerPoint, Word doc, PDF, or scheduled reporting workflow where supported.
Why the First Session Fails When You Start Too Broad
When you start an analysis session with an overly broad prompt, the AI has to make assumptions about what matters to you. It might highlight a traffic movement that turned out to be bot activity, or flag a revenue drop that was actually a planned seasonal shutdown.
Without boundaries, three things go wrong:
- The AI invents the goal. It focuses on statistical variance instead of business utility.
- Logic runs unverified. You receive a polished summary without seeing the fields, filters, date windows, calculations, or row counts behind it.
- The output is unusable. You get a block of text instead of a structured asset you can review, export, or share.
The 4-Message Rule is a practical first-session workflow designed to prevent those failures. It does not guarantee a perfect root-cause explanation on your first try. It gives you a better way to make the analysis traceable, verifiable, and aligned with your business rules.
The 4-Message Rule for a First Anomaly Session
Use this table as the starting script. The exact wording can change, but the sequence should stay intact: context, first read, evidence, output.
| Message |
What to ask |
Why it matters |
Good answer includes |
Next move |
| 1. Context |
Business question, dataset context, metric definitions, and the decision to make. |
Prevents the AI from inventing the goal or guessing your business rules. |
Dataset understanding, fields likely needed, and clarifying assumptions. |
Confirm or correct the definitions. |
| 2. First read |
Top three patterns and the fields checked. |
Creates a useful first pass without pretending to have a final answer. |
Key patterns, relevant segments, date windows, fields used, and validation needs. |
Choose which pattern to prove or explore deeper. |
| 3. Evidence |
Source fields, filters, row counts, calculations, assumptions, and caveats. |
Keeps polished answers from outrunning the data. |
Exact calculations, row counts, missing or duplicate data notes, and analytical caveats. |
Approve, revise, or narrow the logic. |
| 4. Output |
Package the reviewed answer into your required format with definitions and caveats. |
Converts raw analysis into a stakeholder asset. |
Dashboard, Excel report/export, slides, Word doc, PDF, or scheduled workflow where supported. |
Review the final asset before sharing. |
Message 1: Give the Business Question and Data Context
Your first message should establish the ground rules. Tell the workspace what the dataset represents, what business question you are trying to answer, and how your core metrics are defined.
I uploaded a CSV of weekly pipeline. I need to understand why booked revenue missed target last month. Treat closed-won amount as booked revenue unless the file suggests a better field.
That one message does a lot of work. It tells Anomaly the source type, the business question, the date window, and the metric definition. It also leaves room for the workspace to challenge your assumption if the file has a better field.
Without that context, "booked revenue" could mean closed-won amount, invoice amount, recognized revenue, weighted pipeline, or a manually maintained target sheet. A first session goes sideways when those definitions are implicit.
Message 2: Ask for the First Read, Not the Final Answer
The second message should ask for a first read, not a verdict.
Give me a first read. Show the top three patterns related to the missed target, the fields you used, the date window, and anything that needs validation before I trust the answer.
This prompt gives you direction without pretending the analysis is done. A good first read should name the fields it used, segment the movement, and flag weak spots in the data. If the workspace focuses on the wrong metric or date field, you can correct it before a dashboard or report gets built on top of bad assumptions.
That is the point. The first read is not the board memo. It is the working surface.
Message 3: Make the Evidence Visible
Before you package findings for stakeholders, verify the math.
For each pattern, show the source fields, filters, date window, row counts, calculation logic, assumptions, and caveats. Call out missing values, duplicate records, or field definitions that could change the conclusion.
This is where the analysis becomes defensible. If the workspace calculated a 15% drop in conversion, you need to know whether that calculation excluded trial accounts, filtered out null values, or double-counted duplicate rows.
Evidence review turns a black-box AI response into traceable analysis. It also gives you the language you need for caveats: "This pattern is directional because the CRM owner needs to confirm whether closed_date or invoice_date is the right field."
Message 4: Ask for the Output You Actually Need
Once you have reviewed the logic, turn the conversation into a concrete asset. Do not settle for a copy-pasted paragraph of text if the stakeholder needs a dashboard, export, report, deck, doc, or PDF.
Turn the reviewed analysis into a stakeholder-ready output. Include the metric definitions, source fields, assumptions, and caveats. I need a dashboard and an Excel export first; if the logic looks right, prepare a PDF summary for review.
The output request matters because different audiences need different deliverables. A team lead may need an interactive dashboard. A finance reviewer may need an Excel-native dashboard export. A client may need a PDF. An executive may need PowerPoint slides. A recurring business review may need a scheduled reporting workflow where the source and workflow support it.
By explicitly defining the output in your fourth message, you keep the caveats and metric definitions attached to the asset instead of leaving them behind in the chat.
Prompt Examples for Common First Sessions
These examples assume you have already uploaded your files or connected/provided the relevant data in your workspace. Adapt the wording to your fields, definitions, and review burden.
| Scenario |
Message 1: context |
Message 2: first read |
Message 3: evidence |
Message 4: output |
| GA4 traffic review |
"I connected/provided GA4 data for the last 90 days. I need to know why organic traffic changed in the last full week. Use sessions and users separately, segment by source/medium and landing page, and show date windows before conclusions." |
"Give me the top three organic traffic movements and the fields used." |
"Show the date windows, filters, source/medium rules, landing pages, and row counts behind each movement." |
"Create a dashboard with the traffic movements, caveats, and a short PDF summary for review." |
| Large CSV |
"I uploaded a large CSV of customer orders. Find the biggest revenue movement by product, region, and week. First profile missing IDs, duplicate rows, and date formats." |
"Give me the strongest revenue patterns and any data quality issues that could distort them." |
"Show row counts, duplicate checks, date parsing assumptions, and revenue field definitions." |
"Create an Excel report/export and a dashboard that keeps the caveats visible." |
| Excel workbook |
"I uploaded an Excel workbook with sales, targets, and account tabs. Identify which sheet should be source truth for booked revenue before building charts." |
"Give me a first read of target variance by account and region after confirming the likely source sheet." |
"Show sheet names, join fields, calculation assumptions, missing values, and any formula or summary-sheet caveats." |
"Create an Excel-native dashboard export and a Word doc with definitions and review notes." |
| Google Sheets |
"I connected/provided a multi-tab Sheet for weekly client reporting. Map the tabs, identify joins, and tell me which tabs look like raw data versus summary outputs." |
"Give me the top client-reporting changes and the tabs used." |
"Show tab purpose, join keys, stale or filtered tabs, formula assumptions, and caveats." |
"Create a client-ready dashboard and PDF report with source notes." |
| Operational dataset |
"I uploaded production, tender, logistics, or support data. Show the top drivers of margin, delay, or resolution-time change, but mark anything that needs field-owner confirmation before I share it." |
"Give me the top three drivers and the dimensions used." |
"Show source fields, filters, row counts, outlier handling, and data-quality caveats." |
"Create a PowerPoint or PDF summary with evidence and recommended follow-up checks." |
For messy spreadsheets, pair this first-session workflow with a safer workbook review process like safely parsing and analyzing .xls and .xlsx files with AI. For oversized flat files, use the large-file workflow in analyzing a 1GB CSV without Python. For multi-tab Sheets, use the companion guide to Google Sheets connector multi-tab analysis.
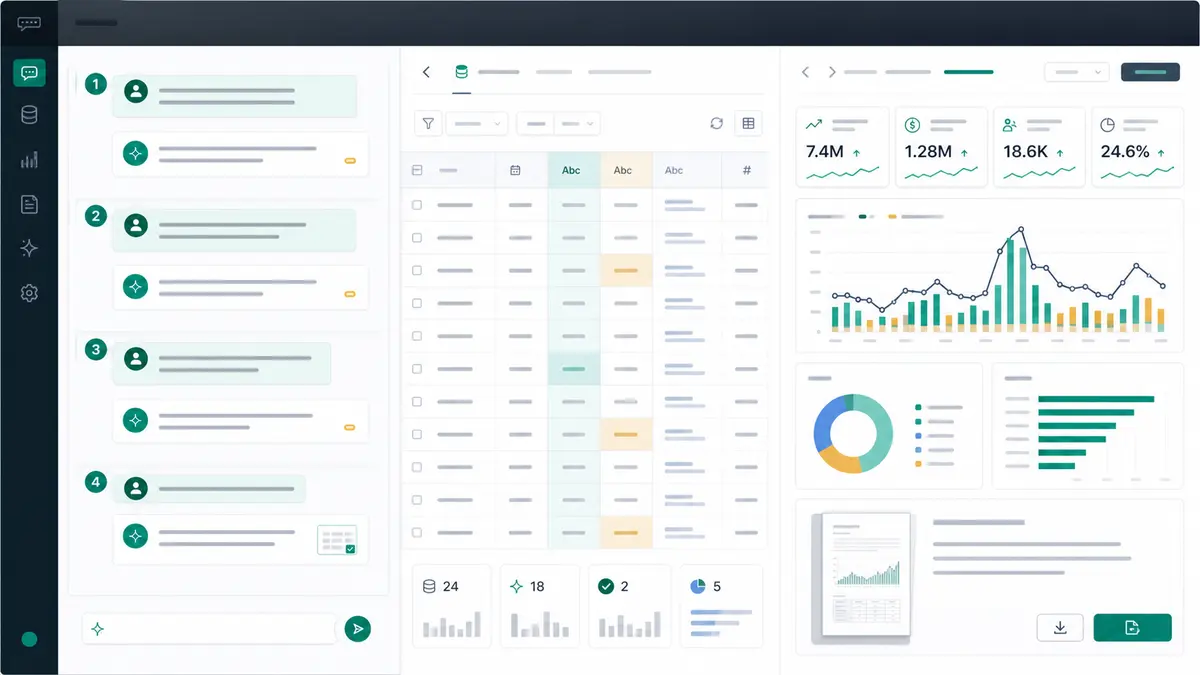
Where Anomaly Fits in the First Session
Anomaly is an AI data analysis workspace for uploaded or connected business data. The fit is not "ask a chatbot and hope." The fit is using a workspace where the data, logic, assumptions, and outputs stay close enough to review.
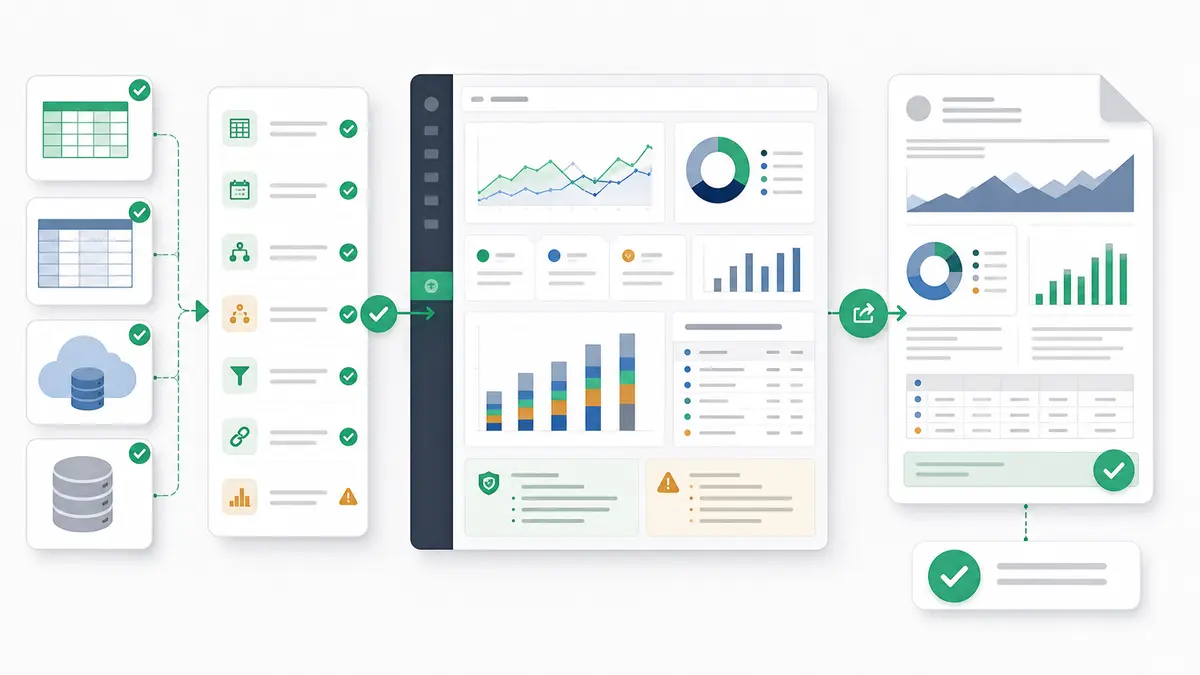
In a first session, that means you can:
- upload supported
.xlsx, .xls, and .csv files up to 1GB;
- use available source workflows such as Excel/CSV uploads, Google Sheets, GA4, BigQuery, MySQL, and Snowflake where available;
- ask focused business questions in plain language;
- inspect fields, filters, assumptions, and calculations;
- define metric definitions and business rules;
- turn reviewed analysis into interactive dashboards, Excel reports/exports, Excel-native dashboard exports, PowerPoint slides, Word docs, PDF reports, or scheduled reporting workflows where supported.
The output layer is the difference between a chat answer and useful business work. You are not just asking for "insights." You are asking for a verifiable dashboard, report, export, slide deck, doc, PDF, or recurring workflow that keeps source-backed calculations and caveats visible.
This is also why the distinction between an AI spreadsheet and an AI data analyst workspace matters. A spreadsheet is still useful when the work is small, cell-level, and manually edited. Anomaly is the better fit when the job is data analysis, source-backed calculations, and stakeholder-ready output.
The same logic applies to dashboards. A simple dashboard generator can help when you only need a quick visual. If the dashboard must survive review, use a workspace that keeps the assumptions near the chart. The full comparison is in AI dashboard generators vs interactive data workspaces.
The boundaries are just as important. Anomaly is not a real-time monitor, automatic anomaly detector, guaranteed root-cause engine, spreadsheet editor, BI semantic layer, DAX/Power Query clone, warehouse replacement, Parquet uploader, live OneDrive/SharePoint sync layer, SOC 2-complete product, or Slack/webhook/SMS alerting tool. Use the connectors page to check current supported source workflows before planning a repeatable setup.
FAQ: First Anomaly Session
Do I need perfect data before using Anomaly?
No. You do not need pristine data to start. You do need to name the known problems: missing IDs, duplicate rows, unclear dates, inconsistent definitions, stale exports, or fields that require owner confirmation. Put those caveats in Message 1 or ask Anomaly to profile them before it draws conclusions.
What if I do not know the exact field names?
Describe the business concept and ask Anomaly to confirm the likely field. For example: "Use the column that looks like transaction date, but tell me which field you selected before calculating trends." Then verify the field choice in Message 3.
Can four messages prove root cause?
No. Four messages can produce a useful, source-backed first pass. They cannot guarantee final root cause for a complex business issue. Treat the result as a reviewed starting point, especially when external context, sales-process changes, tracking changes, promotions, seasonality, or operational events may explain the movement.
Can I build a dashboard in the first session?
Yes, if the source data and definitions are clear enough. The safer sequence is to ask for the dashboard after the evidence step. That way the dashboard is built from reviewed fields, date windows, and assumptions instead of a blind first-pass answer.
Are uploaded files live-refreshing?
No. Direct uploads of .xlsx, .xls, and .csv files are file snapshots. If you need repeatable reporting with updated data, use a supported source workflow where available or upload a refreshed file, depending on the source and workflow.
Start With Four Messages, Then Save the Workflow
The strength of the 4-Message Rule is that once you find a sequence that works for your data, you can reuse it. Your first session becomes less of a guessing game and more of a structured business reporting workflow.
Stop typing "analyze this" and hoping for the best. Bring your dataset, define the business question, ask for the first read, make the evidence visible, and then request the output you actually need.
When you are ready to turn a first-session workflow into verifiable dashboards, exports, reports, slides, docs, PDFs, or scheduled reporting workflows, start your first Anomaly session.