A polished PDF report can hide weak assumptions. When a client opens a clean document, they assume the numbers, dates, filters, and logic have already been checked. If those numbers came from stale exports, duplicate rows, hidden filters, or mismatched metric definitions, the polished layout becomes a liability.
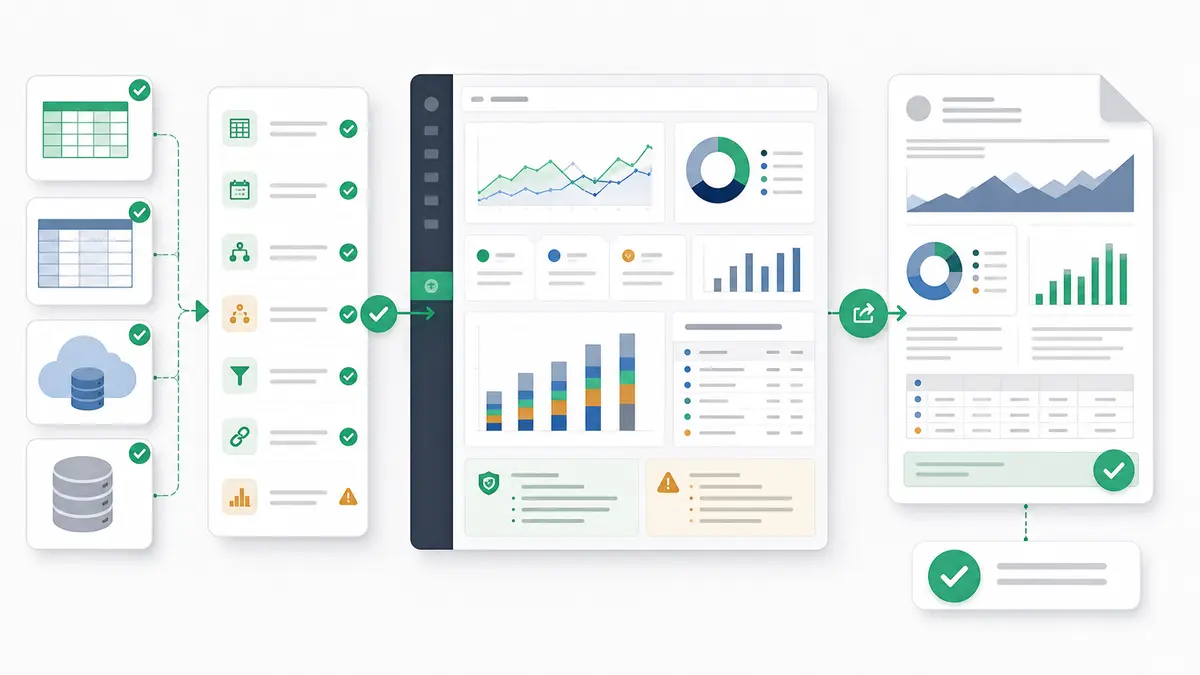
A truly client-ready PDF report is not just a clean export. It is a reviewed output where the source data, metric definitions, analysis logic, caveats, chart labels, and narrative claims have been verified before the file is sent. The workflow is not one-click magic. It is a structured path from upload or connection to field review, metric definitions, analysis, report assembly, PDF export, and final client QA.
Quick answer — upload to PDF report
To create a client-ready PDF report, start by uploading or connecting the source data, validate fields and metric definitions, ask for the analysis and dashboard/report view, review the evidence and caveats, export the approved report to PDF, and do a final client-readiness check before sending. The PDF is only client-ready when the logic, source notes, and narrative claims have been reviewed.
What Client-Ready Means Before You Export
Before you export a PDF, the report needs to meet a real readiness threshold. Client-ready means you can defend every number and narrative claim in a meeting.
A client-ready report requires:
- The right question. The report answers the client's decision, not just a generic KPI list.
- The correct period. Date ranges are explicit, aligned, and correct across every chart and comparison.
- A verified source. The underlying data is complete enough for the claim, with duplicates, missing values, hidden filters, and stale exports reviewed.
- Locked metric definitions. Terms like conversion rate, active customer, booked revenue, or churn are defined before the report is assembled.
- Explicit caveats. Data gaps, tracking issues, low-volume segments, and open questions are visible where they affect interpretation.
- A readable narrative. The report explains what changed, what evidence supports the finding, what remains uncertain, and what action comes next.
- Export quality. The final PDF has readable charts, complete labels, clean pagination, and no cropped tables.
That is different from a screenshot dump or a blind generated PDF. Exporting a raw dashboard without reviewing the underlying logic risks sending a report that looks finished but cannot survive the first client question.
The Upload-to-Export Workflow
Use this workflow before every client-facing PDF. It keeps the data checks, analysis, report assembly, and final artifact review in the right order.
| Step |
What to do |
What to check |
Output |
Reviewer question |
| 1. Intake |
Upload or connect the raw data source. |
File/source integrity, date range, owner, row count, refresh status. |
Source inventory. |
Is this the right data for the client's question? |
| 2. Field review |
Profile headers, data types, keys, dates, and nulls. |
Broken headers, stale exports, hidden filters, bad date formatting. |
Field/profile notes. |
Could the source structure change the final result? |
| 3. Definitions |
Lock metrics, business rules, and comparison periods. |
Formulas, numerator/denominator, exclusions, segment rules. |
Metric definition list. |
Would the client calculate this the same way? |
| 4. Analysis |
Identify patterns and source-backed findings. |
Evidence, row counts, filters, segment cuts, uncertainty. |
Reviewed analysis. |
Which claims are strong enough for the PDF? |
| 5. Report view |
Build the dashboard or report view around the narrative. |
Chart labels, units, dates, caveats, source notes. |
Report/dashboard draft. |
Can a client understand this without extra narration? |
| 6. PDF export |
Export the approved report view to PDF. |
Cropping, pagination, unreadable charts, missing caveats. |
PDF artifact. |
Does the artifact preserve the reviewed logic? |
| 7. Client review |
Perform final QA before sending. |
Narrative overclaims, action wording, open questions. |
Client-ready PDF. |
Would I defend this in a client meeting? |
Step 1: Upload or Connect the Right Source
The workflow begins with the right source data. If you are working with offline files, Anomaly supports .xlsx, .xls, and .csv uploads up to 1GB. That matters when the client export is too large or messy for local spreadsheet workflows. If the file is large enough to freeze your spreadsheet, use the workflow for analyzing a 1GB CSV without Python before you turn it into a report.
Depending on the reporting setup, you may also use available source workflows such as Excel/CSV uploads, Google Sheets, GA4, BigQuery, MySQL, and Snowflake where available. Use the connectors page to check current source coverage before promising a repeatable reporting setup.
Uploaded files are snapshots. Always confirm the file timestamp, export owner, reporting period, and row count before building the report. If a client sends the wrong weekly export, the PDF can still look polished while answering the wrong question.
Step 2: Review Fields Before You Ask for the Report
Never assume a raw export is clean. Before building charts or summarizing trends, profile the source structure. For Excel workbooks, use the safer workflow for parsing and analyzing .xls and .xlsx files with AI so sheet structure, hidden data, formulas, and sensitive fields are reviewed before the output is created.
Check:
- File period. Do the timestamps match the requested reporting window?
- Row count. Does the export look complete, or are weeks, accounts, transactions, or regions missing?
- Headers and types. Are numeric fields stored as text? Did a client rename a column? Are merged headers or blank rows present?
- Date fields. Are date formats consistent, and is the report using the right date field?
- Join keys. If you combine sheets or sources, are the IDs unique enough to join safely?
- Hidden filters and tabs. Did the source workbook or Sheet arrive with filters, hidden tabs, or summary views that could distort totals?
This is the part that protects the client relationship. A report is easier to defend when the source checks are visible before the charts appear.
Step 3: Lock Metric Definitions and Business Rules
A metric is useless if the client defines it differently. Before assembling the report, document the business rules and metric definitions that the PDF will use.
Define:
- Revenue. Gross revenue, net revenue, recognized revenue, booked revenue, or invoiced amount?
- Conversion rate. What is the numerator? What is the denominator? Are test sessions, internal accounts, or refunds excluded?
- Active customers. Does active mean login, purchase, subscription status, usage event, or a custom client definition?
- Comparison period. Month over month, year over year, prior 30 days, previous campaign period, or custom baseline?
- Segment rules. Which regions, accounts, products, channels, or cohorts are included?
Do this before the narrative is written. Otherwise, the PDF may tell a clean story using definitions the client would not accept.
Step 4: Turn the Analysis Into a Report Story
A client-ready PDF is not every chart that came out of the analysis. It is a selected story built around claim, evidence, caveat, and action.
Use this sequence:
Claim: What changed?
Evidence: Which source-backed calculation supports it?
Caveat: What could change the interpretation?
Action: What should the client do next?
Not every visualization belongs in the PDF. If a chart does not support a decision, clarify a caveat, or explain a meaningful change, leave it out. The stronger reporting discipline is the same one used in executive summaries with source-backed logic: every claim should have a source metric, logic trail, caveat, and recommended action.
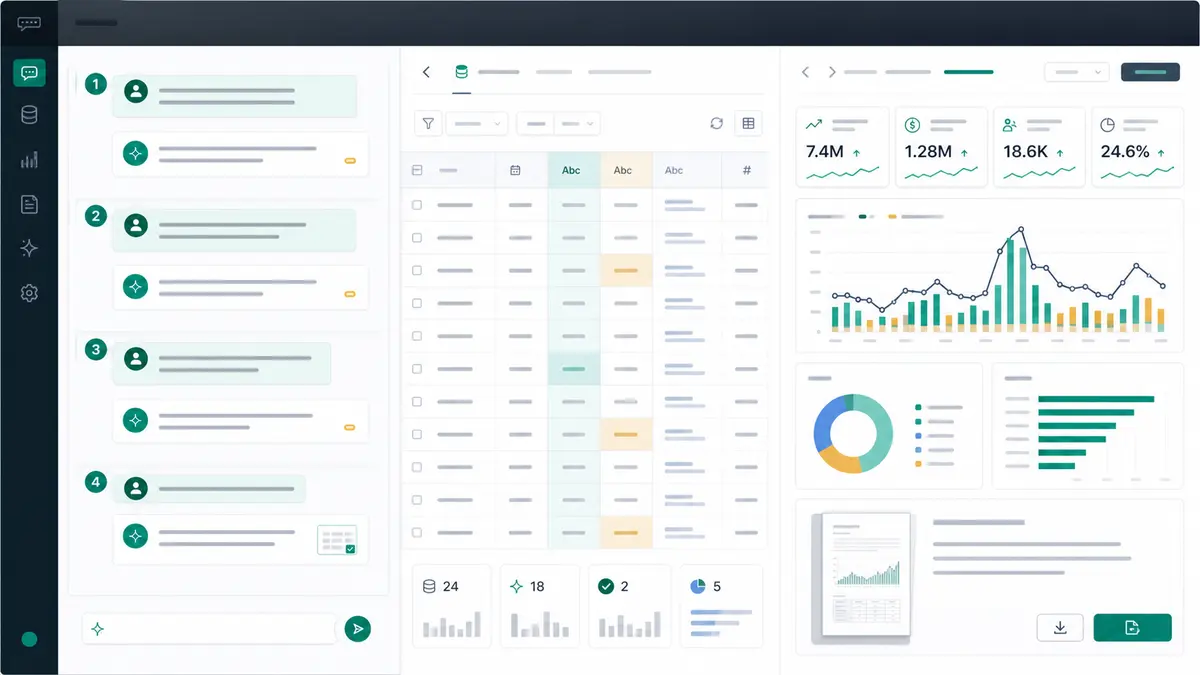
Step 5: Assemble the Dashboard or Report View
Once the story is defined, assemble the dashboard or report view that will become the PDF. This is where the analysis becomes readable.
Pay attention to:
- Chart titles. A title should say the point, not just label the chart.
- Units and axes. Currency, percentages, counts, and date intervals must be explicit.
- KPI cards. Use summary cards only for metrics the client is expected to act on.
- Period comparisons. Make comparison windows visible next to the metric, not buried in the narrative.
- Segment cuts. Keep segments consistent across related charts.
- Source notes. Include the source, reporting window, and caveats close to the output.
If the work repeats every week or month, borrow the discipline from repeatable client dashboards from messy CSVs: standardize intake, mapping, definitions, review notes, and delivery so each new report follows the same path.
Step 6: Export the PDF and Review the Artifact
Once the report view is assembled and reviewed, export it to PDF. For dashboard views, Anomaly's product capability source describes PDF export as rendering a dashboard to A4 PDF with branding.
Do not stop at the export button. Open the PDF and inspect the artifact:
- Cropping and pagination. Are charts, tables, or text blocks cut off by page margins?
- Chart labels. Are data labels and legends readable?
- Caveats and notes. Are source notes and data caveats visible?
- Filters. Did you accidentally export a temporary filter such as one region, account, or test segment?
- Narrative alignment. Do the written claims match the numbers in the charts?
- Client context. Would a client understand the report without a live walkthrough?
If the client prefers a deck instead of a PDF, use the adjacent workflow for creating client-ready QBR PowerPoint slides from BigQuery data. The output changes; the review discipline does not.
Client-Ready PDF QA Matrix
Use this matrix before sending the PDF.
| Category |
Checkpoint |
Target state |
Red flag |
| Source data |
Data completeness |
Relevant rows, dates, and entities are included. |
Missing weeks, incomplete exports, or dropped regions. |
| Filters and dates |
Reporting window |
Date ranges are explicit and aligned across charts. |
"Last 30 days" label with stale source data. |
| Metric definitions |
Calculation logic |
Formulas, numerator/denominator, and exclusions are documented. |
Key metrics do not match client-owned definitions. |
| Caveats |
Data limitations |
Tracking gaps, low-volume segments, and known issues are visible. |
Large movements appear without context. |
| Labels and units |
Visual clarity |
Axes, legends, KPI cards, and currencies are clear. |
Missing units, cropped labels, or ambiguous chart titles. |
| Narrative claims |
Verifiable logic |
Written claims map directly to source-backed evidence. |
Causal language with only directional evidence. |
| Export quality |
PDF formatting |
No cropped text, overlapping labels, or bad page breaks. |
Tables cut off at page margin. |
| Approval |
Final sign-off |
A human reviewer can defend the PDF in a client meeting. |
Direct-to-client send without QA. |
Prompt Block: Upload to PDF Report
Use this prompt sequence to guide the workflow without skipping review. If you need a shorter first-session sequence before building the report, pair this with the 4-Message Rule for your first Anomaly session.
I uploaded the client reporting workbook for May. First profile the sheets, fields, date ranges, missing values, and duplicate IDs. Do not build the report until the source checks are listed.

Now define the metrics for the PDF report: revenue, conversion rate, active customers, and weekly change. Show the numerator, denominator, filters, and caveats for each.

Build a report view with the strongest 3-5 findings, source-backed evidence, caveats, and recommended next steps. Keep chart titles specific and include the reporting period.

Export the approved report to PDF. Before finalizing, list anything that could confuse a client: cropped charts, missing labels, weak claims, incomplete source notes, or unclear definitions.
Where Anomaly Fits in the Upload-to-Export Workflow
Anomaly is an AI data analysis workspace for uploaded or connected business data. It helps teams move from source data to verifiable reports without turning the workflow into a blind PDF generator.
The fit for this article is specific:
- bring in supported data through
.xlsx, .xls, and .csv uploads up to 1GB, or available source workflows such as Google Sheets, GA4, BigQuery, MySQL, and Snowflake where available;
- ask for source profiling, field review, and metric definitions before asking for a report;
- use traceable analysis, verifiable outputs, source-backed calculations, metric definitions, and business rules to inspect the result;
- turn reviewed analysis into interactive dashboards, business reports, source-backed summaries, PDF reports, or scheduled reporting workflows where source and workflow support allows;
- schedule recurring reporting workflows with rendered PDF attachments and narrative summaries where supported.
That makes Anomaly different from a one-shot dashboard or report generator. The point is not only to make an artifact. The point is to make a client-facing output that keeps the logic close enough to review. For the broader category distinction, see AI dashboard generators vs interactive data workspaces. For recurring Google Sheets reporting, see automating weekly client reporting with Google Sheets and scheduled PDFs.
The boundaries matter. Anomaly is not a full graphic-design or page-layout suite, a guaranteed automatic PDF generator for every workflow, a live BI semantic layer, a real-time monitor, an automatic anomaly detector, a guaranteed root-cause engine, a spreadsheet editor, a DAX or Power Query clone, a warehouse replacement, a SOC 2-complete product, a Parquet uploader, a live OneDrive/SharePoint sync layer, a Slack/webhook/SMS alerting tool, or a universal auto-refresh layer for uploaded files.
FAQ: Client-Ready PDF Reports
Can AI create a PDF report from uploaded data?
Yes, if the workflow includes human review. An AI data analyst can help profile data, define metrics, build report views, and export PDFs. The report still needs source checks, logic review, visual QA, and client-safe caveats before it is sent.
What should I check before sending a PDF report to a client?
Check source completeness, row counts, date ranges, filters, metric definitions, caveats, chart labels, units, narrative claims, and PDF formatting. The most common mistake is treating export quality as report quality. A clean PDF can still carry weak logic.
Does Anomaly replace a designer or BI team?
No. Anomaly helps create verifiable analysis and stakeholder-ready reports, but it is not a full page-layout suite, governed enterprise BI semantic layer, or warehouse replacement. Use it when the job is turning uploaded or connected business data into reviewed dashboards, recurring reports, PDFs, or scheduled reporting workflows.
Can uploaded files refresh automatically?
No. Uploaded .xlsx, .xls, and .csv files are static snapshots. If you need updated reporting, use a supported source workflow where available or upload a refreshed file, depending on the source and process.
Can reports be scheduled?
Yes, where the source and workflow support it. Scheduled reporting workflows can email a rendered PDF attachment with a narrative summary where supported. The schedule should still use reviewed metric definitions, source checks, and caveats.
Export the PDF Only After the Logic Survives Review
The visual polish of a PDF only matters when the underlying logic is sound. A client-ready report starts with source review, moves through metric definitions and evidence, and ends with an exported artifact that a reviewer can defend.
Use the workflow: upload or connect the data, inspect the fields, define the metrics, build the story, assemble the report view, export the PDF, and QA the artifact before it leaves your team.
When you are ready to turn reviewed business data into client-ready dashboards, exports, reports, slides, docs, PDFs, and scheduled reporting workflows, get started with Anomaly.