Quick answer — GA4 anomaly investigation without Python
Run a GA4 anomaly investigation without Python by defining one metric, choosing a fair baseline, checking GA4 freshness, isolating the affected channel, source/medium, page, device, country, campaign, or user segment, corroborating with supporting data when available, and writing a confidence-rated explanation with the causes you ruled out.
When you spot a sudden shift in GA4, whether sessions fell unexpectedly or key events moved in an unusual direction, your first instinct might be to reach for Python. Custom notebook. Statistical model. A pile of exports. Something that looks technical enough to survive the stakeholder meeting.
That is usually the wrong first move.
You do not need Python to run a rigorous GA4 anomaly investigation. You need a clean question, a reliable baseline, and a workflow that separates genuine traffic or conversion movement from reporting artifacts.
That is the difference between "GA4 looks weird" and "here is what changed, where it changed, what we ruled out, and how confident we are."
Treat the Anomaly as a Case, Not a Chart
An anomaly in Google Analytics 4 is only a suspicious movement until proven otherwise. Do not panic-scroll through reports. Treat it like an investigation.
Every defensible case file needs seven parts:
- The exact metric that moved.
- The specific date window of the change.
- A fair baseline for comparison.
- The isolated segment driving the shift.
- The data freshness status of the affected dates.
- A corroborating source, where available.
- A clear confidence level in the conclusion.
GA4 can help you find the starting signal. In Free-form Exploration, line charts can use anomaly detection. Google says the model uses a training period to calculate expected values, a sensitivity setting to decide which points get flagged, and a Bayesian state space time-series model to forecast metric values.
That is useful. It is not a root-cause engine.
The anomaly flag tells you where to look. The investigation tells you what happened.
Step 1: Lock the Metric and the Baseline
Before digging into why something moved, define exactly what moved and what you are comparing it against.
Start with one metric. Do not bounce between active users, sessions, and key events in the same explanation. Pick the metric that matches the business question:
- Traffic metrics: sessions, active users, or total users.
- Conversion metrics: key events, user key-event rate, or engagement rate.
- Commercial metrics: total revenue or lead events.
This matters because GA4 metrics answer different questions. A key event measures an action important to business success. Sessions explain visits. User metrics explain people. Those are related, but they are not interchangeable.
Then choose the baseline. A Monday can look bad against a Sunday. A holiday week can look strange against a normal week. A campaign launch can make the previous period a bad comparison.
Use the fairest window for the question:
- Same weekdays from the previous week.
- A prior four-week pattern.
- Year-over-year when the business is seasonal.
- A custom baseline when a campaign, launch, or holiday makes the default comparison misleading.
Finally, check whether the window is fully processed. Google's GA4 data freshness documentation says data processing can take 24-48 hours, and reports may change during that period. It also notes that intraday data can have temporary gaps in event-scoped source, medium, campaign, and default channel group dimensions.
If the anomaly lives mostly in yesterday or today, label it provisional. That is not hedging. That is accurate.
Step 2: Prove It Is Not a Reporting Artifact
Many GA4 anomaly investigations go wrong because the operator treats every mismatch as a business event.
Sometimes the business changed. Sometimes the report changed the question.
GA4 does not display the same data the same way everywhere. Google's reporting surfaces comparison explains that Reports, Explorations, the Data API, and BigQuery Export can display data differently. Reports and Explorations can use aggregated or event/user-level data depending on the query. BigQuery Export gives event and user-level data, but excludes some value additions GA4 applies in standard reporting surfaces.
The Reports vs Explorations documentation lists several expected causes of differences: supported fields, filters, segments versus comparisons, date ranges, low user counts, behavioral modeling, and processing time. Google also says recent queries for the past 48 hours can differ because the data is still being processed.
The Data API has its own traps. Google's Data API reporting expectations say API results can differ from the GA4 UI because of sampling, aggregation, HyperLogLog++ approximation for unique counts, thresholding, reporting identity, (other) rows, and mismatched date ranges, dimensions, metrics, or filters.
So before you call the anomaly real, rule out the boring stuff:
- Are you comparing the same date range and timezone?
- Are you using the same metric definition?
- Are you mixing user-scoped, session-scoped, and event-scoped dimensions?
- Is the recent period still processing?
- Is the report subject to thresholding or
(other) rows?
- Did a dashboard switch from one GA4 surface to another?
- Did an export sum non-additive user counts across rows?
If the investigation involves exported GA4 data, keep the companion guide Why Your GA4 Export Is Lying to You nearby. Most export mistakes start with row grain, unique counts, year-over-year windows, or double counting.
Step 3: Isolate the Segment
Once the movement is worth investigating, find where it is concentrated.
Start with the Traffic acquisition report for recent session movement. Google describes it as a report for understanding where website and app visitors come from. It includes new and returning users, and it uses session-scoped cross-channel traffic-source dimensions such as Session default channel group, Session source, Session medium, Session campaign, and Session source/medium.
Do not confuse that with User acquisition. Google's User acquisition vs Traffic acquisition page is explicit: User acquisition is scoped to new users and uses first-user dimensions, while Traffic acquisition is scoped to new sessions and uses session dimensions.
If you compare those two reports as if they answer the same question, you are not debugging GA4. You are mixing scopes.
Break the anomalous metric by:
- Channel or default channel group.
- Source and medium.
- Landing page.
- Device.
- Geography.
- Campaign.
- New versus returning users.
- Key event or key-event rate.
Traffic-source dimensions are the raw material here. Google's traffic-source dimension documentation describes source, medium, campaign, and source platform as building blocks for attribution and acquisition analysis. The manual tagging and auto-tagging documentation also warns that missing UTM parameters can lead to (not set) values.
That gives you the next clue.
If every channel moved together, check tracking, site availability, consent, deploys, and configuration. If only Organic Search moved, investigate search demand, landing pages, and source/medium classification. If one campaign disappeared while Direct rose, inspect UTMs, redirects, and tagging before writing a demand story.
For the attribution side of this problem, see Organic Channel vs medium=organic. A channel is not the same thing as a raw medium filter.
Step 4: Check Tracking and Business Changes
Now tie the segment to something that could have caused it.
Start with tracking and technical changes:
- Was a new site version deployed when the movement started?
- Did GTM or GA4 configuration change?
- Did a consent banner start blocking collection for a segment?
- Did redirects, canonicals, or landing page URLs change?
- Did campaign URLs lose UTM parameters?
- Did data filters or report settings change?
Then check business and market changes:
- Was a campaign paused or launched?
- Did a newsletter, paid campaign, or partner campaign stop sending traffic?
- Did a product, pricing, content, or promotional change affect behavior?
- Is seasonality or a holiday a plausible explanation?
- Did search demand or visibility move?
For organic search, GA4 alone is not enough. The Search Console Performance report shows how a site performs in Google Search results, including clicks, impressions, queries, pages, and date-range comparisons.
If GA4 Organic Search sessions dropped and Search Console clicks or impressions moved in the same direction, you have stronger evidence of a search-side issue. If Search Console is stable but GA4 organic sessions changed, look harder at collection, attribution, landing pages, redirects, source/medium classification, or reporting-surface differences.
That is the goal: not "traffic dropped," but "this segment moved, and this other evidence supports or contradicts it."
For a deeper step-by-step version of this traffic-drop investigation, read How to Answer "Why Did Web Traffic Drop Last Week?" Without Fighting GA4.
The No-Python GA4 Anomaly Investigation Decision Table
Use this table before writing the stakeholder update. It keeps the investigation grounded in evidence instead of dashboard anxiety.
| Symptom or suspected anomaly |
Likely cause |
What to check |
How Anomaly helps |
| Only the most recent period looks abnormal |
GA4 data is still processing |
Data freshness, date range, report surface, recent 24-48 hour window |
Labels the window as provisional in the analysis and keeps the baseline visible before sharing |
| One acquisition bucket moved |
Channel/source/medium shift or attribution scope issue |
Traffic acquisition, Session default channel group, Session source/medium, UTM values |
Compares acquisition cuts side by side and keeps source-backed logic inspectable |
| One landing page drives the change |
Page-specific search, redirect, content, or tracking issue |
Landing page, page path, Search Console page/query data if available, deploy/change log |
Turns the page-level cut into a dashboard, report, or stakeholder-ready explanation |
| One device or country changed |
Segment-specific UX, demand, consent, or availability issue |
Device, country, browser, audience/user type, local campaign changes |
Builds segment views without Python and keeps assumptions attached to the output |
| Campaign values disappear or Direct rises |
UTM, redirect, referrer, or tagging issue |
Session campaign, Session source/medium, UTM fields, campaign URL checks |
Helps reconcile GA4 with uploaded campaign exports or connected business data |
| Key events moved but traffic did not |
Conversion behavior, tracking, or definition change |
Key events, user key-event rate, event setup, landing page and funnel cuts |
Keeps metric definitions and business rules visible in dashboards and reports |
| GA4 and another source disagree |
Collection, attribution, freshness, or reporting-surface mismatch |
Search Console/ad platform/CRM/export where available, Data API/UI/export parity |
Combines supported connected data and uploaded exports into a traceable explanation |
This table will not finish the investigation for you. It prevents the worst version of it: a vague chart, a confident guess, and no proof.
A Client-Safe Explanation Template
When you present the answer, do not send a dashboard tour. Send a short, defensible diagnosis.
We saw [metric] move during [date window].

Baseline:
[Comparison window and reason it is fair.]

Segment:
[Channel/source/medium/page/device/country/campaign/user type where the movement is concentrated.]

Evidence:
- GA4: [report/surface + dimension + metric]
- Corroboration: [Search Console/ad platform/export/change log if available]
- Ruled out: [freshness/reporting artifact/tracking issue/business change]

Confidence:
[High/medium/low] because [why].

Next action:
[One owner + one next check.]
The confidence line matters. If the data is still inside the freshness window, say so. If you only isolated the segment but have not confirmed the cause, say that. If GA4 and the corroborating source disagree, say that too.
Clear uncertainty beats fake certainty.
Where Anomaly AI Fits
This is the workflow Anomaly AI is built to make less painful.
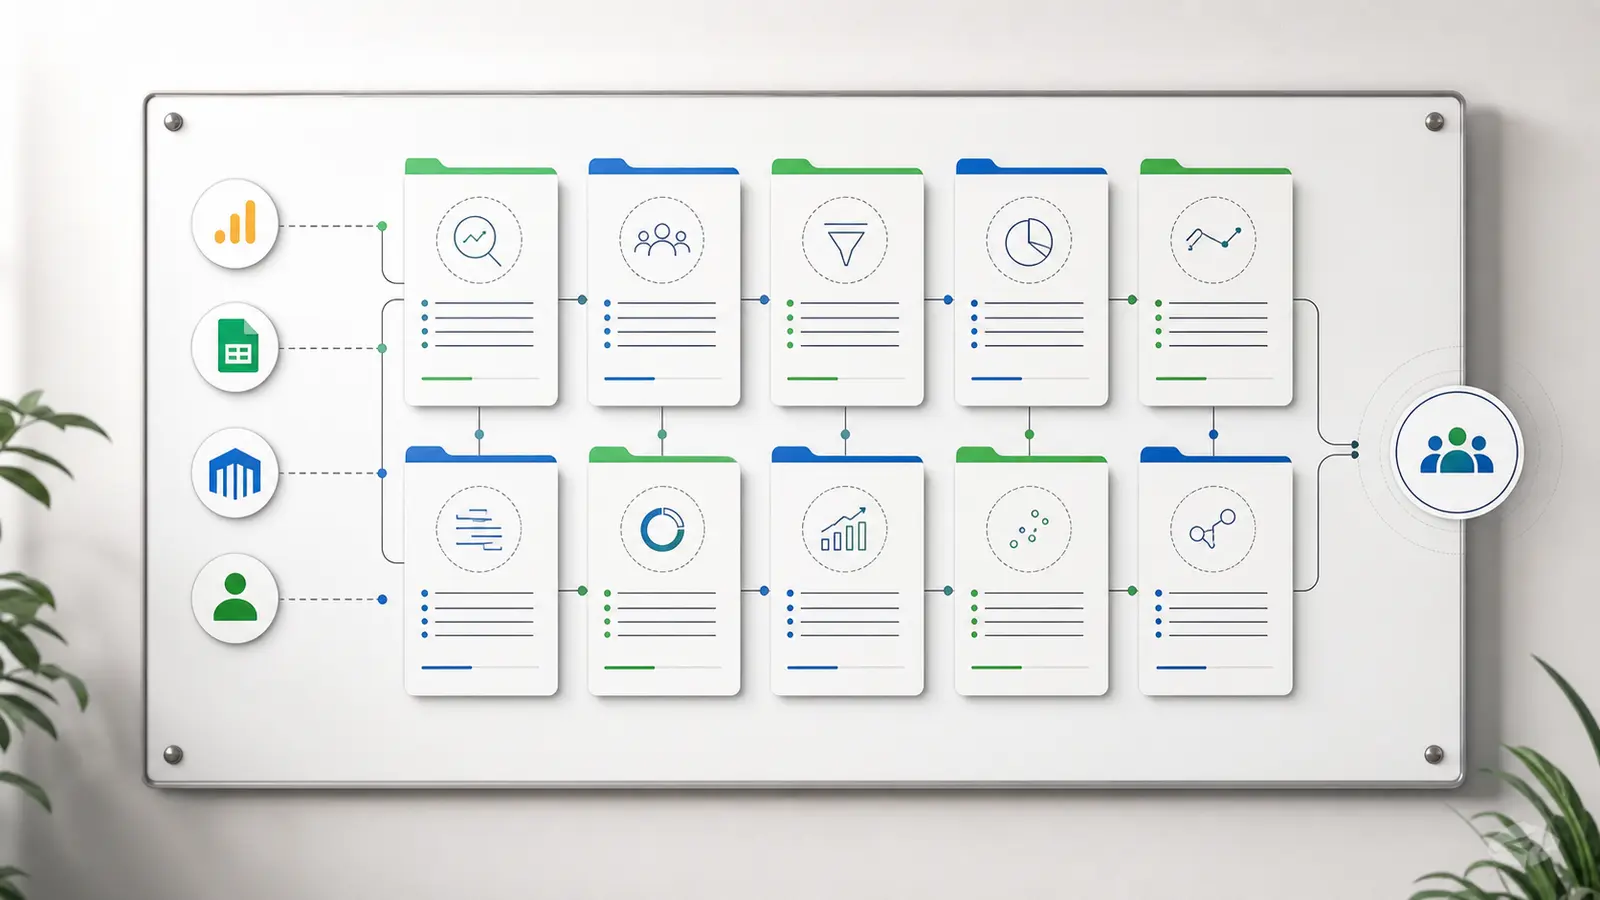
Anomaly AI is an AI data analysis workspace where you can connect business data and ask for the output you need: an interactive dashboard, source-backed explanation, refreshable report, or scheduled reporting workflow.
For this workflow, you can bring GA4 API data or GA4 BigQuery export into the workspace, compare baselines, segment traffic, and keep the investigation logic inspectable without writing Python first. When BigQuery is involved, SQL can be part of that traceability layer, but the bigger promise is source-backed calculations, metric definitions, business rules, and outputs your team can inspect before sharing.
Anomaly AI also helps keep the evidence together: the original question, the baseline, the segment breakdown, the source data, and the final stakeholder explanation. If the investigation needs more than GA4, you can combine it with supported sources through our connectors page.
This is not a claim that Anomaly AI magically finds every root cause. It is not an automatic anomaly-detection product, and it does not replace the operator's judgment. It gives the investigation a repeatable, source-backed reporting workflow that is easier to explain through traceable analysis.
For the GA4-specific workflow, see our GA4 data analysis page. If you want to try the workflow on your own data, get started.
FAQ
Can you investigate GA4 anomalies without Python?
Yes. Python can help later, but the first defensible GA4 anomaly investigation is usually a no-code workflow: define the metric, pick a fair baseline, check freshness, isolate the affected segment, corroborate with supporting data, and write a confidence-rated answer.
Does GA4 have built-in anomaly detection?
Yes, GA4 Free-form Exploration line charts can use anomaly detection. Treat that as a signal, not a diagnosis. It can flag an unusual datapoint, but it does not prove the root cause.
What should I check first when GA4 traffic drops?
Check whether the affected window is fully processed, then verify that you are using the right metric, scope, report surface, and baseline. After that, split the change by channel, source/medium, landing page, device, country, campaign, user type, and key events.
Is Anomaly AI an automatic anomaly detector?
No. Anomaly AI is an AI data analyst for traceable GA4 analysis, dashboards, recurring reports, and scheduled reporting workflows. It helps investigate suspicious GA4 movements with logic you can inspect, but it is not a live monitoring system or a certain-cause diagnosis tool.
Conclusion
A no-code GA4 anomaly investigation should not be shallow. It should be disciplined.
Define the metric. Check the freshness window. Rule out reporting artifacts. Isolate the segment. Corroborate with another source when you can. Classify the problem honestly. Then write the answer in language a stakeholder can act on.
Python can come later if the case demands it. The first defensible answer does not start with code. It starts with a better question.