Quick answer — marketing analytics prompts before a client meeting
Before a client marketing analytics meeting, run 10 source-backed prompts: traffic movement, conversion quality, paid-vs-organic mix, landing-page performance, CAC, cohort quality, attribution discrepancies, reporting artifacts, client-ready narrative, and next-step recommendations. Each prompt should name the data source, date window, metric definition, expected output, and verification caveat before the answer becomes a slide or talking point.
Preparing for a client meeting with generic marketing analytics prompts is how smart teams walk into messy conversations with fragile answers.
The prompt is not the problem. The problem is asking a broad tool to "analyze performance" without naming the source data, date window, metric definition, row grain, or verification standard. That produces confident-sounding commentary, but it does not give you a client-safe answer when someone asks why GA4, a spreadsheet, and the campaign report disagree.
This prompt library is built for consultants, agency analysts, fractional marketers, and operators who need a cleaner pre-meeting workflow. Use the prompts against source-backed GA4, spreadsheet, warehouse, customer, and campaign export data. Then verify the answer before it becomes a slide.
Why Prompt Libraries Fail in Client Meetings
Most prompt libraries fail because they treat marketing analytics like a brainstorming exercise. Real client reporting is less forgiving.
GA4 reports can disagree with API pulls or exports for ordinary technical reasons: sampling and aggregation, HyperLogLog++ approximation for unique counts, thresholding, (other) rows, reporting identity, query specificity, and freshness. Google's Data API reporting expectations make the core rule clear: match date ranges, dimensions, metrics, and filters before you compare outputs.
The same problem appears inside GA4 itself. Google's User acquisition and Traffic acquisition documentation explains that User acquisition is scoped to new users and first-user dimensions, while Traffic acquisition is scoped to new sessions and session dimensions. If a prompt blends those scopes, the answer may sound polished and still be wrong for the meeting.
Exports add another risk. GA4 reports can be exported to PDF, CSV, or Google Sheets, but Google's report export documentation says CSV and Google Sheets exports include up to 100,000 rows. Microsoft says Excel worksheets support 1,048,576 rows by 16,384 columns. If the export is too wide, too long, manually edited, or missing rows, a prompt can analyze a partial file without knowing it.
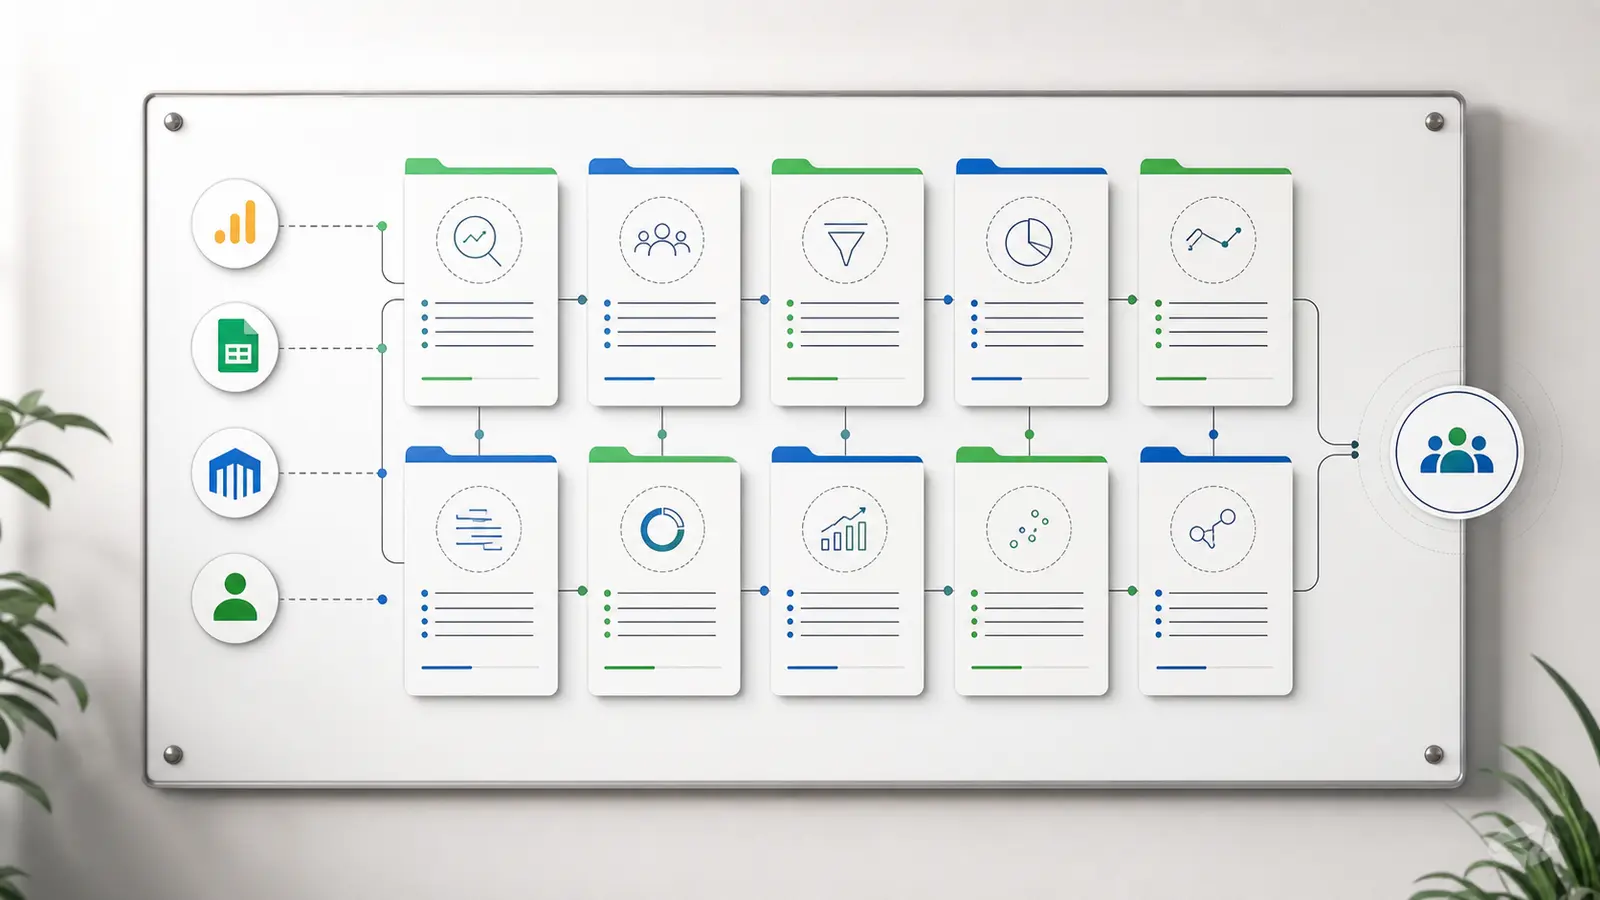
That is why every prompt below includes four pieces:
- the exact business question
- the data required
- the output you should expect
- the verification step before you say it out loud
Use This 10-Prompt Library Before the Meeting
Use these prompts in order. They move from performance movement to quality, attribution, narrative, and action. Do not treat them as copywriting prompts. Treat them as analysis instructions that need real data attached.
| # |
Prompt |
Required data |
Expected output |
Verify before saying it |
| 1 |
"For the selected date range, what changed most in traffic by channel, source/medium, landing page, device, and geography compared with the previous comparable period?" |
GA4 Traffic acquisition, landing page, device, geo, date range, prior period, annotations. |
Ranked movement table with the biggest positive and negative contributors. |
Date windows, GA4 freshness, session vs user scope, tracking releases, and annotation context. |
| 2 |
"Which channels or landing pages are sending traffic that looks healthy on sessions but weak on key events, conversion rate, or revenue?" |
GA4 sessions, key events, revenue, landing pages, channel/source/medium. |
Table of high-traffic, low-conversion segments with next checks. |
Key event definitions, revenue tagging, and whether the comparison uses session, user, or event scope. |
| 3 |
"Did this period's performance change come from paid spend, organic demand, channel mix, or tracking/classification?" |
GA4 source/medium/channel, uploaded ad spend exports or Sheets, campaign dates, and Search Console exports if available. |
Paid-vs-organic contribution summary with evidence for each driver. |
Channel definitions, spend date windows, and whether ad/search data came from uploaded exports, Sheets, warehouse tables, or another verified source. |
| 4 |
"Which landing pages should we defend, fix, or stop promoting before the next reporting period?" |
GA4 landing pages, sessions, engagement, key events, revenue/leads, page status, redirect notes. |
Defend/fix/stop table with evidence and the next owner. |
Canonical URLs, redirects, tracking changes, low-volume rows, and whether page status changed during the period. |
| 5 |
"Which campaigns, channels, or segments have a CAC problem once spend and new-customer counts use the same time window?" |
Uploaded ad spend, sales/CRM new customers, pipeline/customer table, GA4 campaign/source context. |
CAC by channel, campaign, or segment, plus warnings where the denominator is missing or mismatched. |
CAC formula, acquisition costs included, new-customer denominator, and exact period alignment. |
| 6 |
"Are the customers or users acquired in this period lower quality than earlier cohorts after signup, purchase, or first key action?" |
Customer/signup cohorts, revenue/retention/activity table, GA4 first-user dimensions if relevant. |
Cohort quality comparison by source, channel, or campaign. |
Acquisition date vs activity date, cohort denominator, enough elapsed time, and whether cohorts are comparable. |
| 7 |
"Where do channel, source/medium, or campaign totals disagree across GA4 reports, exports, and spreadsheets, and which definition should we use in the meeting?" |
GA4 User acquisition, Traffic acquisition, source/medium, default channel group, export/API/BigQuery data. |
Reconciliation table and one client-safe definition for the meeting. |
User vs session scope, channel rules, (other), attribution window, reporting identity, and export surface. |
| 8 |
"Which apparent spike, drop, or outlier is most likely a reporting artifact, and which one is most likely a real business change?" |
GA4 recent data, export/API pulls, tracking changes, CRM/orders/leads, prior periods. |
Artifact-vs-real table with evidence status and caveats. |
24-48 hour GA4 freshness, tracking releases, thresholding, row limits, and manually edited spreadsheets. |
| 9 |
"Turn the verified findings into three client-safe takeaways: what happened, why we believe it happened, what evidence supports it, and what remains uncertain." |
Outputs from prompts 1-8, source links, assumptions, screenshots, or tables. |
Three takeaways for slides, meeting notes, or an executive summary. |
Every claim has evidence; facts and hypotheses are separated. |
| 10 |
"Based on the evidence, what are the next three recommended actions, who owns each one, what signal should improve, and what result would disprove the recommendation?" |
Verified findings, campaign/page/customer constraints, owner list, success metrics. |
Action table with owner, expected signal, and falsification test. |
Recommendations tie to evidence, not generic advice; no outcome-certainty claims. |
The first prompt gives you the movement map. The second tells you whether volume is actually useful. The middle prompts force spend, landing pages, cohorts, and attribution into the same evidence set. The last two prompts turn the verified work into a meeting narrative and decision table.
If the client meeting is specifically about a sudden decline, pair this library with a traffic drop diagnosis workflow. If the meeting is about organic performance, use the Organic Search vs medium=organic reconciliation guide before you turn a channel discrepancy into a client claim.
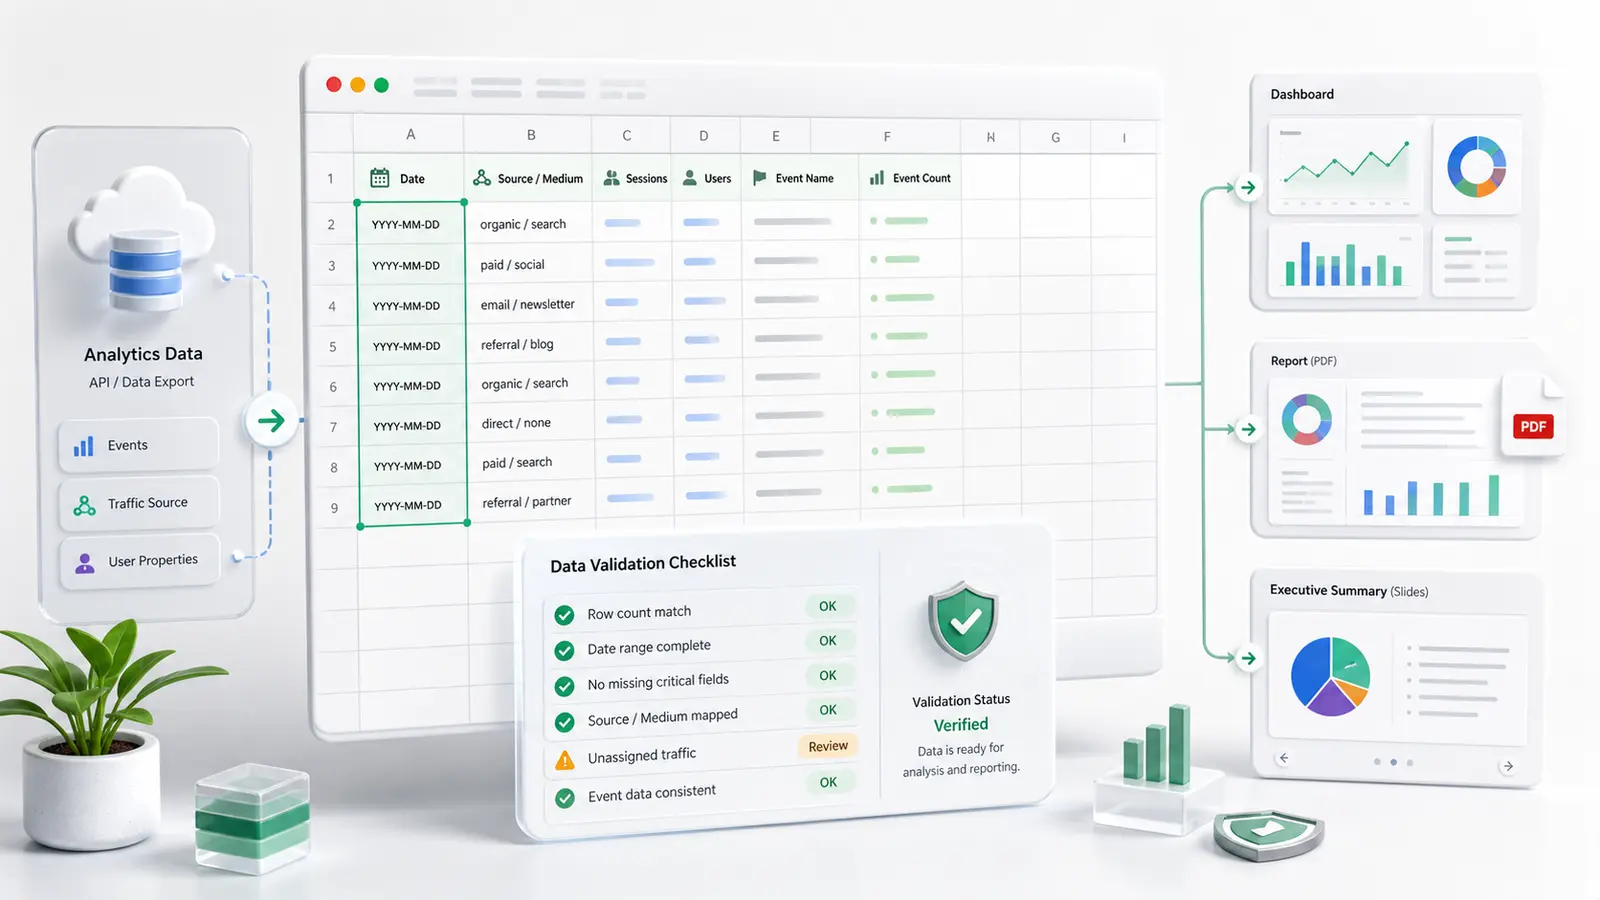
How to Verify a Prompt Answer Before You Say It Out Loud
Run this checklist before a prompt answer becomes a slide, email, or talking point.
- Same date range and timezone: GA4, ad exports, CRM, and spreadsheets must use the same period.
- Same metric definition: Confirm what counts as a lead, key event, new customer, conversion, session, or revenue event.
- Scope is named: Say whether the analysis uses user, session, event, first-user, or source/medium scope.
- Spend and denominator match: CAC needs spend and new customers from the same time window.
- Freshness is safe enough: Google's GA4 data freshness documentation says processing can take 24-48 hours and report data can change during that period.
- Exports are complete enough: Check GA4 row caps, Excel row limits, and any manually edited spreadsheet tabs.
- Every "why" claim has evidence: Tracking releases, spend changes, landing page changes, CRM movement, campaign changes, or clear source rows.
The last point is the meeting saver. A prompt can help frame a hypothesis, but a client-safe explanation needs evidence.
The Data Sources Each Prompt Depends On
The prompt library works best when every source is named and every table has a job.
GA4 reports and exports. Google's Traffic acquisition report explains where website or app visitors come from and uses cross-channel traffic source dimensions such as session source, session medium, session campaign, and session default channel grouping. Use GA4 for movement, source/medium, landing pages, key events, revenue, and attribution checks. Use the GA4 analysis workspace when the question needs repeatable analysis rather than a one-off screenshot.
GA4 BigQuery export. Google's BigQuery export documentation says GA4 can export raw event data to BigQuery and combine Analytics data with external data. Standard properties have a daily export limit of 1 million events. Streaming export is best effort, has no completeness service-level objective, and may contain gaps; daily tables are usually the safer source for complete daily analysis. Use a BigQuery analysis workflow when the question needs raw event detail, joins, or a larger analysis surface.
Excel, CSV, and Google Sheets. These are the practical glue for agency work: ad exports, budgets, campaign annotations, offline leads, and hand-edited tracking notes. A safe GA4-to-Excel export workflow helps keep the source surface, date range, filters, and row limits visible. For team collaboration, Google Sheets analysis can be a convenient source, but still treat the sheet as data that must be checked.
CRM and customer tables. Prompts about CAC, cohorts, retention, or customer quality need a customer denominator. HubSpot's CAC definition frames CAC as total marketing, advertising, and sales investment divided by customers gained in the same timeframe. If the prompt only sees ad spend and GA4 sessions, it cannot calculate true CAC.
Ad and search platform exports. Do not assume Anomaly has Google Ads or Search Console connector pages. For this article's workflow, use uploaded CSV/Excel exports, Google Sheets, warehouse/database tables, or another verified adjacent source unless source truth changes.
Where Anomaly AI Fits
Anomaly AI is useful when the prompt library has to run against real business data, not a pasted excerpt.
It is an AI data analyst for marketing reporting from connected and uploaded data. Supported workflows include GA4 through the GA4 API or BigQuery export, Excel and CSV uploads, Google Sheets, BigQuery, MySQL, Snowflake, and other supported connectors. The point is not to get a magical paragraph back. The point is to produce analysis you can inspect before it reaches a client.
For a pre-meeting marketing analytics workflow, Anomaly helps you:
- run these prompts against source-backed data instead of loose text
- keep date windows, filters, metric definitions, and business rules visible
- inspect generated logic and assumptions before trusting the answer
- turn approved findings into interactive dashboards, Excel reports, Excel-native dashboard exports, PowerPoint slides, Word docs, PDF reports, and scheduled reporting workflows
- preserve a repeatable workflow for the next reporting cycle
That is different from promising root-cause certainty or perfect attribution. Anomaly does not make every GA4 surface agree. It gives the analysis a traceable workspace where the source data, definitions, logic, and output can be checked before the meeting.
FAQ
What are the best marketing analytics prompts before a client meeting?
The best prompts ask for traffic movement, conversion quality, paid-vs-organic mix, landing page priorities, CAC, cohort quality, attribution discrepancies, reporting artifacts, client-ready narrative, and next-step recommendations. Each prompt should name the data source, date range, expected output, and verification step.
How many prompts should I run before the meeting?
Run the 10 prompts in this library if the meeting covers overall marketing performance. If the meeting has a narrower agenda, use the relevant subset, but still keep the same verification discipline: source, date range, metric definition, output, and caveat.
Can I use these prompts with GA4 exports?
Yes. You can use GA4 report exports, GA4 Data API pulls, or GA4 BigQuery export data. Use standard exports for scoped snapshots, but check the 100,000-row CSV/Sheets limit. For raw event-level analysis or joins with customer data, BigQuery export is usually a better source.
What data do I need for CAC prompts?
You need total marketing, advertising, and sales investment plus the number of new customers gained in the same timeframe. In practice, that usually means combining ad exports, finance or budget spreadsheets, CRM/customer tables, and campaign/source context.
Can Anomaly AI connect directly to Google Ads or Search Console?
Current source truth does not list Google Ads or Search Console connector pages. Use uploaded CSV/Excel exports, Google Sheets, warehouse/database tables, or another verified source for that data unless the connector source files change.
What should I do if the prompt answer contradicts GA4?
Check the scope and source first. GA4 User acquisition and Traffic acquisition use different dimensions. API pulls and UI reports can also differ because of freshness, thresholding, (other) rows, reporting identity, query specificity, and approximation. Treat the contradiction as a reconciliation task before you put the claim in front of the client.
Conclusion
A good prompt library does not make marketing analytics effortless. It makes the work easier to verify.
Before your next client meeting, use the 10 prompts to find movement, qualify the movement, reconcile the definitions, build a narrative, and turn the evidence into next steps. Then verify every claim before it becomes a slide.
If you want to run these prompts against real GA4, spreadsheet, warehouse, and customer data before your next client call, start a traceable marketing analytics workflow in Anomaly AI.