Purchase Price Variance: Formula, Examples and Analysis
Work through one month of purchases, find the suppliers and materials behind the variance, and check the result with downloadable data and an Excel report.
Anubhav Pandey··12 min read
Purchase price variance (PPV) measures the difference between the price a business expected to pay for a product or raw material and the price it actually paid. That expected price is the approved standard used to plan and review purchasing costs.
Actual prices can differ from that standard. Finance and cost-accounting teams review the difference to explain purchasing costs for the period, while procurement checks which materials, suppliers and purchasing terms need attention. Comparing both prices at the same purchased quantity separates the price effect from the cost of buying more.
Quick answer
Compare actual and standard prices at the same purchased quantity. Check which materials and suppliers contribute most, then trace those amounts to the purchase records.
Purchase price variance formula
PPV = (actual unit price − standard unit price) × actual quantity purchased
In this guide, a positive amount is unfavorable, a negative amount is favorable, and zero means you paid the standard price.
This guide works through one synthetic month's purchases and a checkable Excel report.
01Calculate PPV and read the sign
Use the standard that applies to the material's unit, currency and purchase period. AccountingTools defines purchase price variance using actual units purchased, rather than a planned purchasing quantity.
These two purchases from our synthetic October sample show both directions:
Purchase
Quantity
Actual / item
Standard / item
PPV
Stamped brackets, PUR-001
2,000
$2.05
$2.00
$100 unfavorable
Sealing gaskets, PUR-003
3,000
$0.97
$1.00
−$90 favorable
For the brackets, ($2.05 − $2.00) × 2,000 = $100 unfavorable. For the gaskets, ($0.97 − $1.00) × 3,000 = −$90, or $90 favorable.
For the bracket purchase, 2,000 items would have cost $4,000 at standard. They actually cost $4,100. The $100 difference isolates price because the quantity stays at 2,000 on both sides.
Some reports reverse the subtraction and therefore the signs. Label the result favorable or unfavorable and state your convention, so a positive number cannot be mistaken for a saving.
How we checked it: both rows come from the downloadable purchases and agree with the separate calculation script.
02Prepare and calculate the monthly report
The example contains 73 purchase lines received in October 2026, three synthetic suppliers and six approved material standards. A seventh trial material has no standard. All prices are in US dollars per item, with tax, freight, rebates and currency conversion outside the example.
The inputs are a purchasing table and a standard-price table. The purchasing table retains a unique purchase ID, receipt date, supplier ID, material ID, quantity, unit, actual unit price and currency. The standards table holds material ID, standard unit price, unit, currency and effective dates.
Download the two-sheet input workbook to follow the example. The complete example package also contains the same inputs as CSV files, an independent calculation script and the checked Excel report. Running code is optional; the files and visible arithmetic are enough to inspect the worked rows.
For your own report, write down the price basis before comparing anything. A net invoice price and a price including freight are different measures. Use a consistent basis or separate the extra costs before describing the difference as a purchasing-price effect.
This example selects received purchase lines for one month. It does not count open orders as completed purchases or combine an order, its receipt and its invoice as three separate transactions.
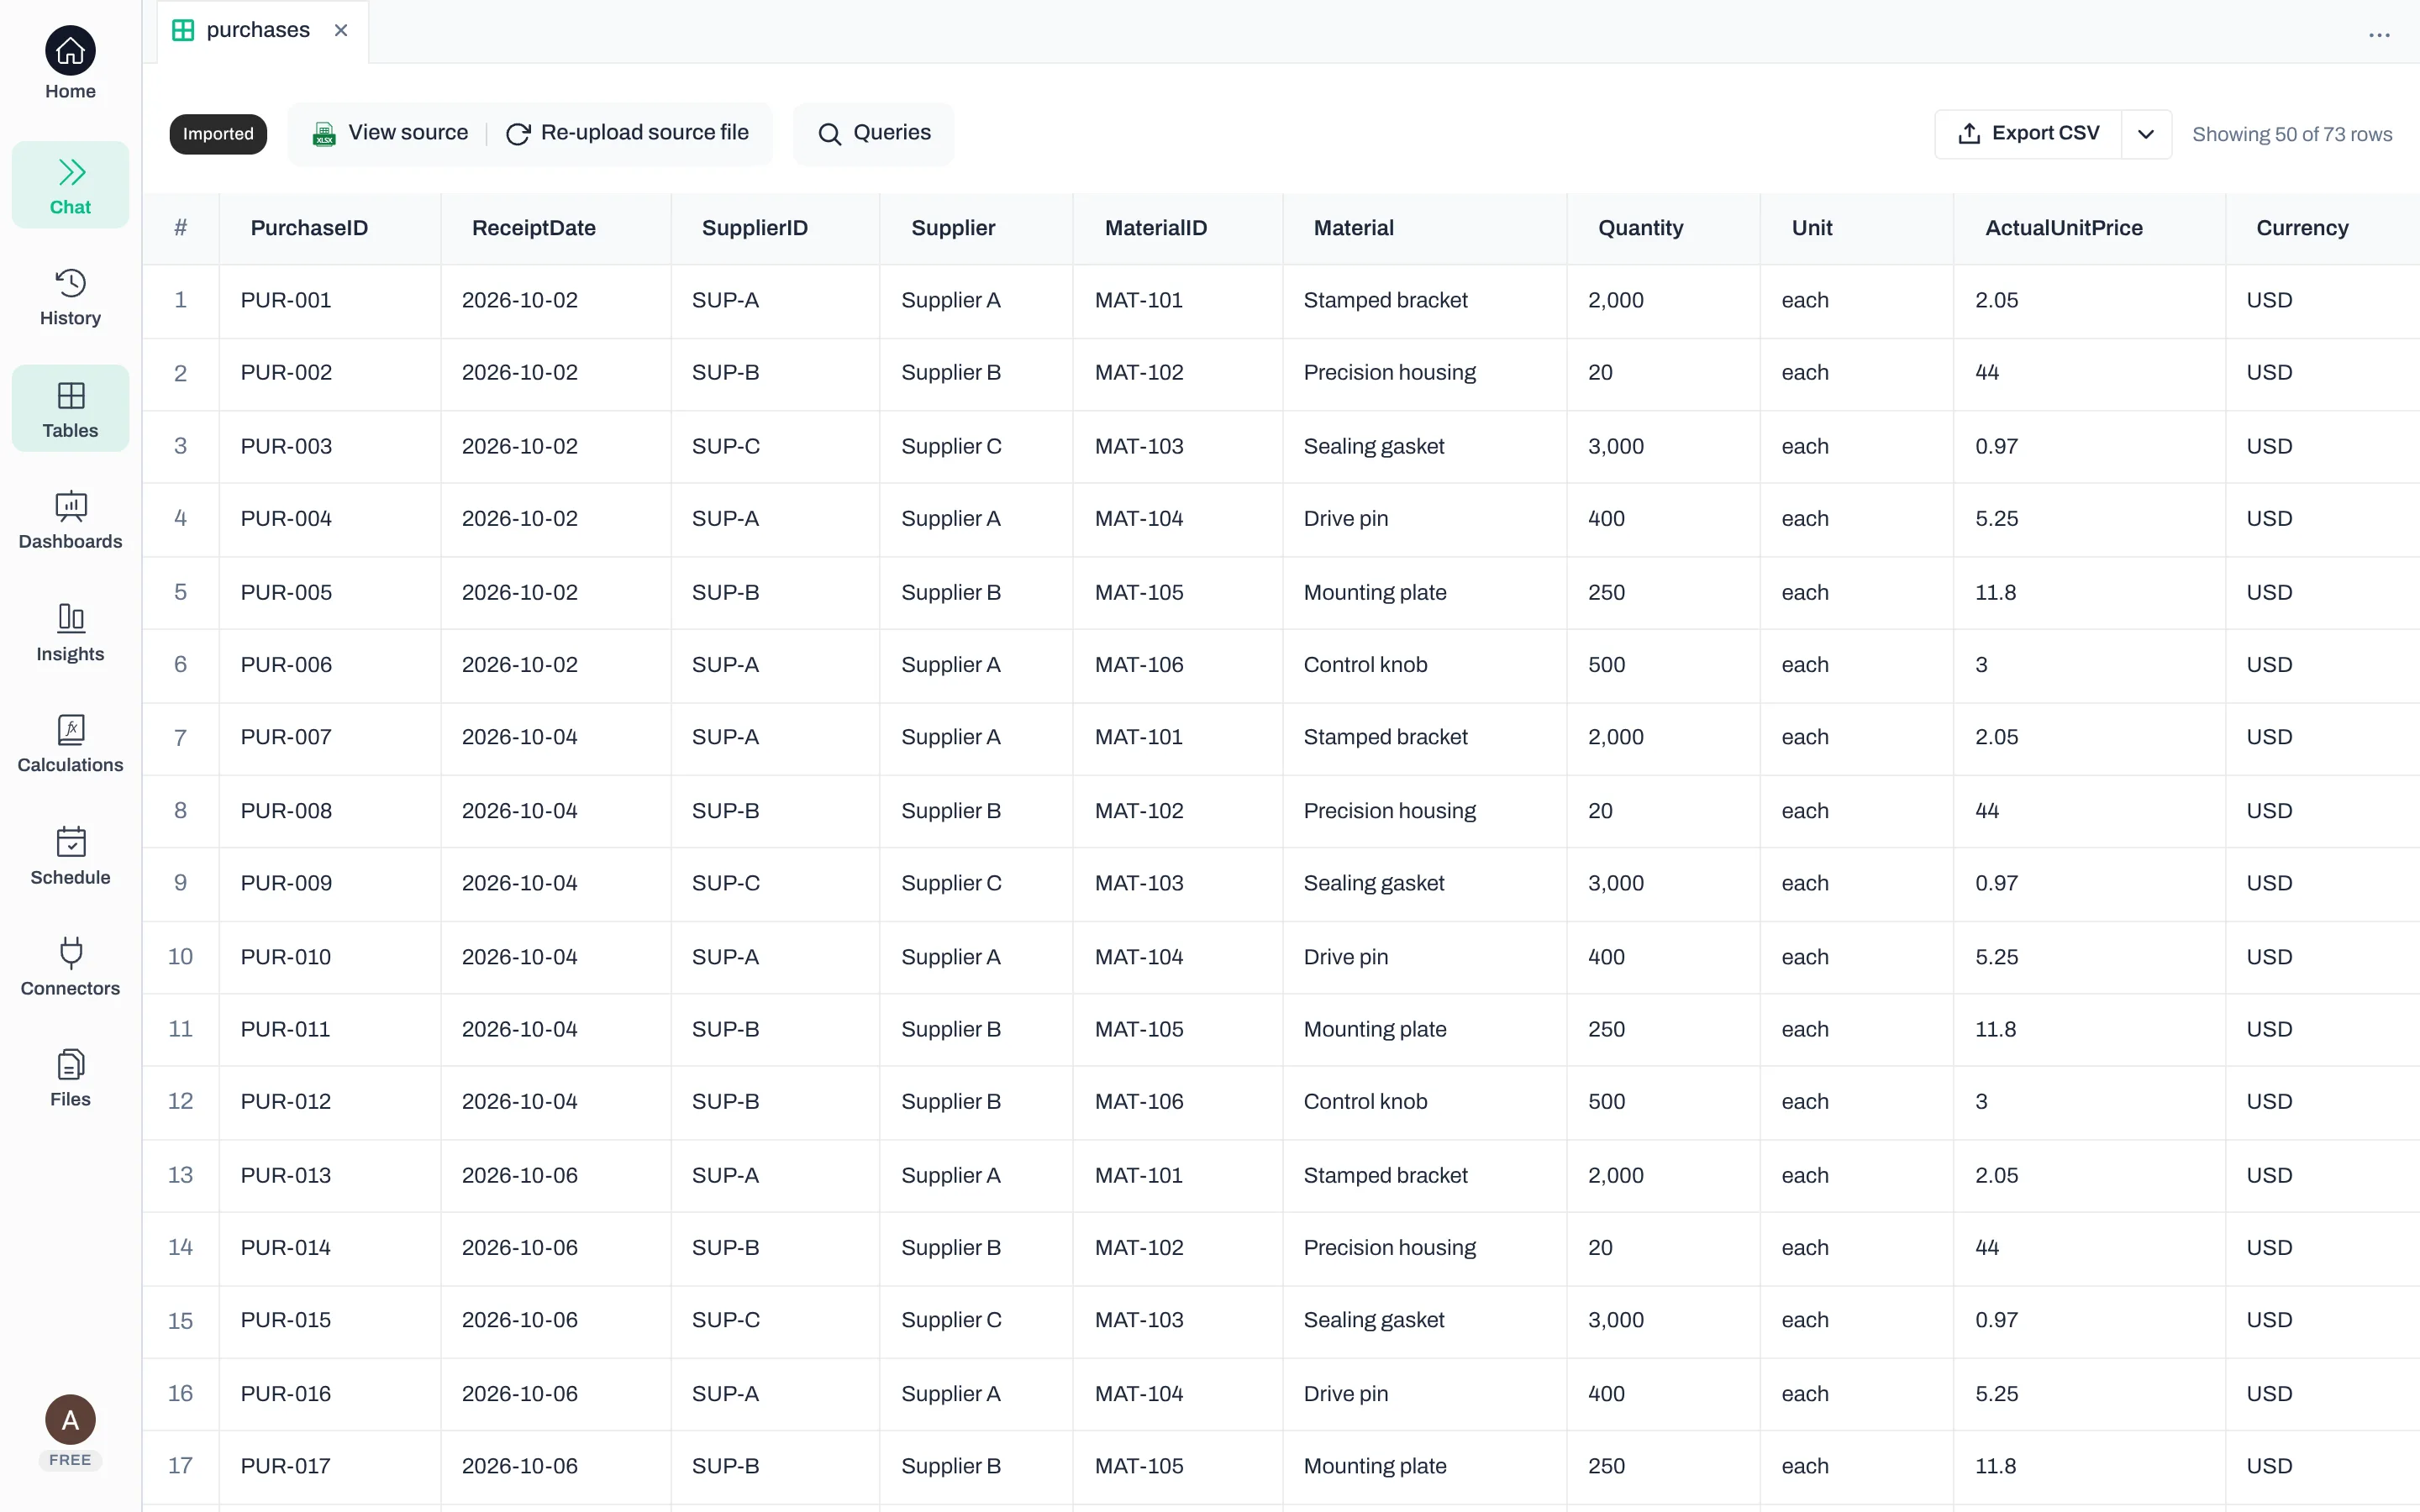
We uploaded the two-sheet sample workbook to a clean Anomaly project. It imported the 73 purchases and six standards as separate tables. Our request stated the month, matching keys, effective dates, sign convention and treatment of missing standards before asking for the analysis.
The imported purchases retain their source records
The purchases table retains purchase IDs, receipt dates, supplier and material identifiers, quantities, units and actual prices. The original source remains available from the table. First-party Anomaly screenshot; synthetic manufacturing purchasing data.
Match the applicable standard
Match the material ID, unit and currency, then confirm that the receipt date falls within the standard's effective period. The sample has one October-valid standard for each approved material. It does not require choosing between mid-month standard versions.
Check that purchase IDs are unique and that standard-price records do not overlap for the same material, unit, currency and date. A duplicated standard can multiply purchase rows when the tables are matched, increasing totals even though the source purchases have not changed.
Keep the original identifiers and prices alongside the matched standard. If you first need to compare two Excel files by their matching records, use that separate guide; this report's match has the narrower purpose of attaching the correct comparison price.
The trial spacer purchase, PUR-073, has 80 items at $7.50 each, or $600 actual cost. It has no applicable standard. Retain its actual cost on the Exceptions sheet and leave its standard price and PPV blank until finance confirms the baseline. Treating a blank standard as zero would misstate all $600 as variance.
That leaves 72 matched lines for PPV. The report still accounts for all 73 source lines: it reports the matched purchases and the unresolved $600 separately.
Calculate the matched rows in Excel
On a separate calculation sheet, after matching the correct standard, put quantity in column B, actual unit price in C and standard unit price in D. In E2, enter =(C2-D2)*B2 and copy it down the matched rows. For the bracket purchase, B2 is 2,000, C2 is 2.05 and D2 is 2.00, so E2 returns 100.
If you use Anomaly, include the matching and exception rules in your request. For example:
Match October purchases to standards by material ID, unit, currency and effective date. Keep purchases with no applicable standard as exceptions. Calculate PPV using actual purchased quantity and label positive amounts unfavorable. Show supplier and material contributions, favorable offsets and the purchase records behind Supplier A's total.
How we checked it: the frozen inputs have unique purchase IDs, one applicable standard for each matched line, and one retained missing-standard exception.
03Reconcile the total and its contributions
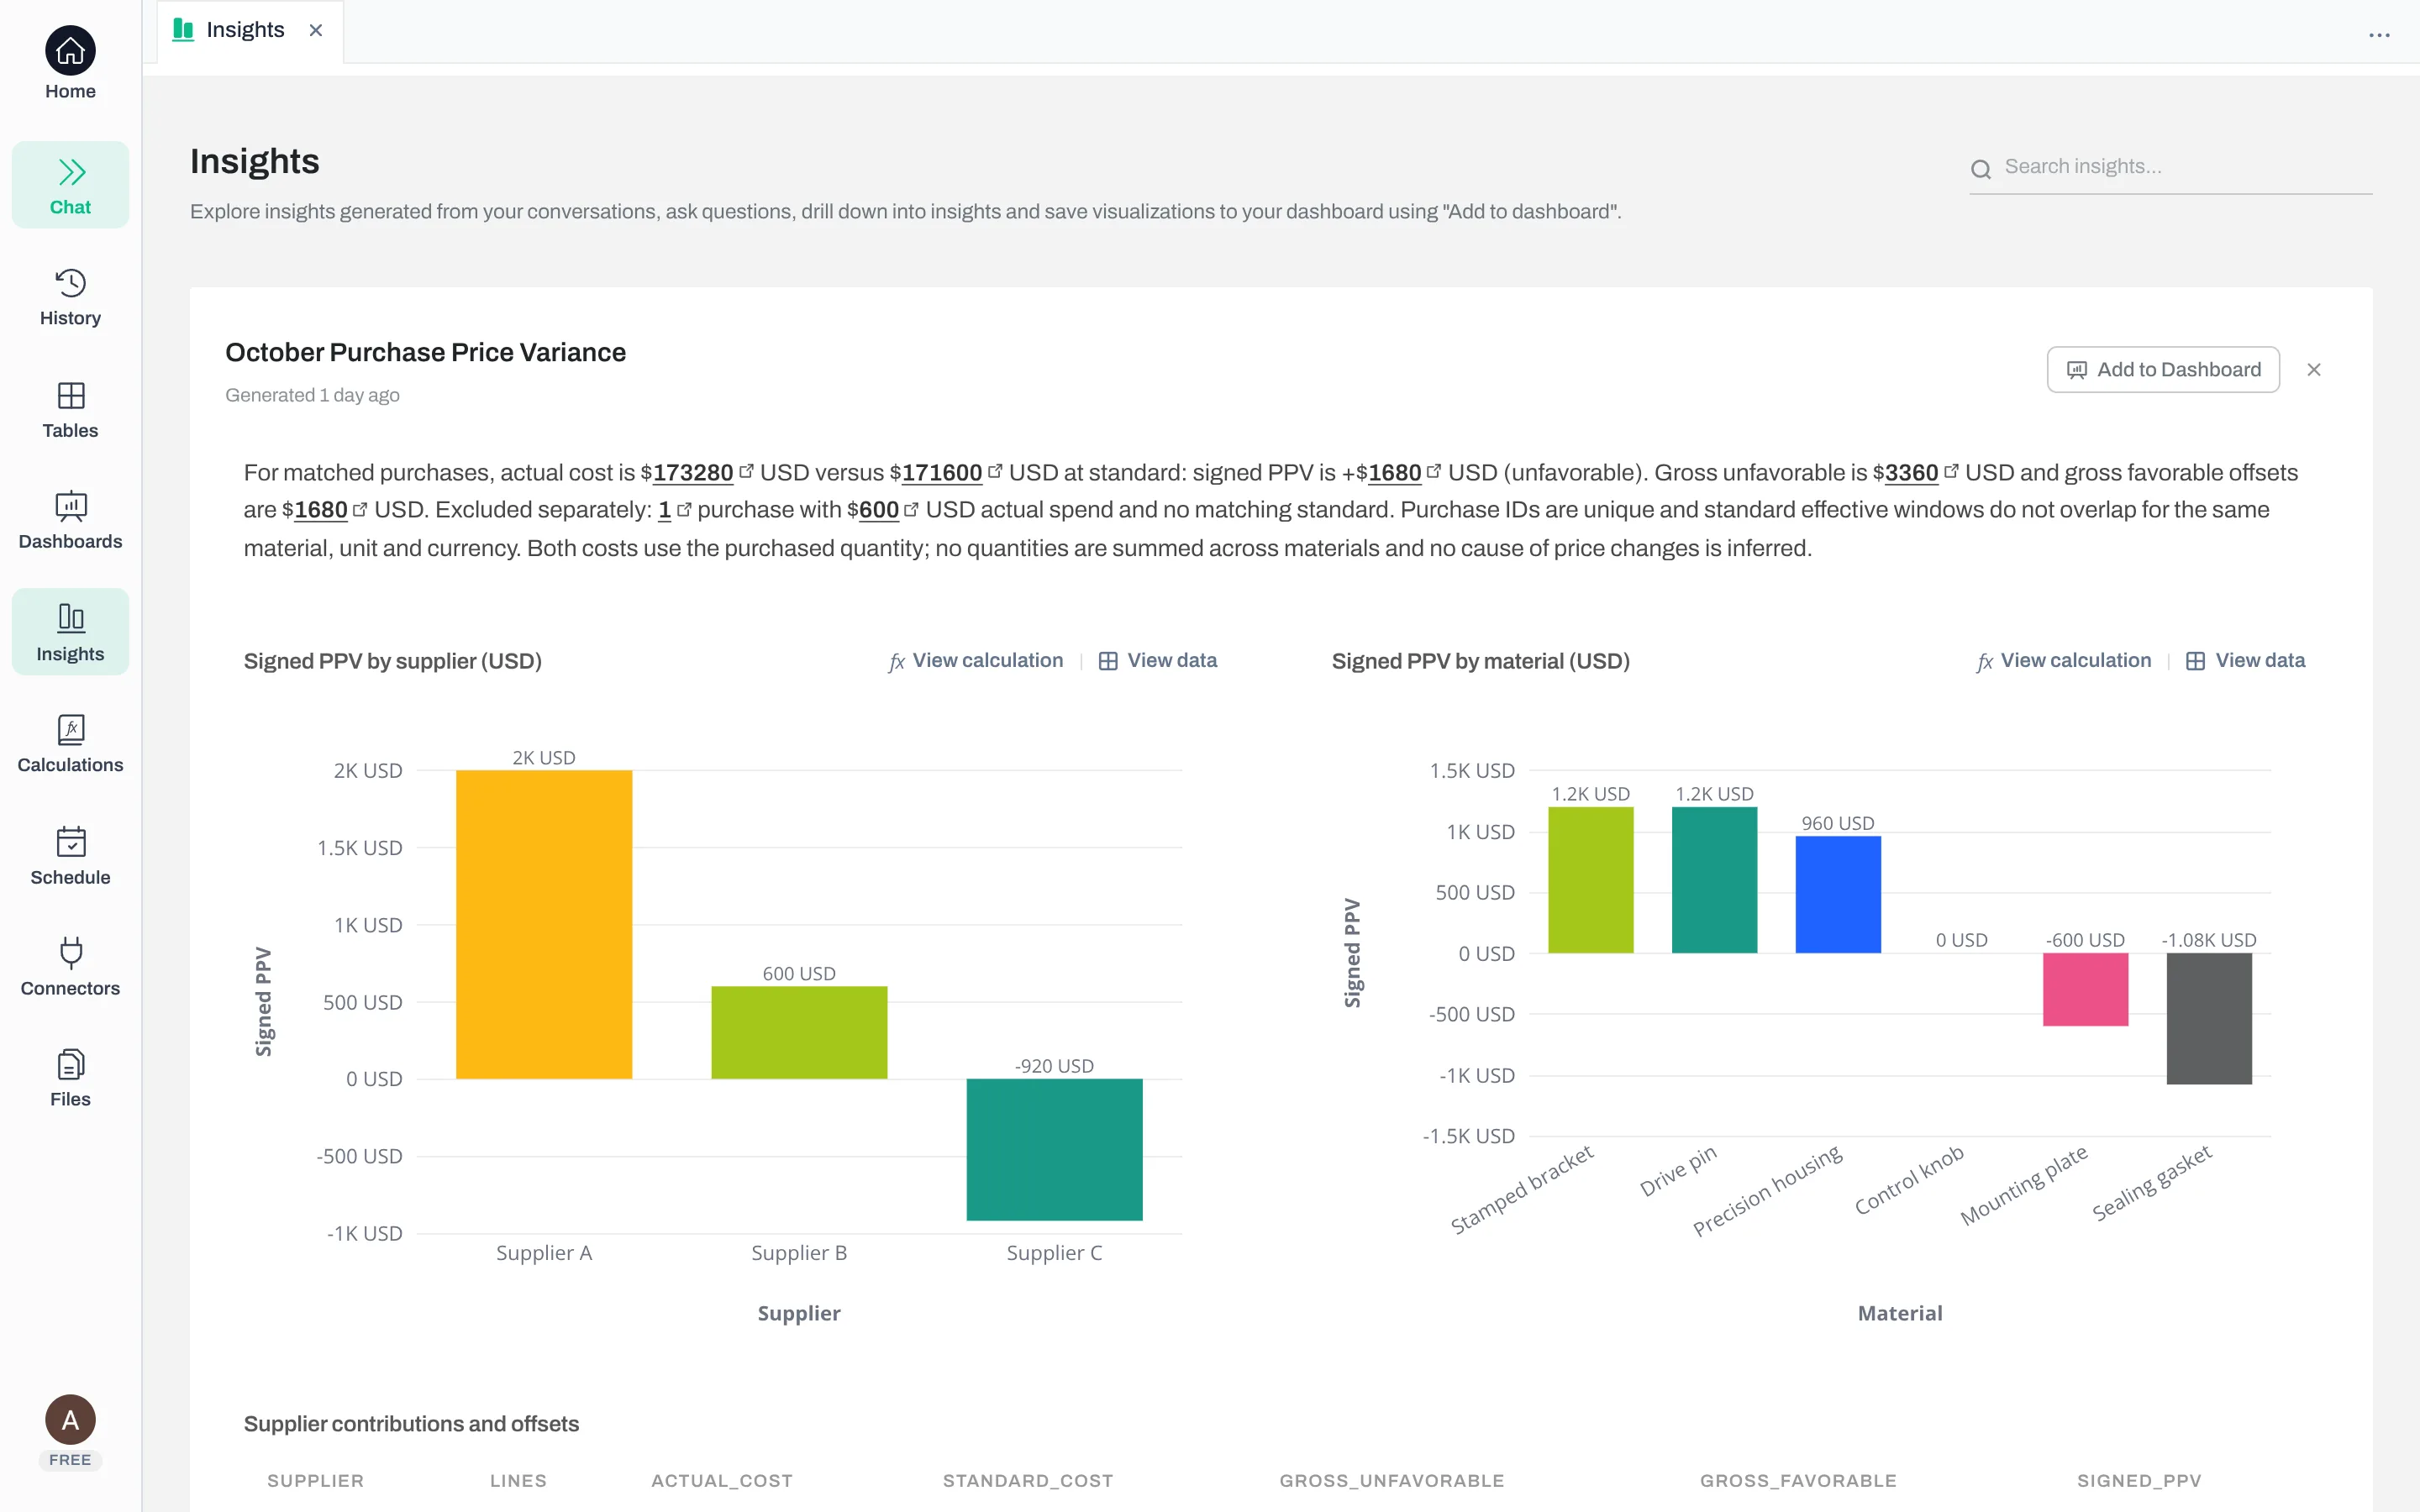
Calculate each matched line first and sum its monetary variance. For the 72 eligible lines, actual cost is $173,280 and cost at standard is $171,600. Their difference is $1,680 unfavorable.
The source purchasing file contains $173,880 of actual cost. That reconciles to $173,280 in the matched analysis plus $600 in the missing-standard exception. The exception has actual spend but no valid PPV yet.
Show the offsets as well as the net result. Unfavorable purchases contribute $3,360; favorable purchases offset $1,680. Subtracting the favorable amount from the unfavorable amount gives the $1,680 net unfavorable result. Looking only at the net would hide some purchases worth investigating.
The monthly total, with its supplier and material contributions
The saved insight retains the favorable offsets: Supplier C's $920 favorable contribution reduces the net unfavorable result. The summary also identifies the separate $600 purchase without a standard. First-party Anomaly screenshot; synthetic manufacturing purchasing data.
The supplier breakdown is:
Supplier
Actual cost
Cost at standard
Signed PPV
Interpretation
Supplier A
$64,000
$62,000
+$2,000
Unfavorable
Supplier B
$66,600
$66,000
+$600
Unfavorable
Supplier C
$42,680
$43,600
−$920
Favorable
Matched total
$173,280
$171,600
+$1,680
Unfavorable
Supplier A's unfavorable contribution exceeds the net total because favorable amounts elsewhere offset it. A signed table or bar chart makes that relationship clearer than a pie chart of shares of the net result.
Which materials explain the variance?
Read the same matched purchases by material. Stamped brackets and drive pins each contribute $1,200 unfavorable. Precision housings contribute $960 unfavorable. Sealing gaskets contribute $1,080 favorable, mounting plates contribute $600 favorable, and control knobs are on standard.
The material total must equal the supplier total and the sum of the purchase rows. These are three views of the same purchases, not three independent amounts to add together.
Rank by the monetary contribution to the report before investigating a unit-price percentage. One precision-housing purchase is 10% above standard, but its 20 items create $80 unfavorable PPV. The bracket purchase is only 2.5% above standard, yet its 2,000 items create $100 unfavorable PPV. The larger percentage does not produce the larger financial effect.
If you need a percentage for the whole matched report, divide net PPV by cost at standard for those same purchases: $1,680 ÷ $171,600 × 100 = approximately 0.98% unfavorable. Do not average purchase-row percentages or include the unmatched $600 in that denominator.
How we checked it: Anomaly created a purchase-detail table and saved insight. We compared all 73 product rows and the supplier/material totals with the separately calculated results; the net PPV and exception agreed.
04Trace Supplier A and inspect the Excel report
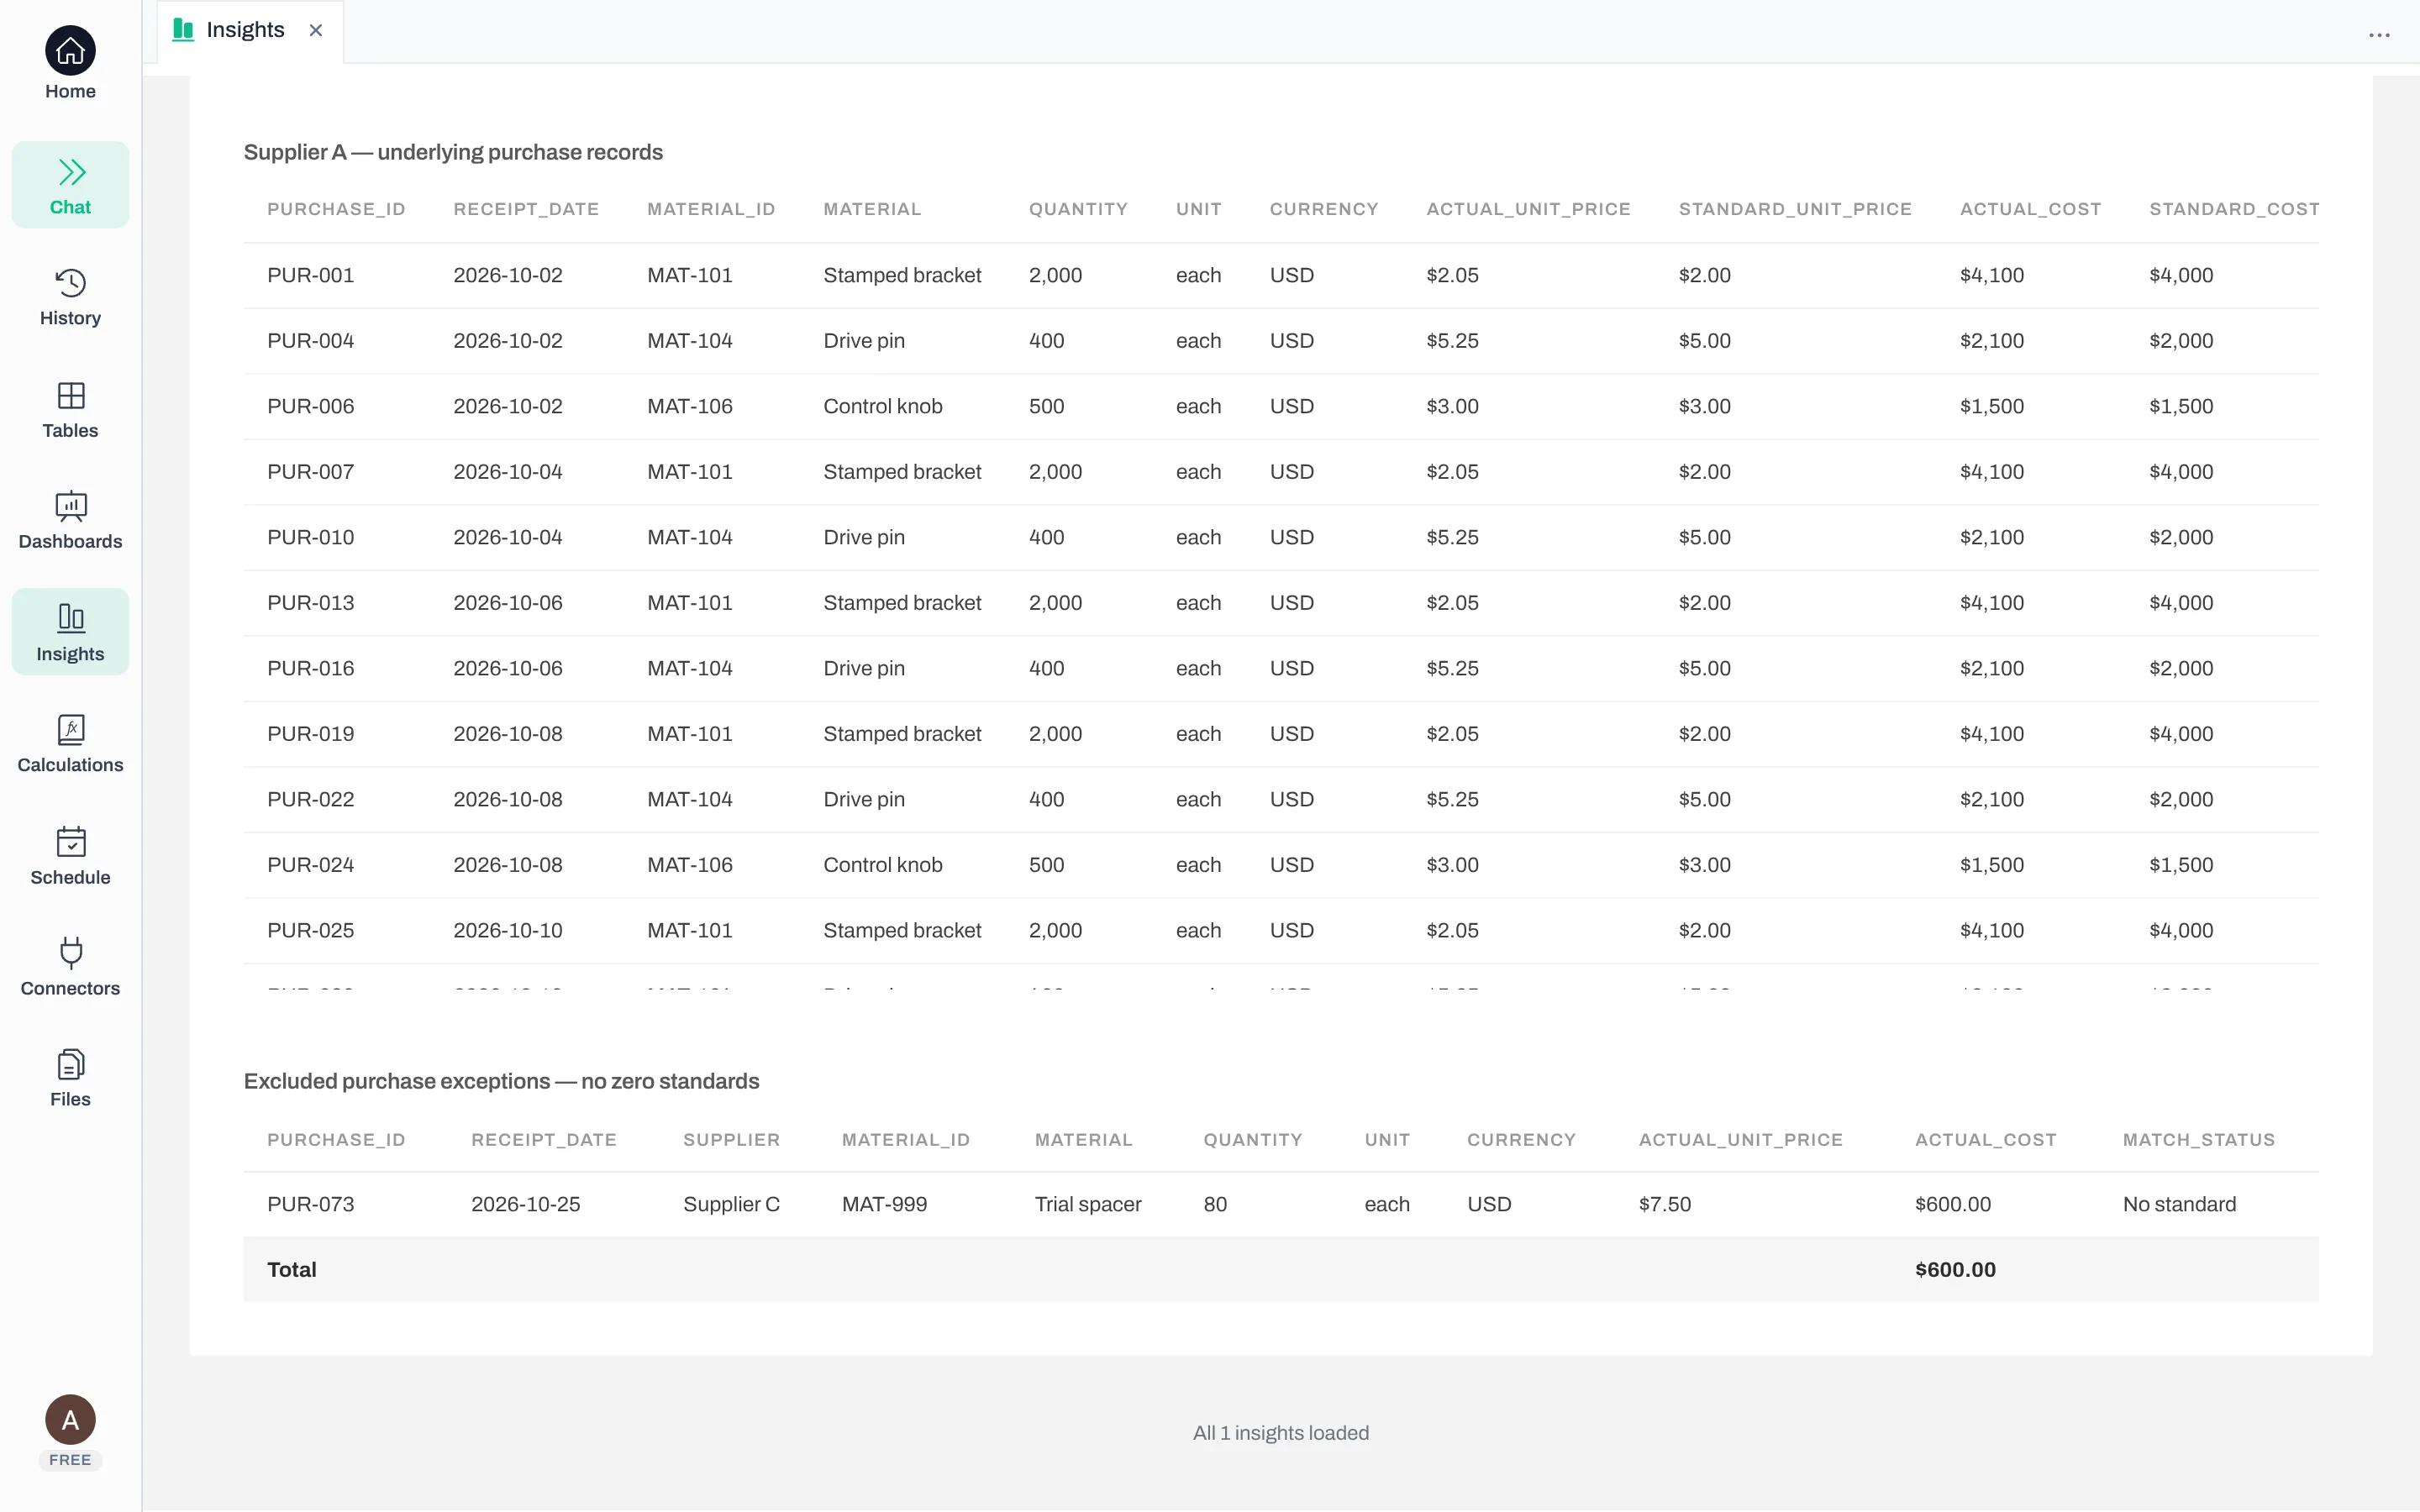
Follow a contribution back to its records before using it in a meeting. The saved insight included all 24 Supplier A purchases. Eight bracket purchases contributed $800 unfavorable, twelve drive-pin purchases contributed $1,200 unfavorable, and four control-knob purchases were on standard. Together they explain Supplier A's $2,000 unfavorable total.
For the first bracket purchase, PUR-001, the detail retained the 2,000 items, $2.05 actual price and $2.00 standard behind its $100 variance. That connection lets a reviewer check the number rather than accepting the chart alone.
Inspect the purchases behind Supplier A
Supplier A's rows keep quantities and actual/standard prices together. The separate $600 purchase without a standard remains visible below them. First-party Anomaly screenshot; synthetic manufacturing purchasing data.
Inspect the generated Excel report
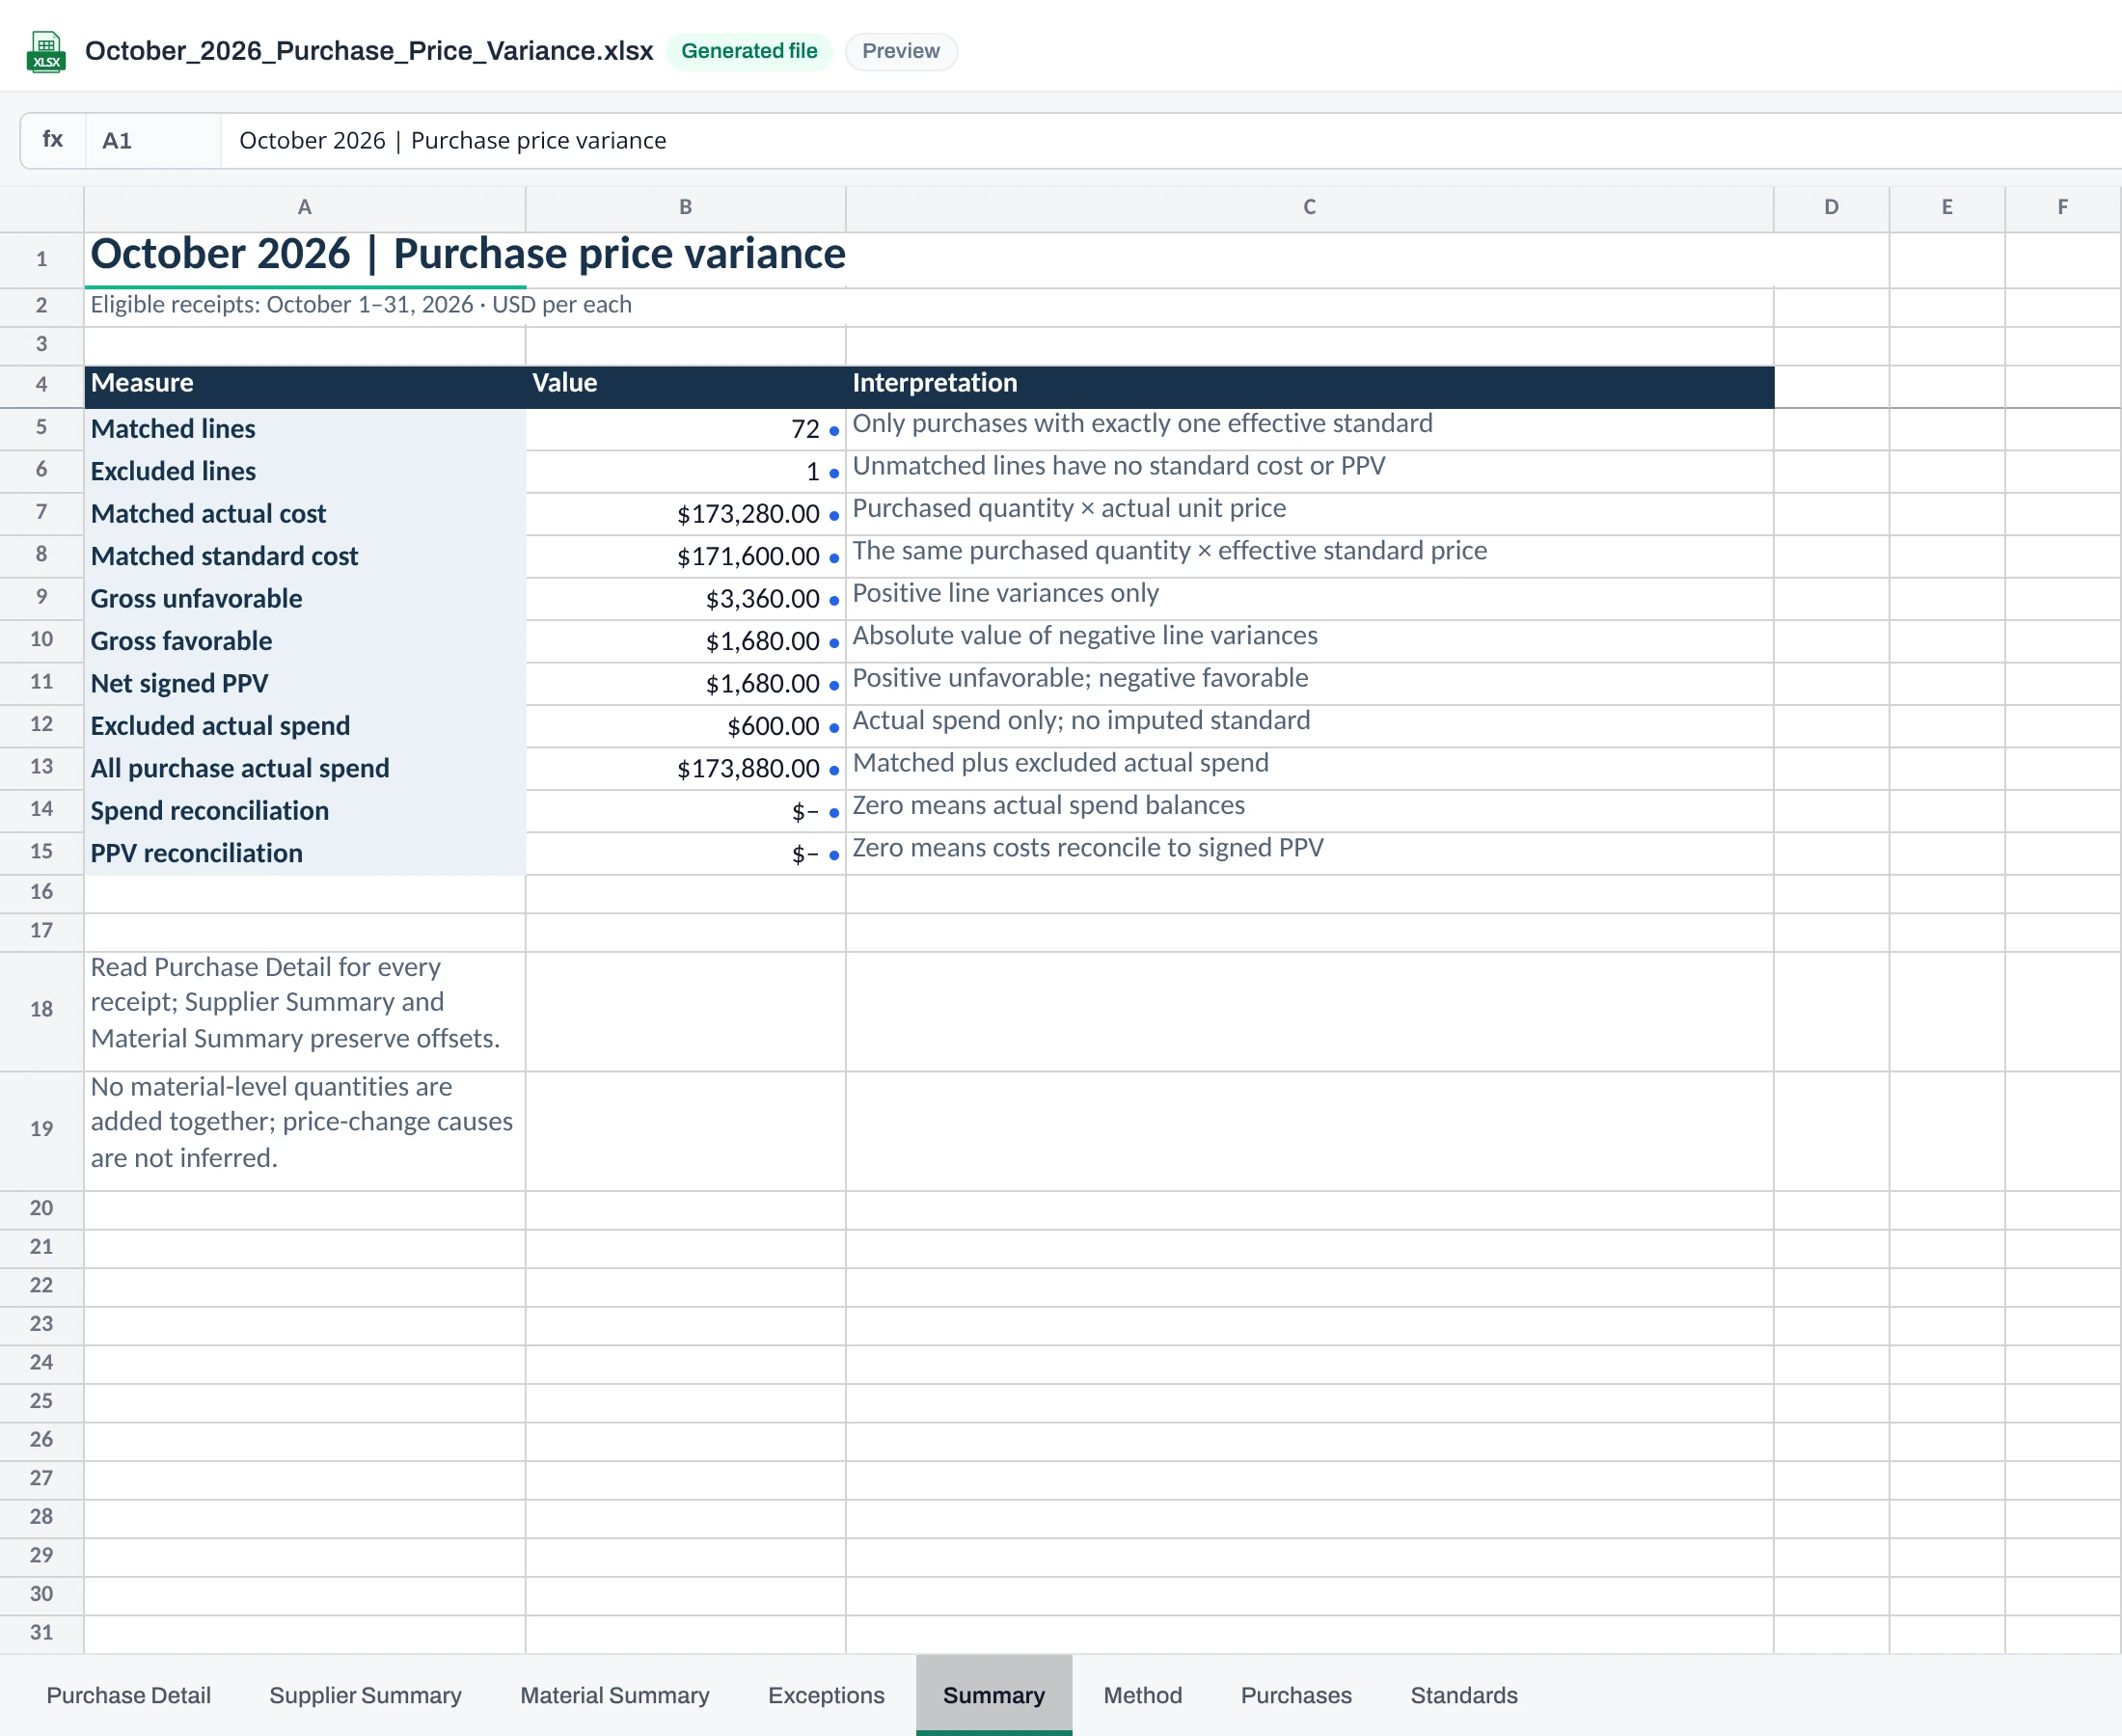
We then asked Anomaly to turn the analysis into a downloadable Excel report. The generated workbook contains eight sheets: Purchase Detail, Supplier Summary, Material Summary, Exceptions, Summary, Method, Purchases and Standards.
The detail sheet keeps the source identifiers, matching status and actual/standard prices beside formula-based extended costs and PPV. Supplier and material summaries roll up those amounts. The Summary sheet shows the matched and excluded purchases, gross offsets, net variance and two reconciliation checks that both return zero. The missing-standard price and PPV remain blank on the Exceptions sheet.
Download the checked October PPV report to inspect its formulas and calculated values. We compared the downloaded workbook's purchase rows and summary totals with the independent result. This file is a snapshot of the verified example: replacing the source files requires running the matching and analysis again.
A useful handoff retains the purchase detail and the standards behind the summary. It also keeps unresolved records visible, so the next person can distinguish an approved comparison from an assumption that still needs confirmation.
The generated workbook's Summary sheet
The generated Excel report in Anomaly's read-only sheet view shows the Summary and reconciliation checks. First-party Anomaly screenshot; synthetic manufacturing purchasing data.
How we checked it: we froze the synthetic files and calculated the answer separately before the product run. The independent script and results are in the download package. The product demonstration and workbook were checked on November 6, 2026. This verifies the supplied one-month sample; it does not test later source replacement or changed standards.
05Decide what finance and procurement should investigate
A contribution identifies where the calculated difference sits. It does not establish why the price changed or who caused it. Compare the relevant purchase terms, order sizes, material specification and standard assumptions before drawing a conclusion about a supplier or buyer.
Finance needs a reconciled explanation for the period's costs and budget gap. Procurement needs to know which materials, suppliers and purchasing terms deserve attention. Both can follow the same investigation.
Consider a hypothetical review, separate from the verified $1,680 October example. Purchasing spend is $200,000 higher than in the previous period. That increase is not automatically PPV: buying more or changing the mix of products can also increase spending. Work through these questions:
Which material explains the increase? Steel accounts for $80,000 of the additional spending. Start there, while keeping the rest of the increase in the reconciliation.
Which suppliers contribute? Purchases from three suppliers account for $65,000 of that steel increase. Trace their contributions to purchase records and check the agreed terms.
Is it price, quantity or both? Suppose the quantity-weighted unit price for the same steel grade is 7% higher than last period, with units, freight and tax treated consistently. Check quantities and supplier mix separately before calling the spending increase a price effect. Calculate formal PPV against the approved standard using the actual purchased quantities.
Is the change new or continuing? Suppose comparable steel prices have risen in each of the last three months. Review that history to see whether this month continues an existing pattern or introduces a new change.
How does it compare with the market? Compare with an independent steel-price index or comparable quotes. Similar market movement supports a broader-price explanation, but does not prove the cause. Procurement can still assess negotiation, alternative suppliers or purchasing timing; finance can review the budget assumptions.
The verified October example above covers the monthly calculation and supplier/material contributions in US dollars. It does not contain the history or market data needed for these later checks.
An outdated standard can make the variance reflect an unrealistic baseline. AccountingTools notes that standard prices depend on purchasing assumptions; a purchasing-volume assumption that no longer fits can change the comparison. Keep a recorded explanation when you revise the standard, rather than changing it simply to make a variance disappear.
A favorable material price is also not proof of better overall economics. Quality, scrap, inventory holding and delivery costs can change the wider result. To review the wider manufacturing margin gap, follow the separate tender-margin guide after isolating this price component.
If comparable prices move with the wider market, procurement can reassess supplier options and purchasing timing while finance revisits its cost forecast and budget assumptions. If one supplier diverges under comparable terms, inspect that supplier's contract and charges before deciding whether to negotiate.
06Check the report before sharing it
Confirm the month, price basis and sign convention. Check that each matched purchase has one applicable standard and that matched purchases plus exceptions reconcile to the source.
The report names the month, price basis and sign convention.
Each matched purchase has one applicable standard in the same unit and currency.
Source-line counts and spend reconcile to matched purchases plus exceptions.
Supplier and material PPV totals equal the purchase-detail total.
Favorable and unfavorable contributions remain visible alongside the net amount.
A reviewer can trace a supplier contribution to its purchases and see any unresolved standard.
Questions that arise after the calculation
An enterprise resource planning (ERP) system records purchasing and inventory transactions. Formal posting depends on the accounting setup. SAP's goods-receipt and invoice documentation explain why inventory price control and transaction order matter. The operational report above does not prescribe journal entries.
What if there is no approved standard price?
Report the purchase as an exception with its actual cost and ask the responsible finance or procurement owner to confirm the baseline. You can compare prices with a prior period or another quote for a different purpose, but label that comparison accurately. It is not standard-based PPV until a valid standard is established.
What if the standard changes during the month?
Retain effective dates and match each purchase to the applicable standard under your reporting policy. Check for overlapping records before matching the tables. Our sample uses one standard per material for the whole month; it does not demonstrate a mid-month change.
Why might an ERP's PPV total differ from this report?
Check the period, set of purchases, price basis and accounting treatment. Receipt and invoice dates can differ, invoices may introduce later adjustments, and inventory valuation methods affect posting. This is an operational purchase-line analysis. Use your ERP configuration and accounting policy to reconcile the accounting records; do not assume a difference proves either calculation is wrong.
Is purchase price variance the same as invoice price variance?
Not necessarily. This guide compares actual purchase prices with approved standard prices. An invoice-price check may compare the invoice with the purchase-order price instead. State the two prices being compared, rather than treating the labels as interchangeable.
How is PPV different from material usage variance?
PPV compares prices at actual purchased quantities. Material usage variance compares material used with the standard quantity allowed for actual production, valued at standard price. Purchases and use may fall in different periods, as Lumen explains. Reconcile their quantities and timing before combining reports. For wider budget comparisons, use the budget versus actual variance analysis guide.