Financial Dashboard: Examples From One Month-End Export
Choose useful finance KPIs, explain changes in profit and cash, and check the figures before your monthly review. Follow one downloadable, worked example.
Anubhav··11 min read
Quick answer: what should a financial dashboard show?
A financial dashboard brings the figures for a business decision into one view: profitability, cash, spending against budget and money customers still owe. Show the reporting date and comparisons, then connect each result to its source. AI can help build the views and inspect the working; use agreed definitions and checked totals before drawing conclusions.
Your monthly review opens with good news: revenue grew. Then someone asks why profit fell and the bank balance is lower. Follow one review in Anomaly, from attaching the financial files to checking a finding you can explain at the meeting.
What is a financial dashboard for?
A financial dashboard brings your key financial metrics into one view so your finance team can spot changes, investigate the numbers behind them and decide what to do next. A CFO dashboard applies the same idea to leadership reviews. Compare periods, inspect the source of an unexpected result, then assign a follow-up. A chart flags the question; it does not establish the cause.
The worked monthly review
Here is how to create a financial dashboard from one month-end export. The example follows a fictional equipment-and-services business through five files covering October 2025 to September 2026. We compare August with September at 30 September 2026. All amounts are US dollars, shown with $. These synthetic figures were checked with two separate calculation methods; they are not customer results or complete statutory accounts.
The overview includes EBITDA: earnings before interest, tax, depreciation and amortization. Step 2 explains how it connects gross profit to operating profit in this example.
The monthly review, before the detail
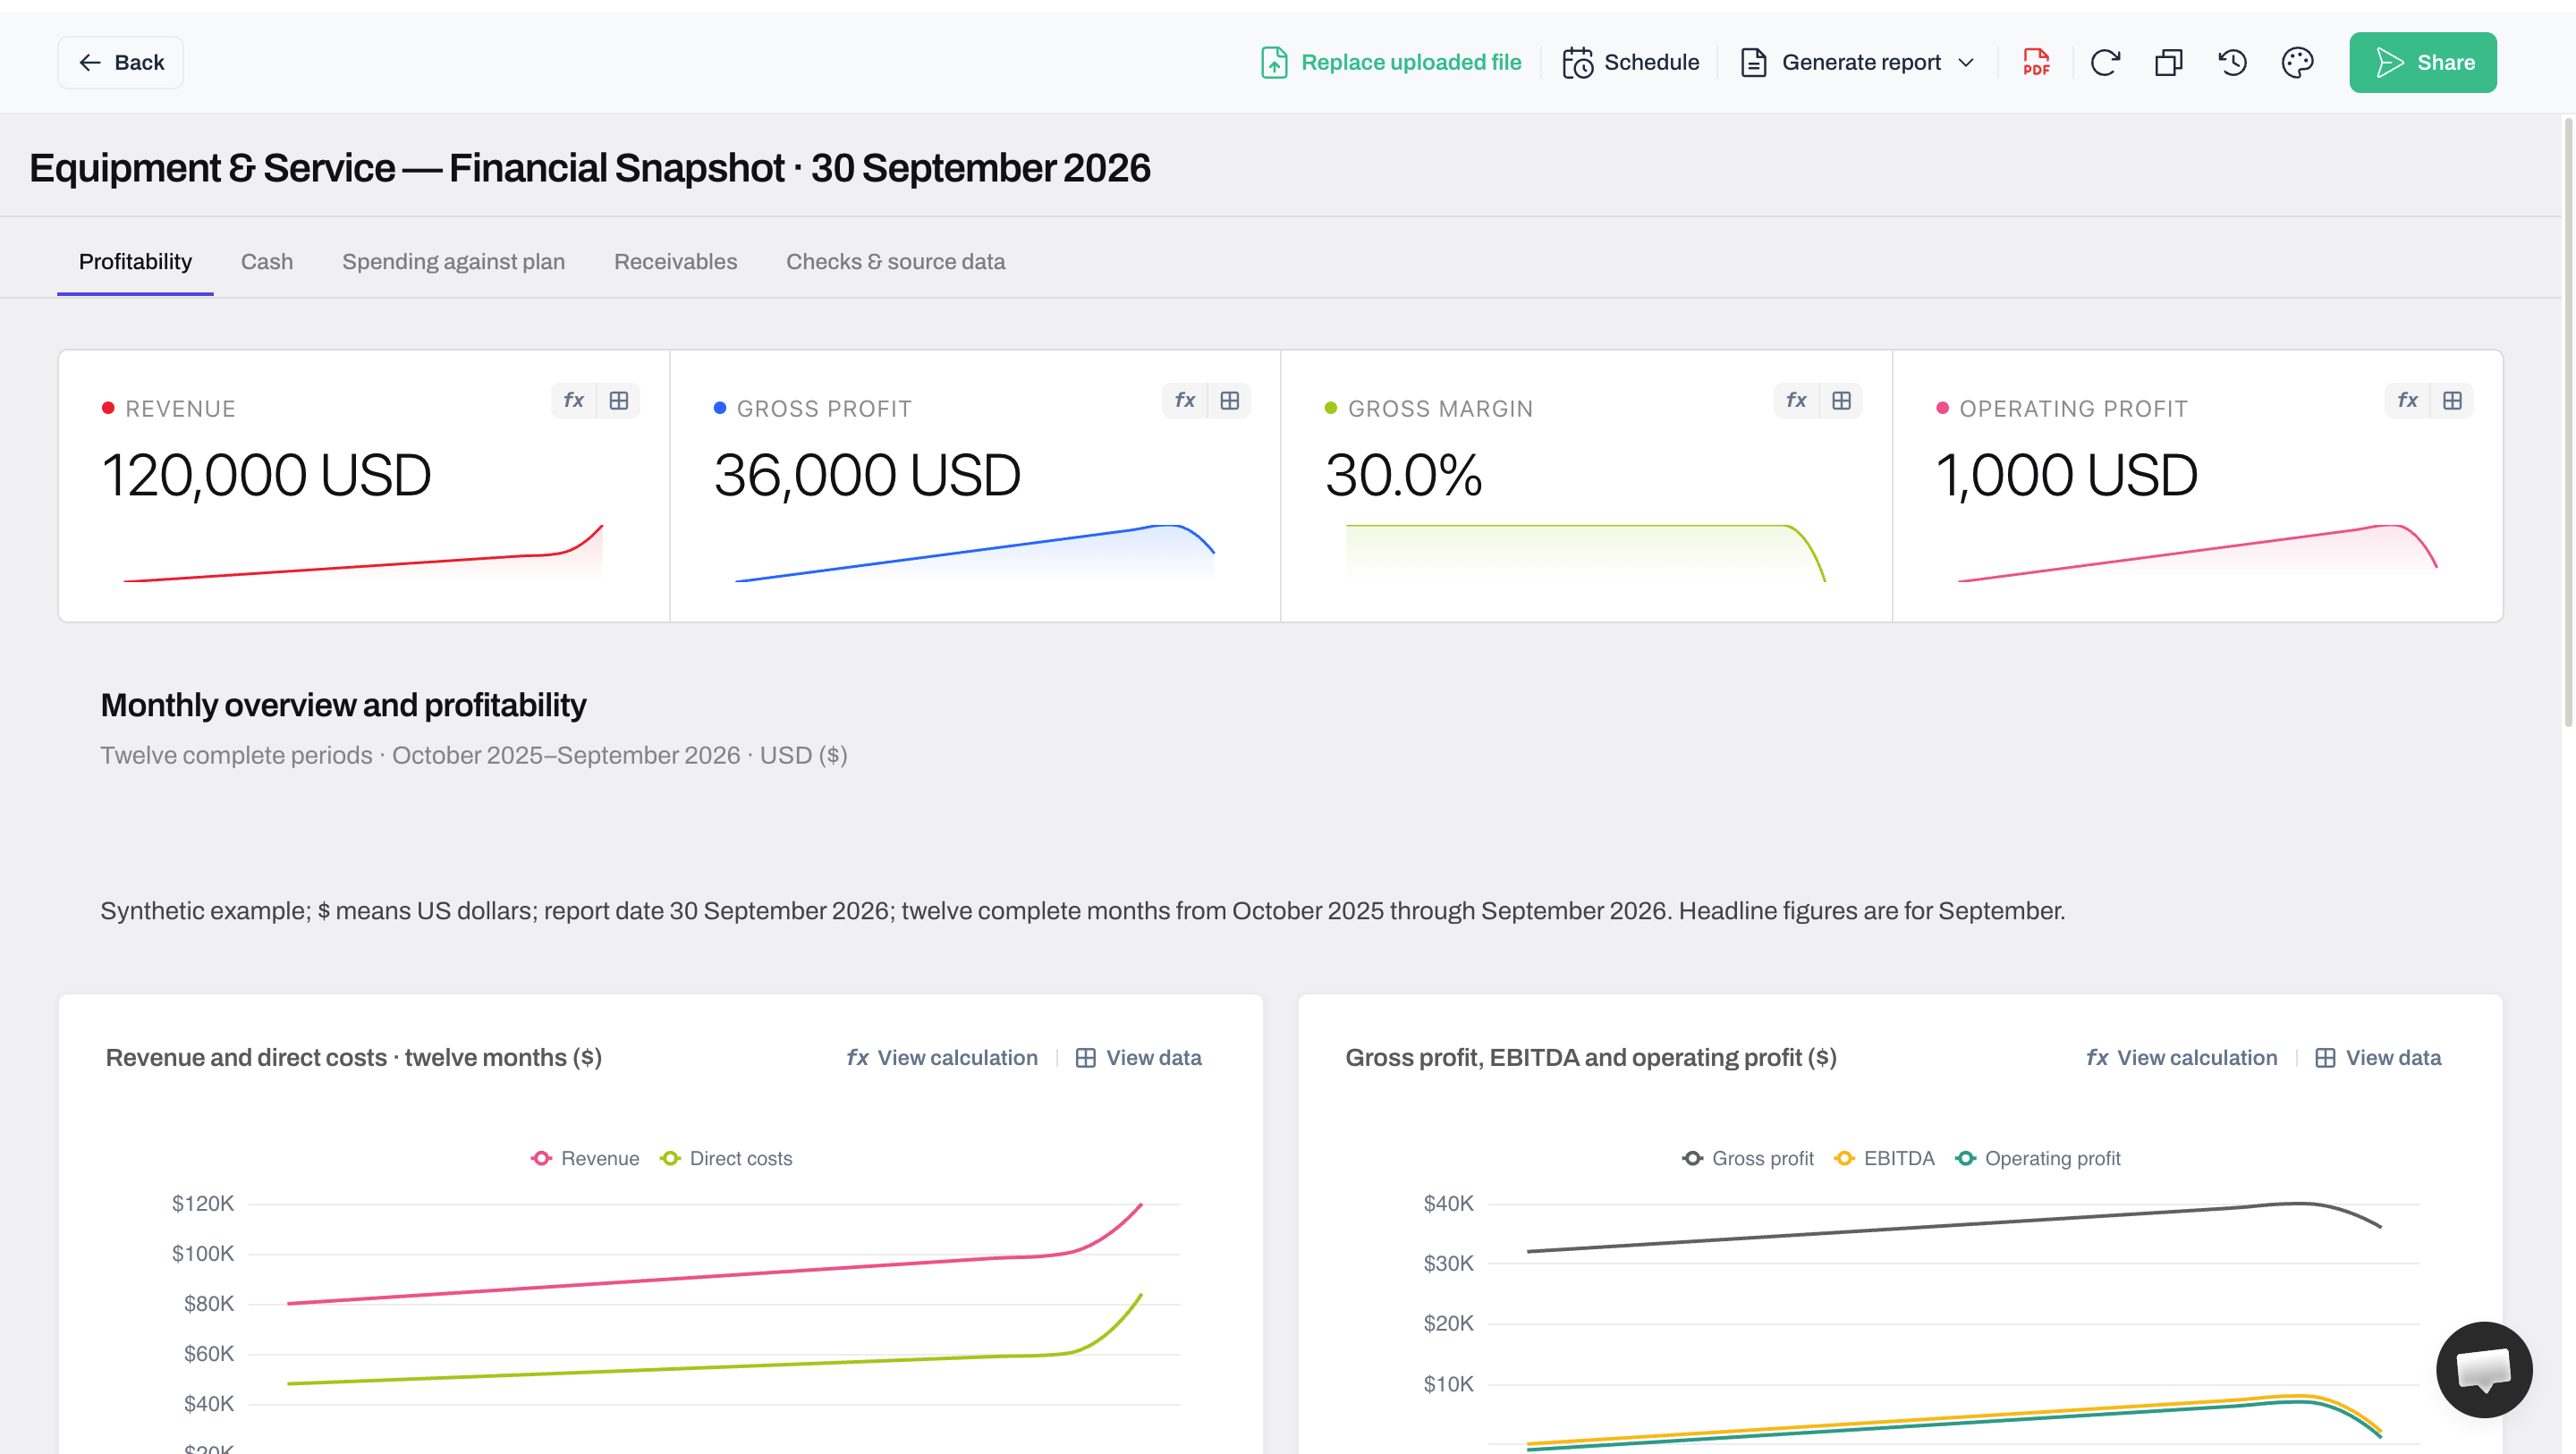
Start with the reporting date and the profitability overview. The other tabs take the review into cash, spending and collections. First-party Anomaly screenshot; synthetic business-finance data.
A KPI, or key performance indicator, tracks performance. Choose your financial KPIs around these three questions. Here is what the September example shows:
Question
Finding in this example
What to check next
Profitability: are higher sales producing more profit?
Revenue rose to $120,000, but operating profit fell to $1,000 and gross margin to 30%.
Inspect direct costs and the contribution of each business unit.
Cash movement: why did the bank balance change?
Cash fell $30,000 to $164,000, including a $20,000 equipment payment.
Follow customer receipts, operating payments and the equipment purchase.
Financial exceptions: what needs attention?
Direct costs were $8,000 over the original budget but $4,000 below the adjusted allowance. Overdue invoices total $36,000.
Compare costs at actual order volume, then inspect overdue invoices.
Put the reporting date and headline comparison first. Use lines for trends, bars for comparisons and tables for follow-up amounts. Label dollar and percentage scales separately; colour should support labels, not replace them.
01Attach the files and set the reporting date
Start a clean Anomaly project and attach these sources. The fifth file is needed only for the adjusted-budget comparison:
Profit and loss: Include the period, account, business unit, amount and a unique line identifier.
Bank movements: Include the transaction date, category, signed amount and a unique transaction identifier.
Budget: Supply one amount per period and account.
Open invoices: Include the invoice identifier, due date, report date, invoice amount, applied payments, credits and remaining balance.
Activity model: Supply planned and actual orders, fixed direct cost and variable direct cost per order.
1. Attach the sources together
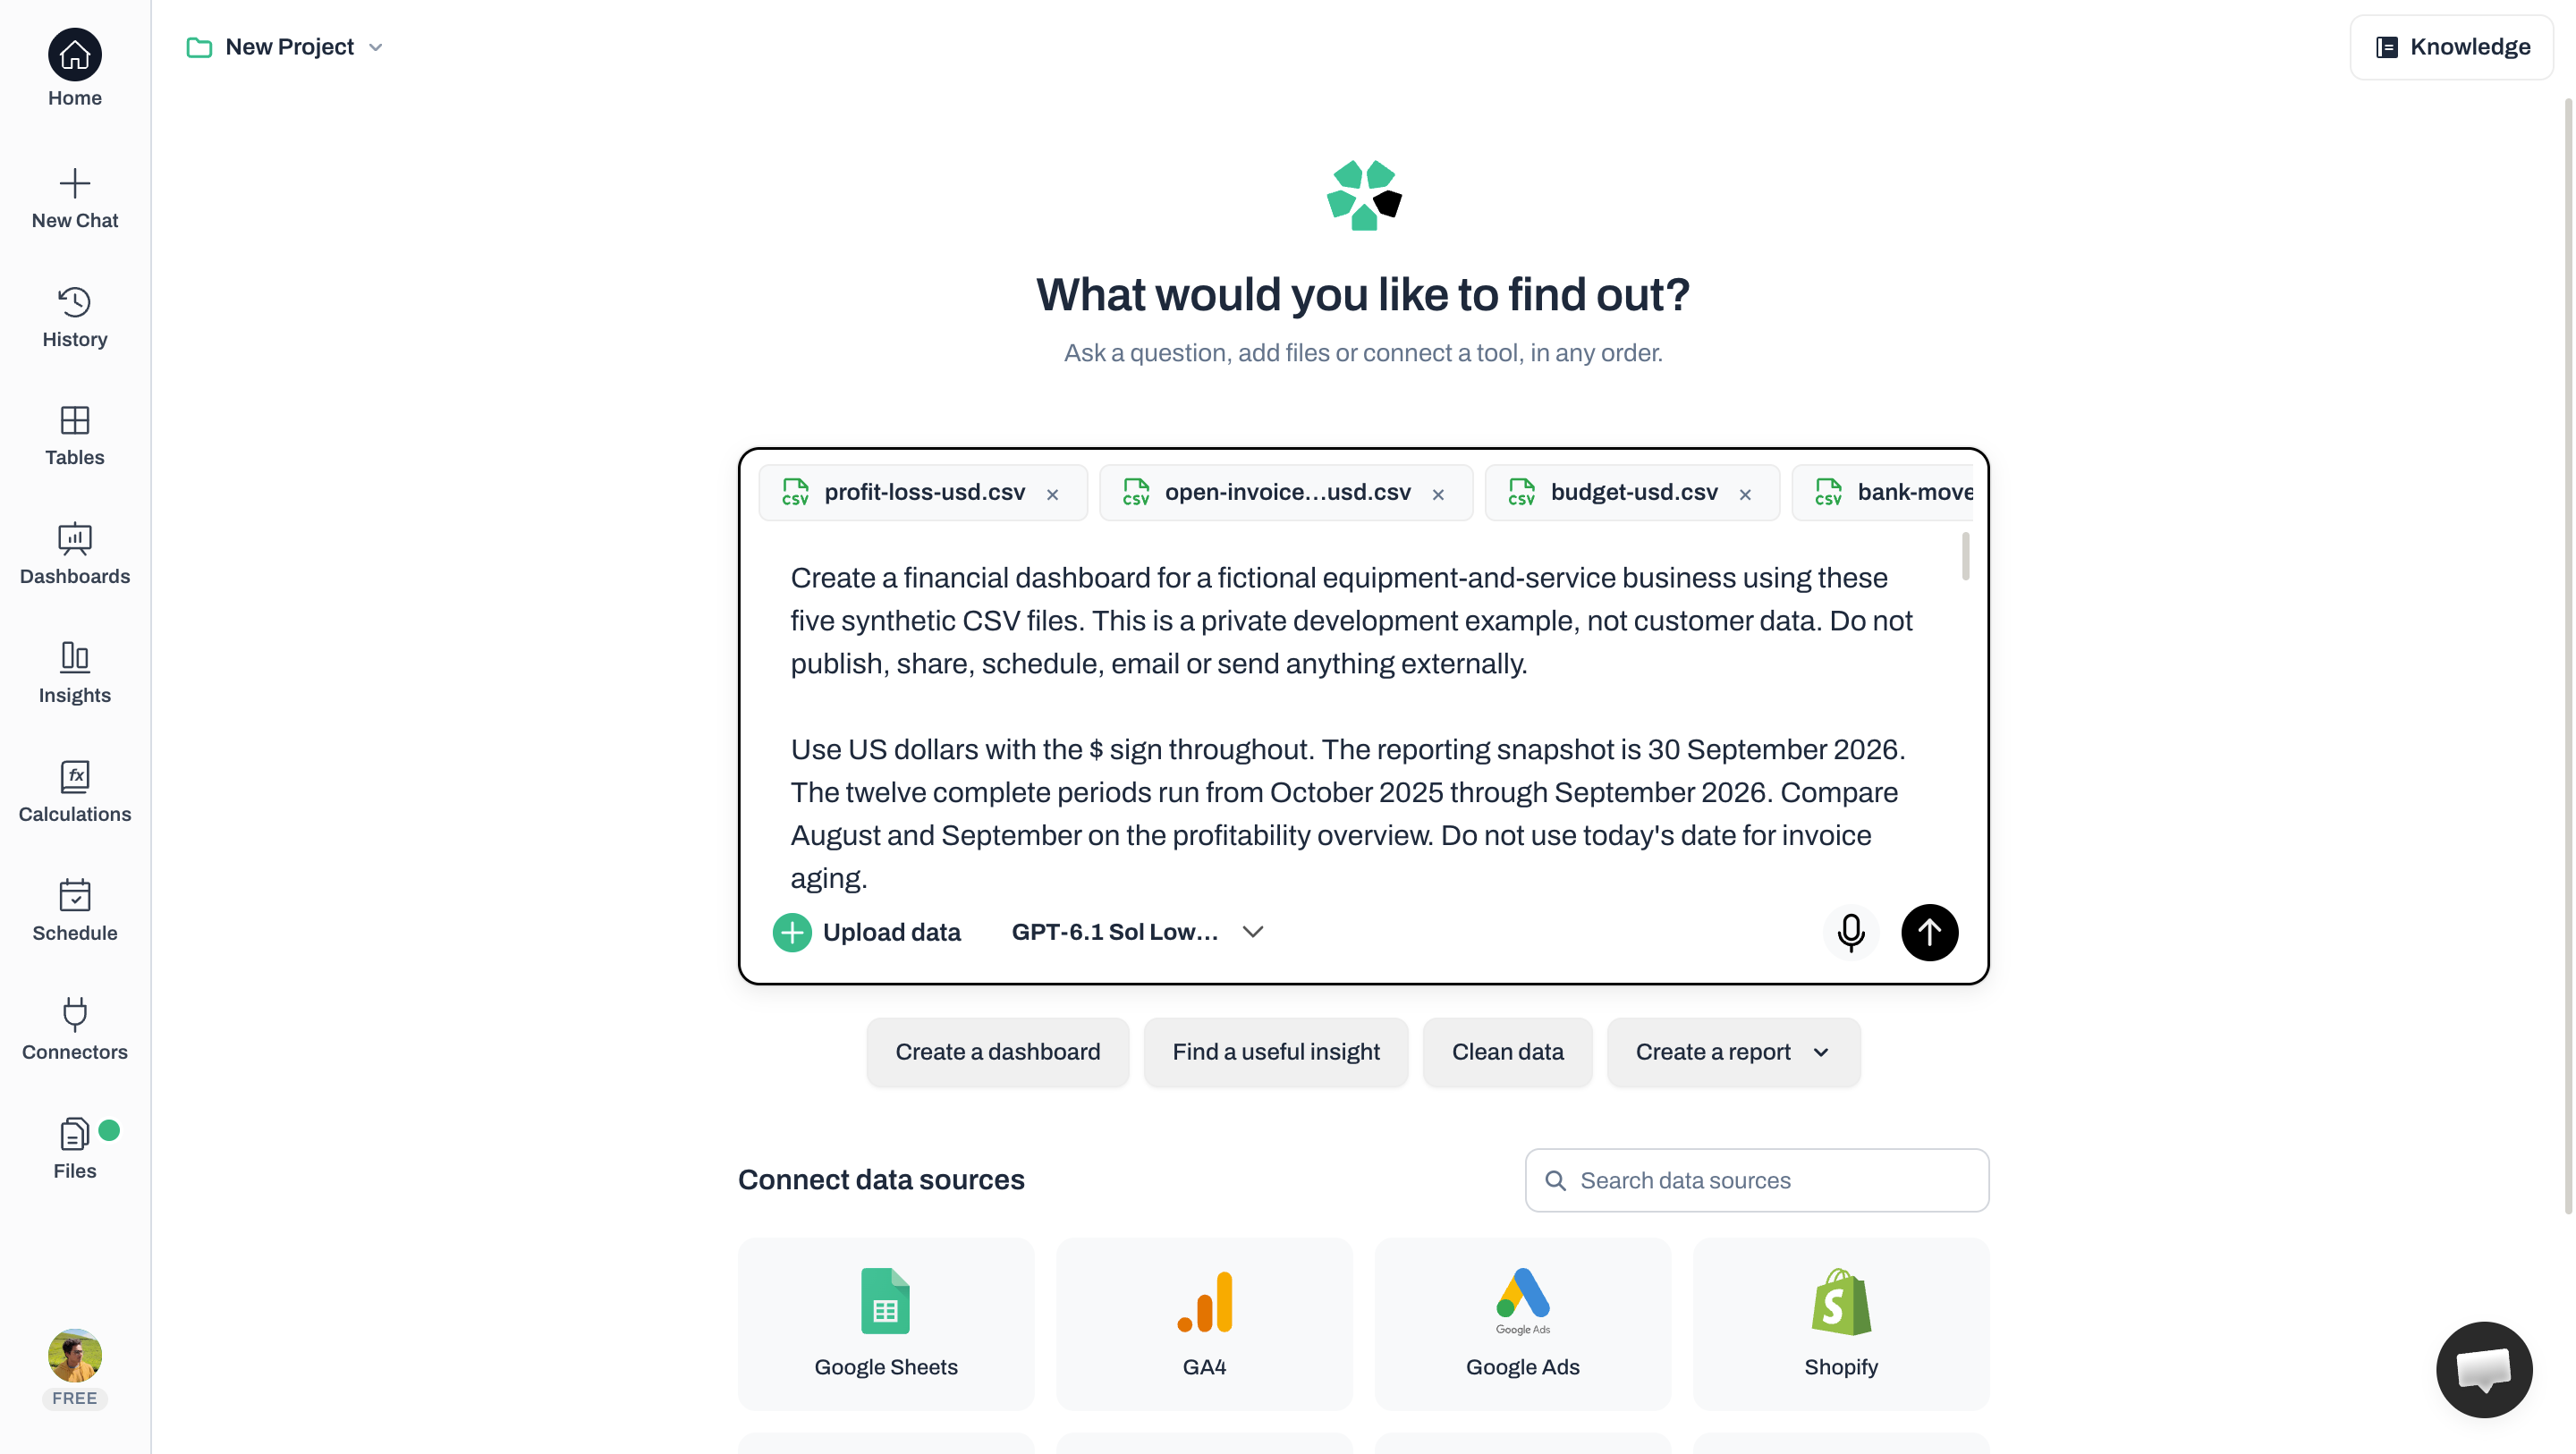
The request names all five files; the attachment row scrolls, so only four are visible here. Each file stays a separate source. First-party Anomaly screenshot; synthetic business-finance data.
Here, revenue and costs are positive; bank receipts are positive and payments negative. Supply the opening balances: bank cash $150,000 and customer amounts owed $36,000 on 1 October 2025.
Specify the date in your request. For this example, you could ask:
Build a monthly finance dashboard in US dollars ($). Compare August and September 2026. Use 30 September for invoice aging. Show revenue, gross margin, operating profit, cash, budget differences and overdue invoices. Inspect the columns and dates first. Add up each file by month before comparing totals, and show the calculations.
2. Inspect a source before trusting its totals
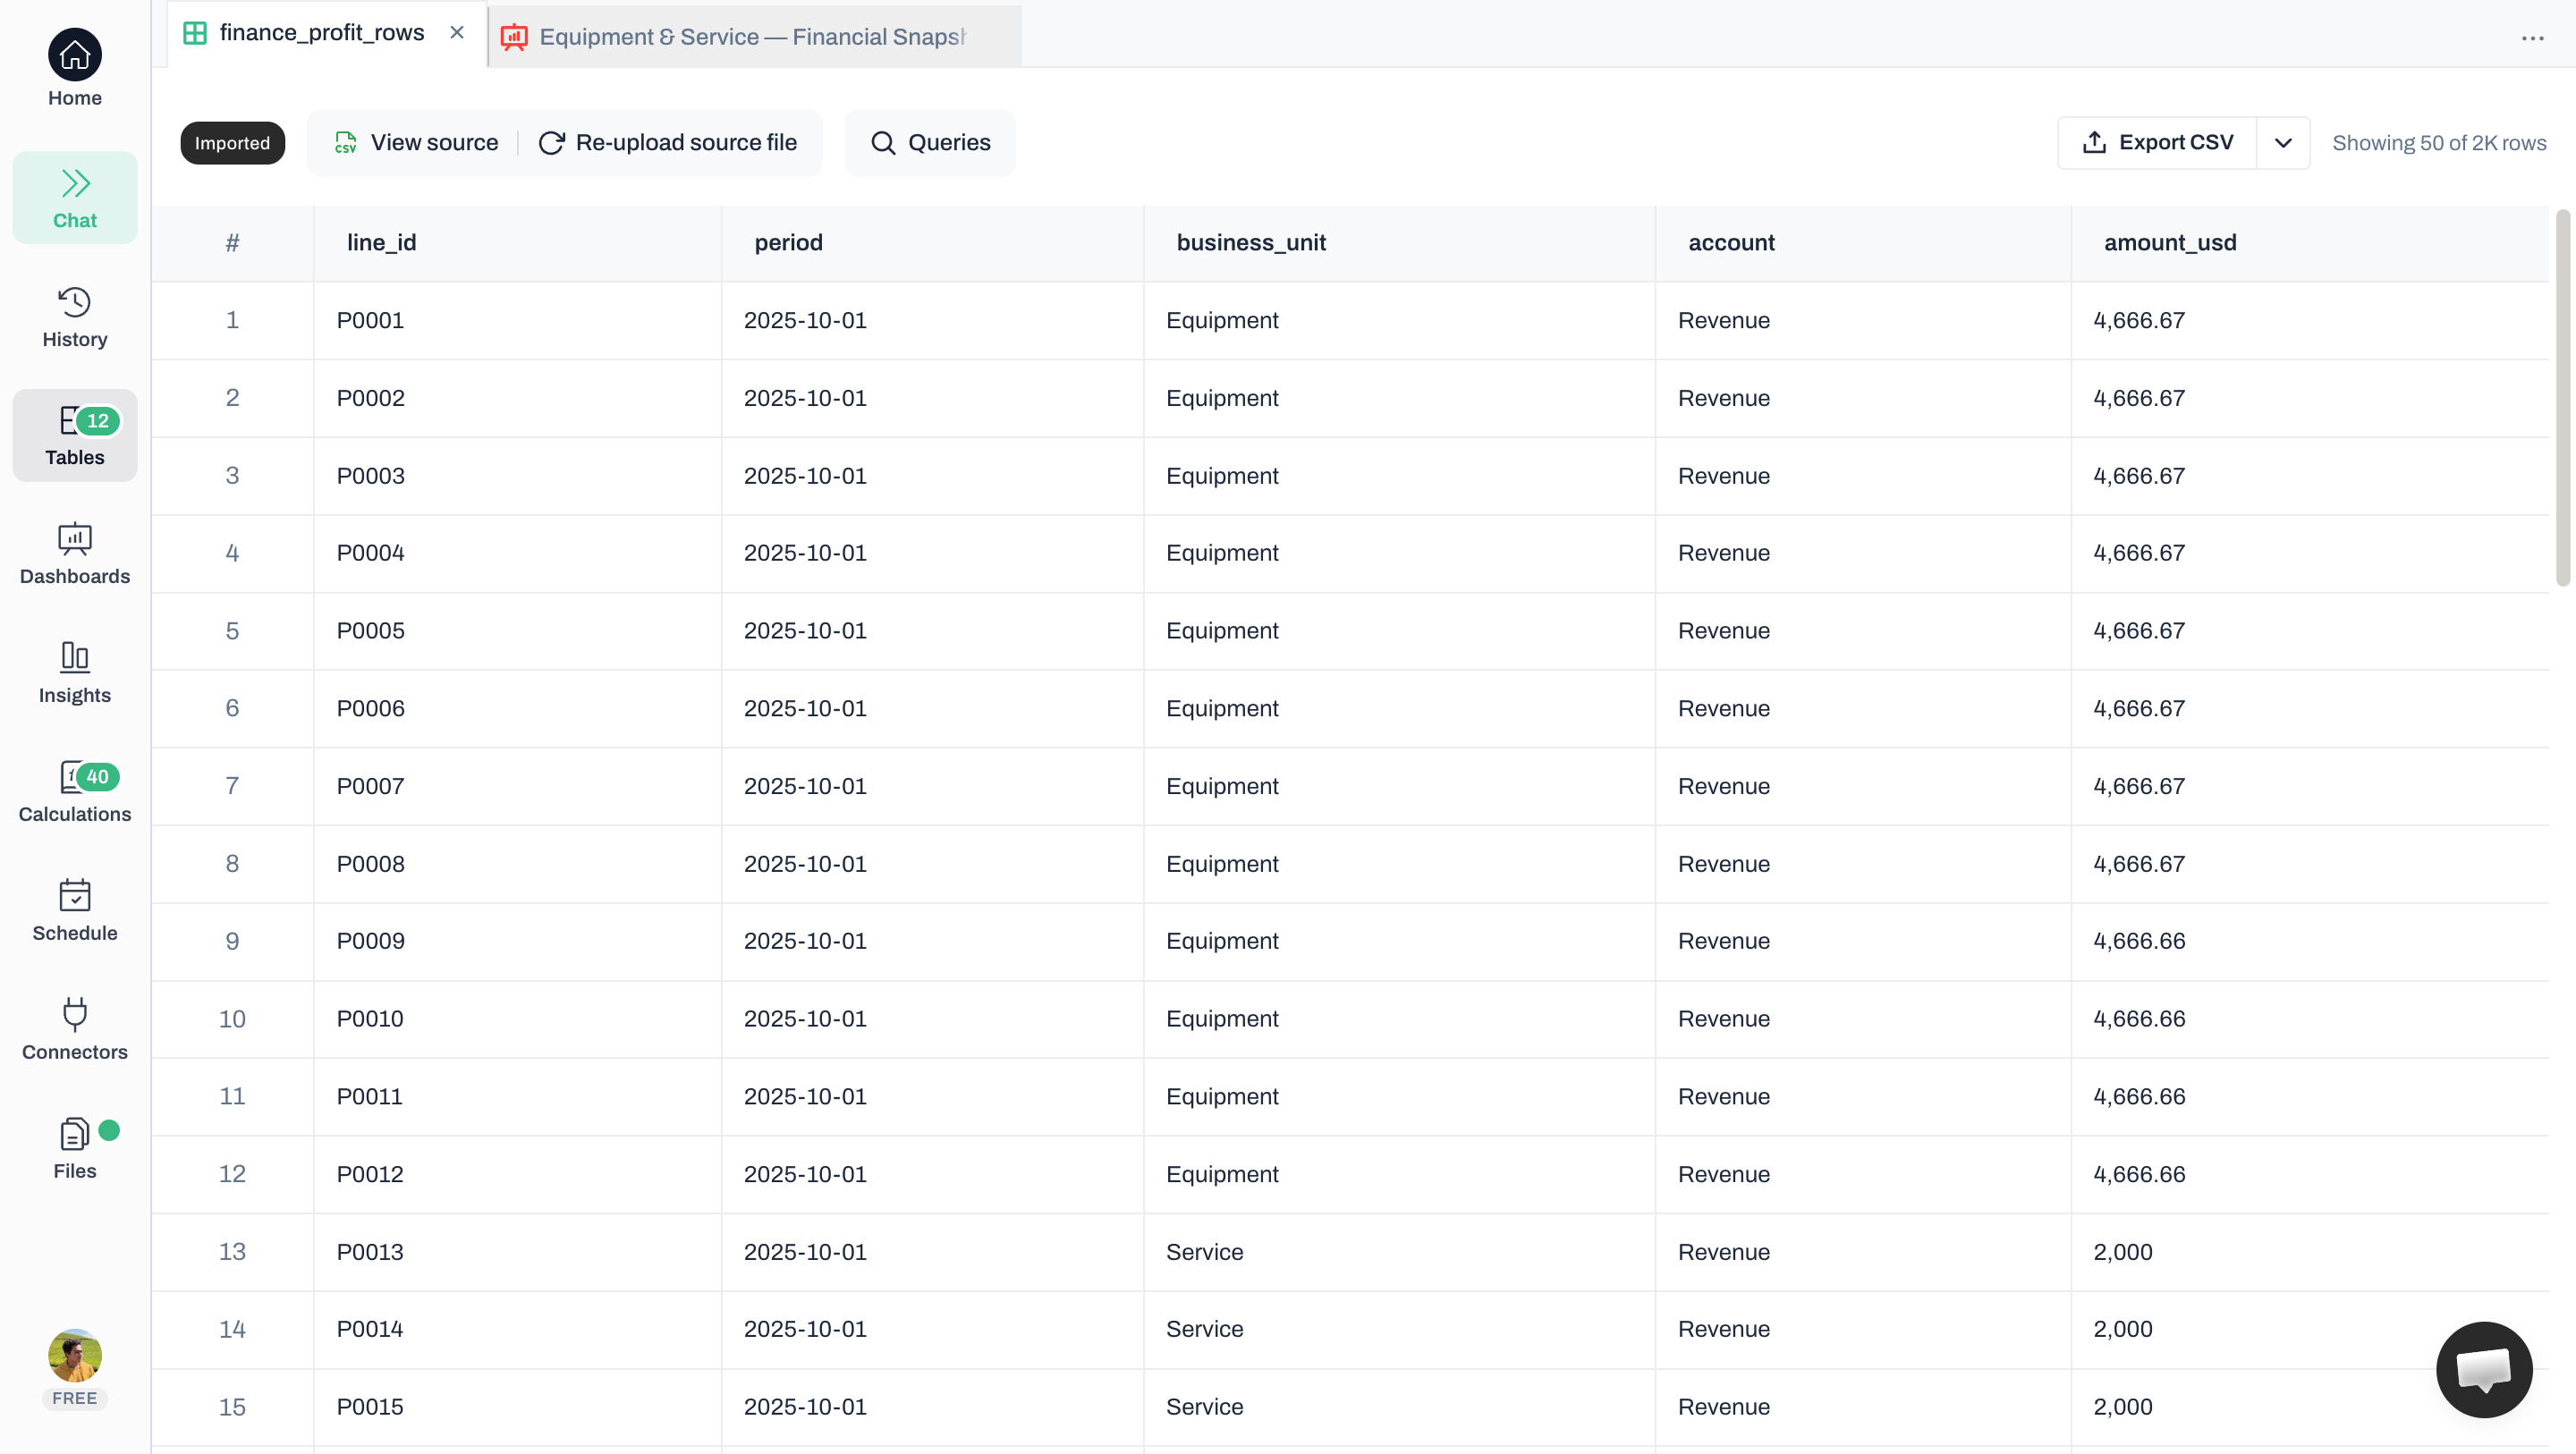
Check the period, account labels and amount convention before interpreting a chart. First-party Anomaly screenshot; synthetic business-finance data.
Inspect the imported rows, then confirm the definitions. In this sample, operating profit deducts overheads and depreciation from gross profit. Depreciation spreads a physical asset's cost over its useful life; it is not a new bank payment. Invoice aging counts days past the due date.
3. Keep the date and metric definitions visible
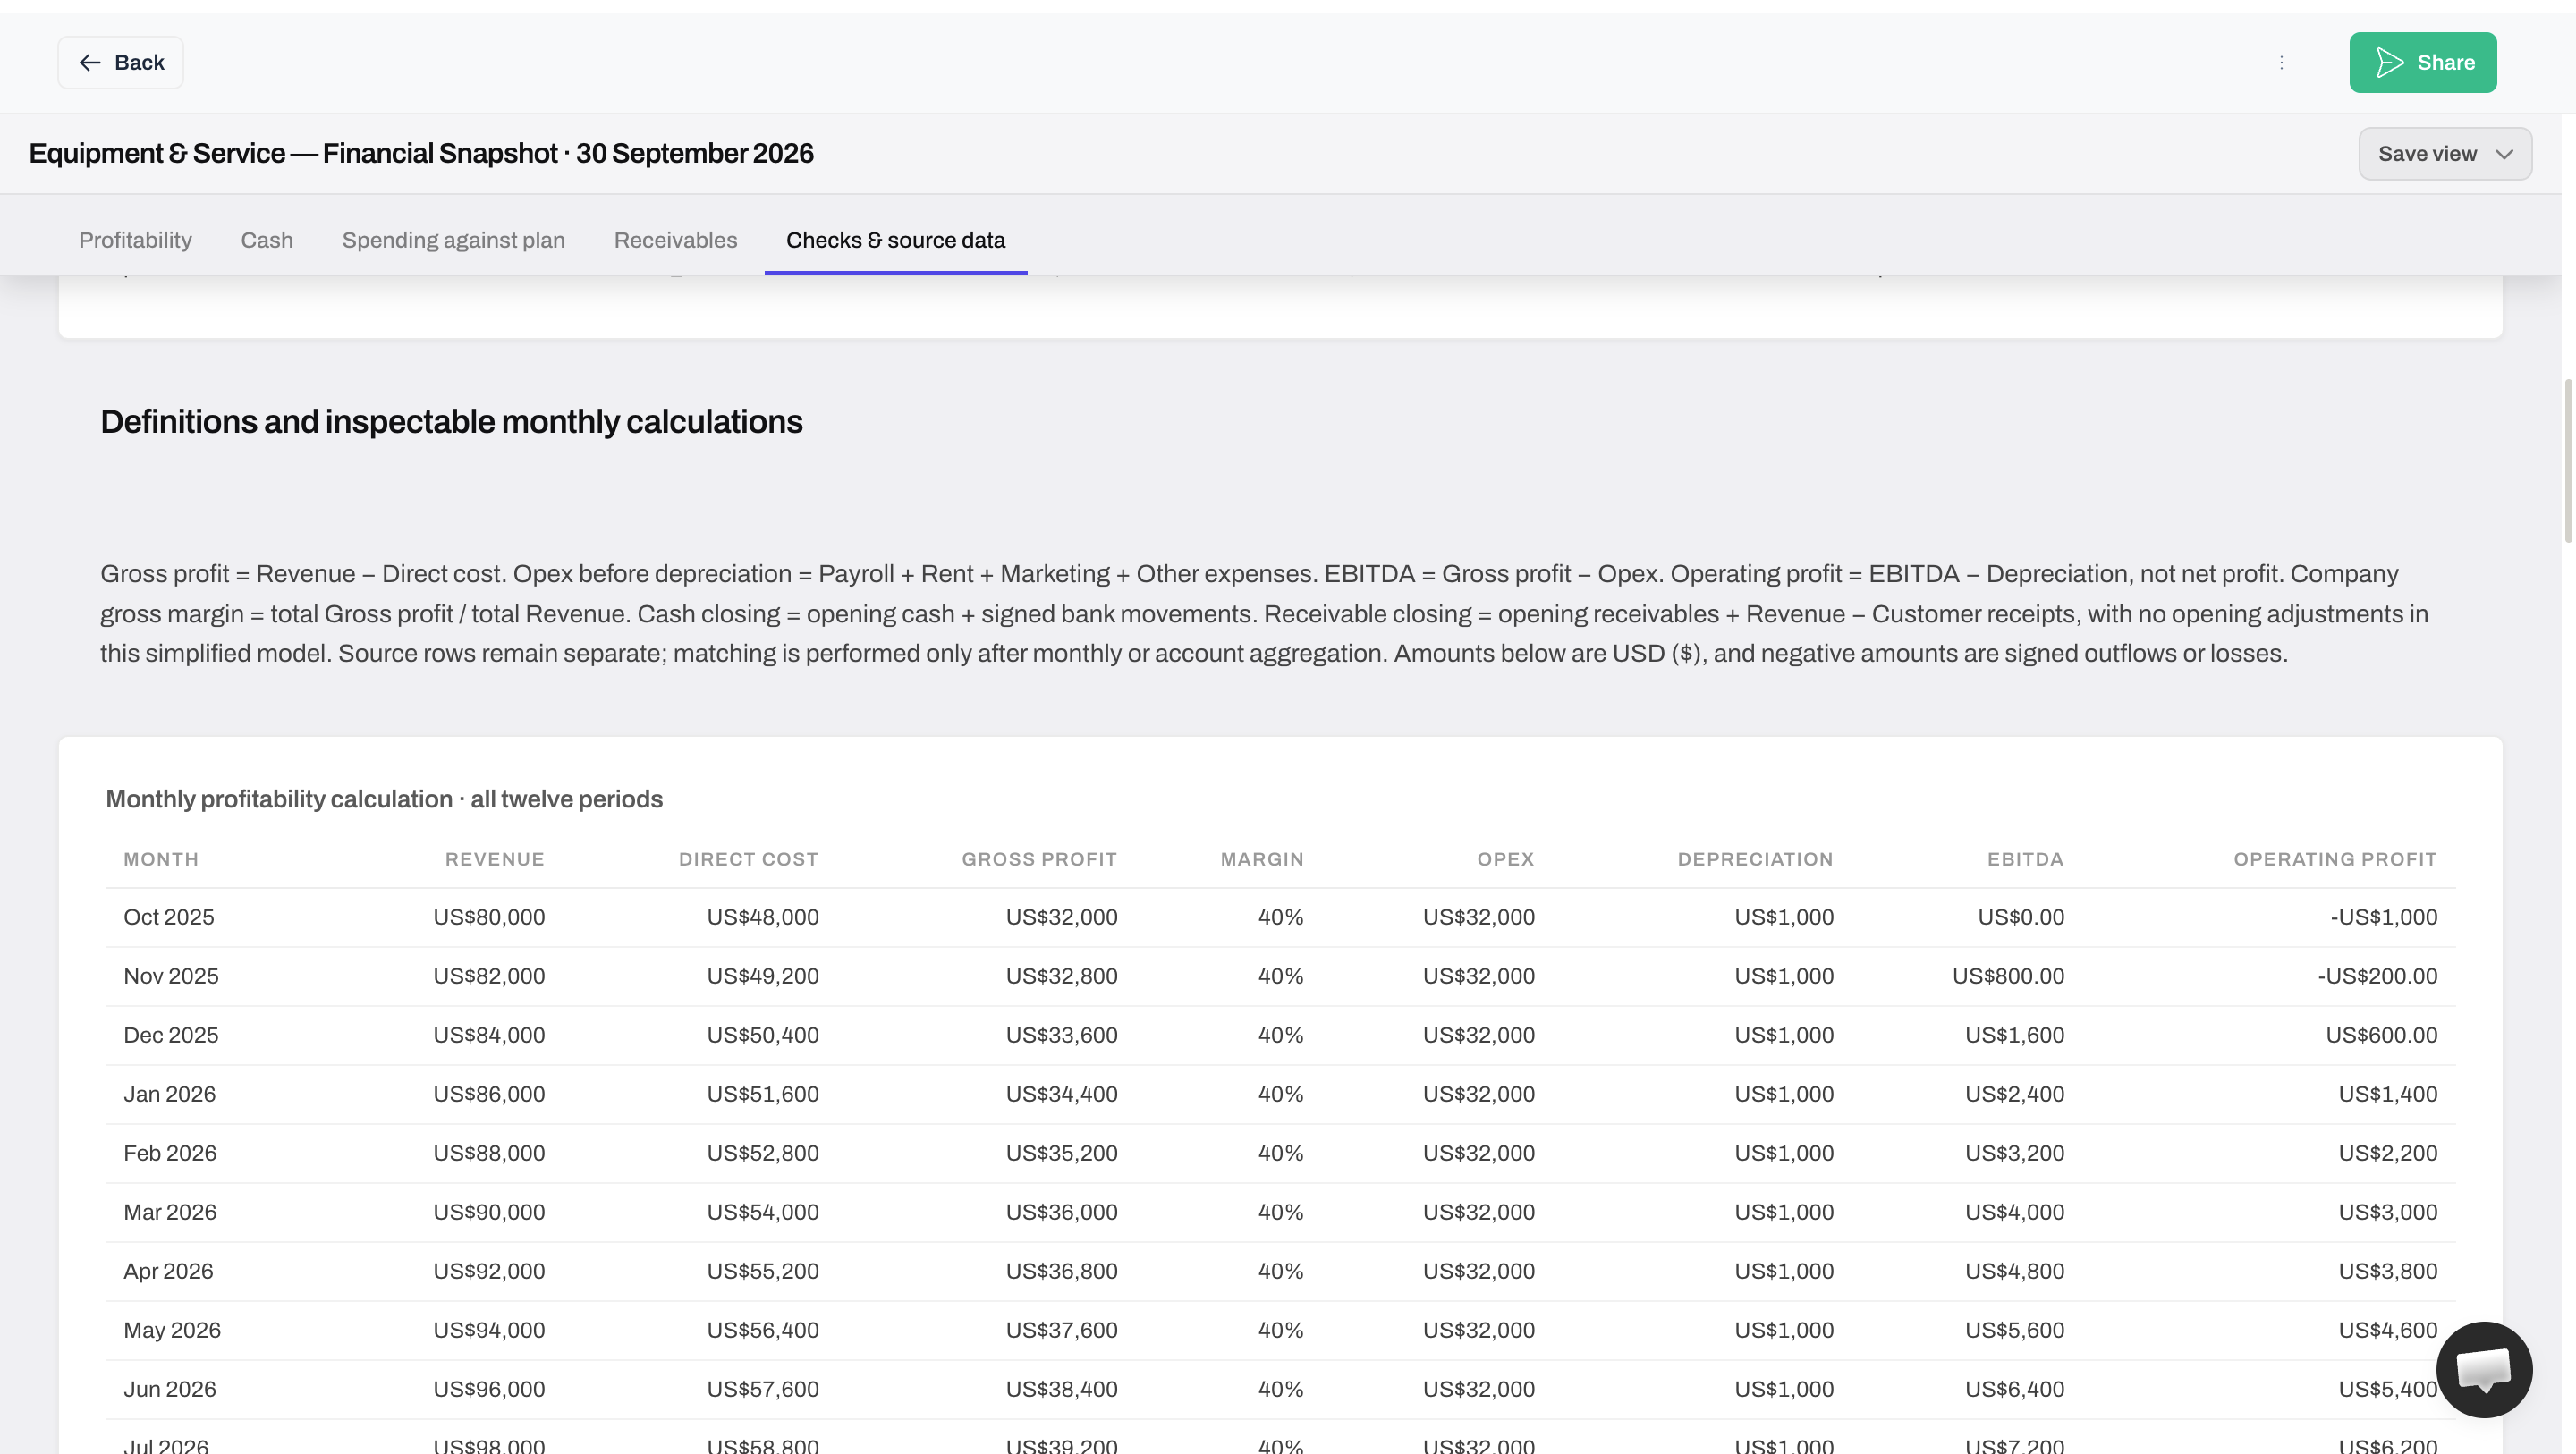
Use the saved working to confirm what a measure includes. A familiar chart title is not a definition. First-party Anomaly screenshot; synthetic business-finance data.
Users have asked us to explain why report totals differ from their source files. Start with those checks, then open Profitability to read the monthly comparison.
02Open Profitability to explain the profit change
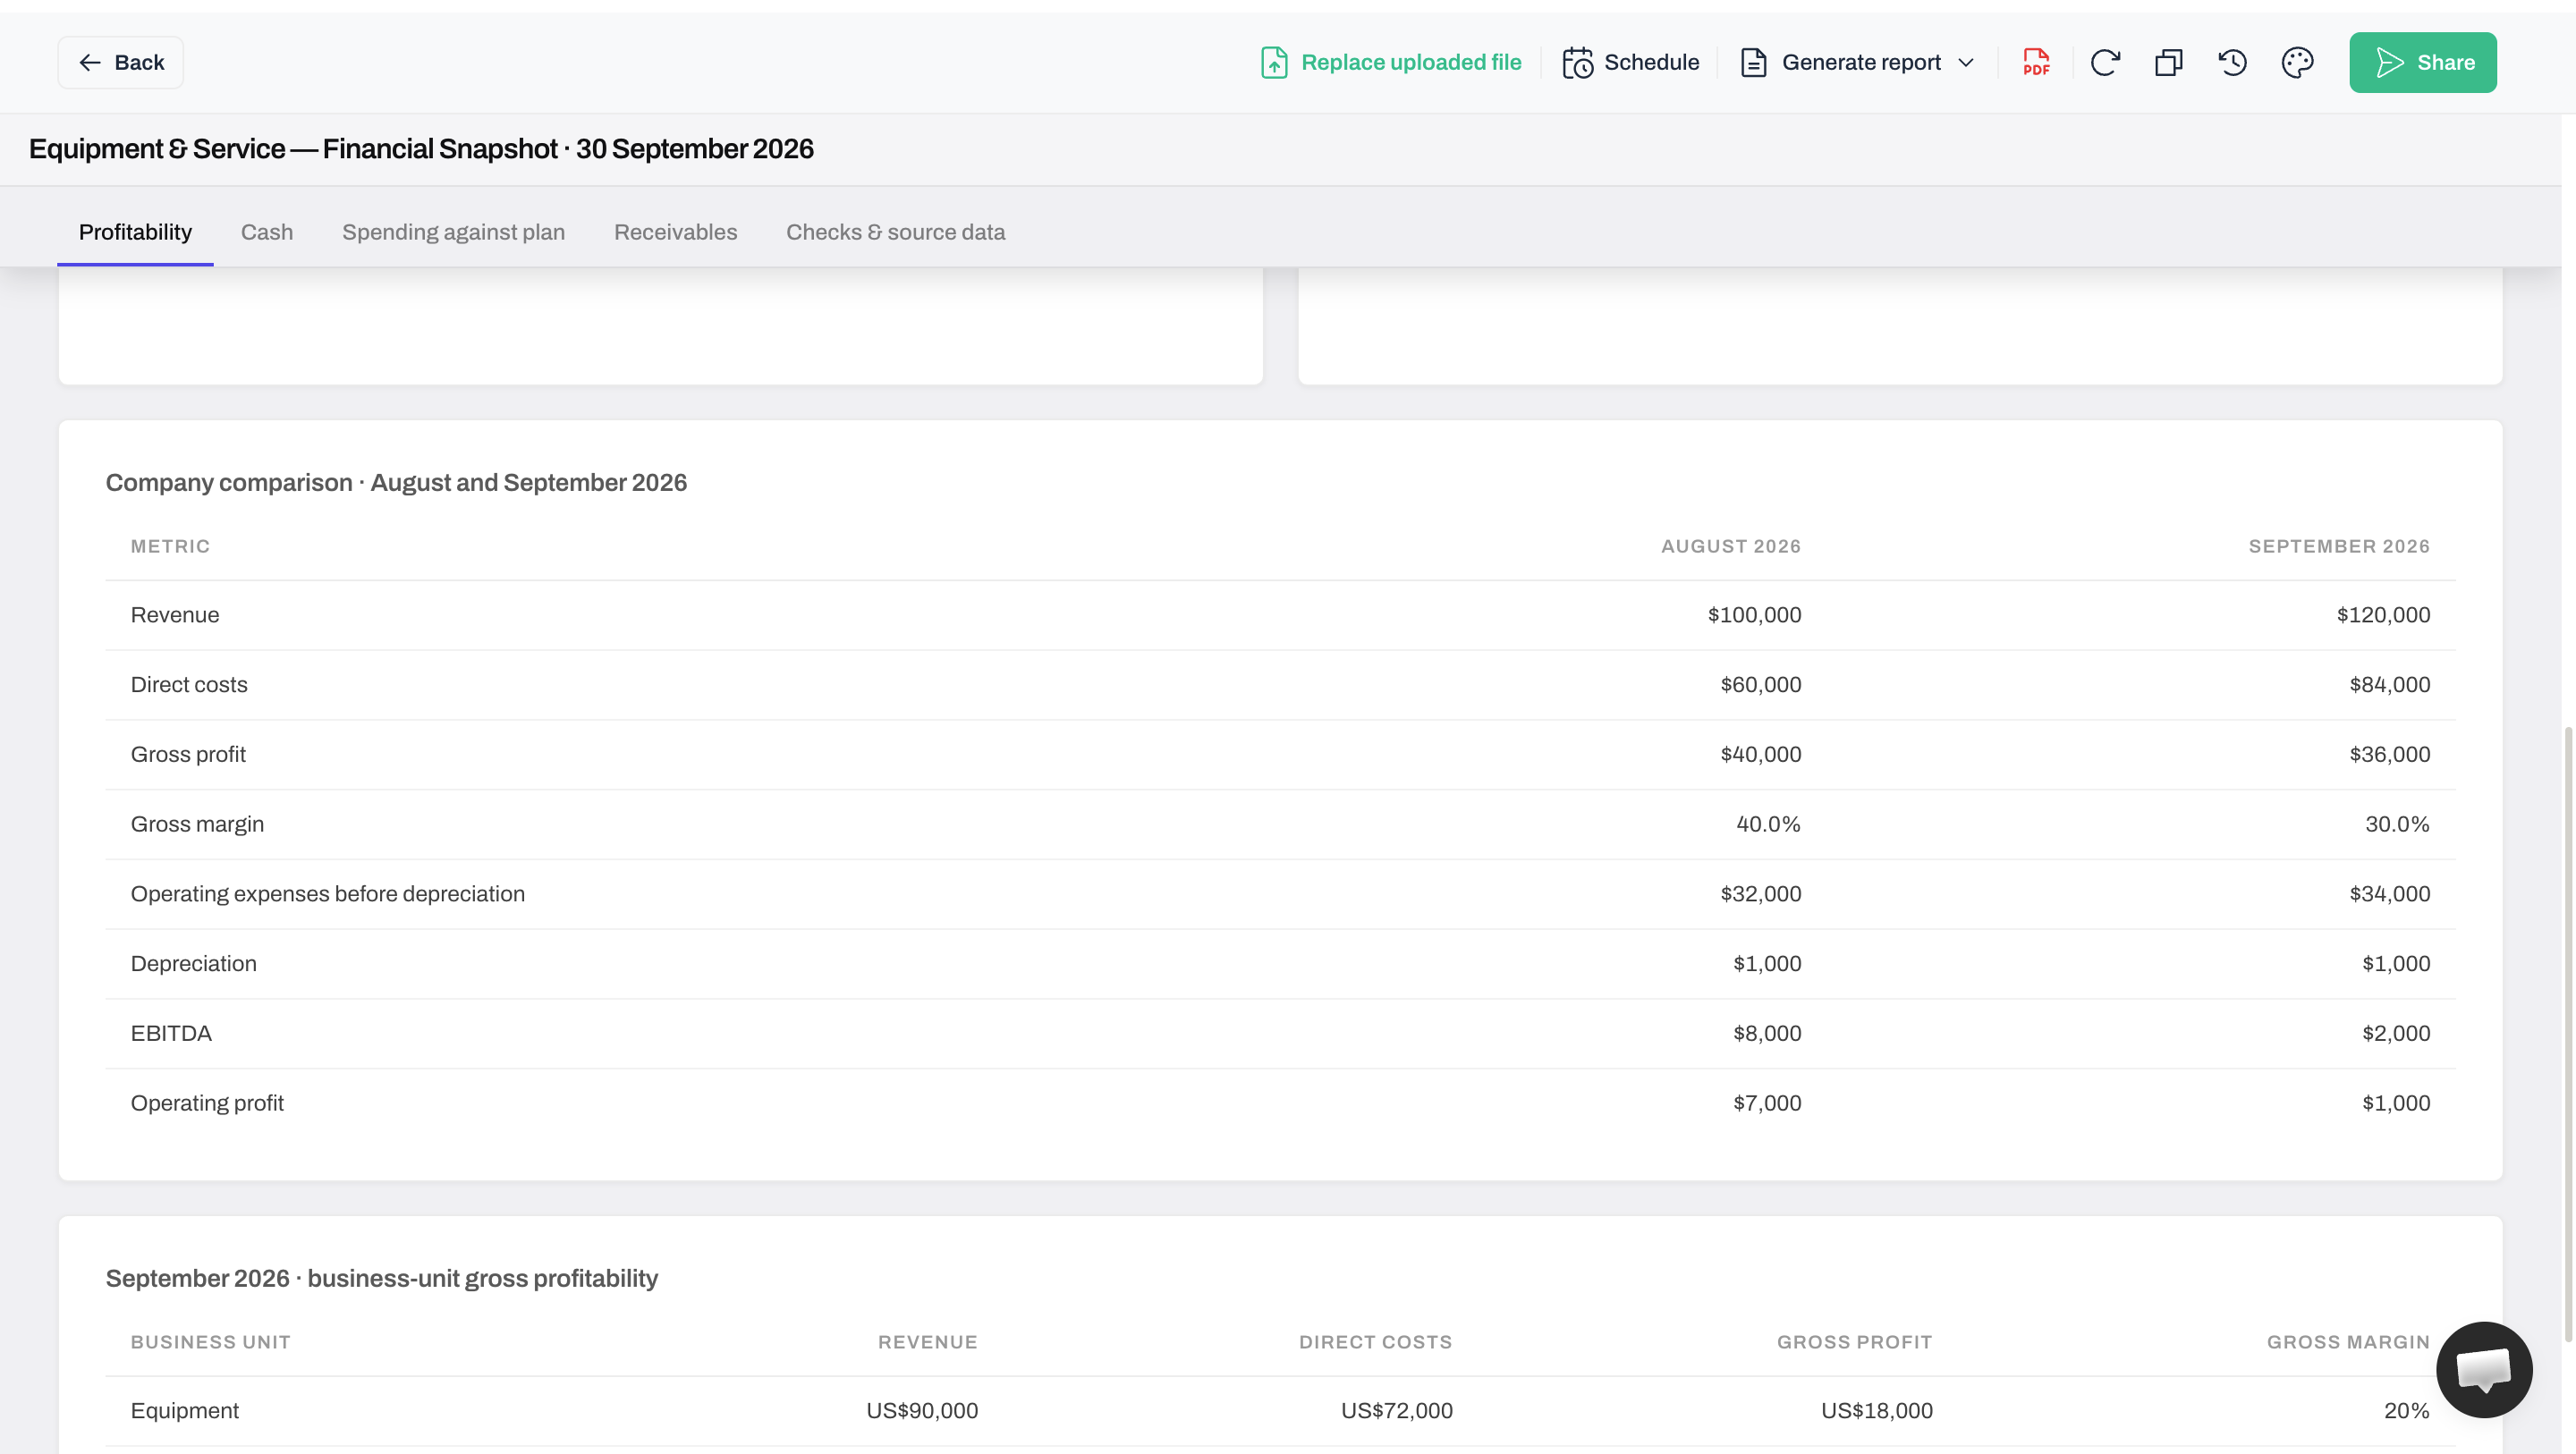
In Profitability, compare August with September. Revenue rose from $100,000 to $120,000, but operating profit fell from $7,000 to $1,000. Read the costs alongside sales to understand the difference.
Gross profit is revenue minus direct costs: September's $120,000 - $84,000 = $36,000. Direct costs rose from $60,000 to $84,000, reducing gross profit from $40,000 to $36,000 and gross margin from 40% to 30%. That is a fall of 10 percentage points; relative to the old 40% margin, it is a 25% decline.
From gross profit to EBITDA and operating profit
Depreciation spreads the cost of physical assets, such as equipment, over their useful lives. Amortization does the same for intangible assets with a limited useful life, such as a purchased patent. Both reduce profit, but recording them is not a new cash payment.
In this sample, $36,000 gross profit minus $34,000 overheads gives $2,000 EBITDA, before either charge. There is no amortization expense here. Subtract the $1,000 depreciation charge to reach $1,000 operating profit. Interest and tax are not modeled, so this is not a complete net-profit calculation.
August's $40,000 gross profit minus $32,000 overheads gave $8,000 EBITDA; after $1,000 depreciation, operating profit was $7,000. EBITDA is not cash available: unpaid sales and equipment purchases still affect the bank balance.
Why averaging margins gives the wrong answer
September Equipment sales are $90,000 with $18,000 gross profit: a 20% margin. Service sales are $30,000 with $18,000 gross profit: a 60% margin. Averaging 20% and 60% gives 40%, but the larger Equipment business carries more weight. The company margin is ($18,000 + $18,000) / ($90,000 + $30,000) = 30%. Recalculate from the combined amounts whenever you combine units.
Keep that cost investigation open. Next, select Cash to see whether the falling bank balance follows the same pattern.
03Open Cash to follow the bank movements
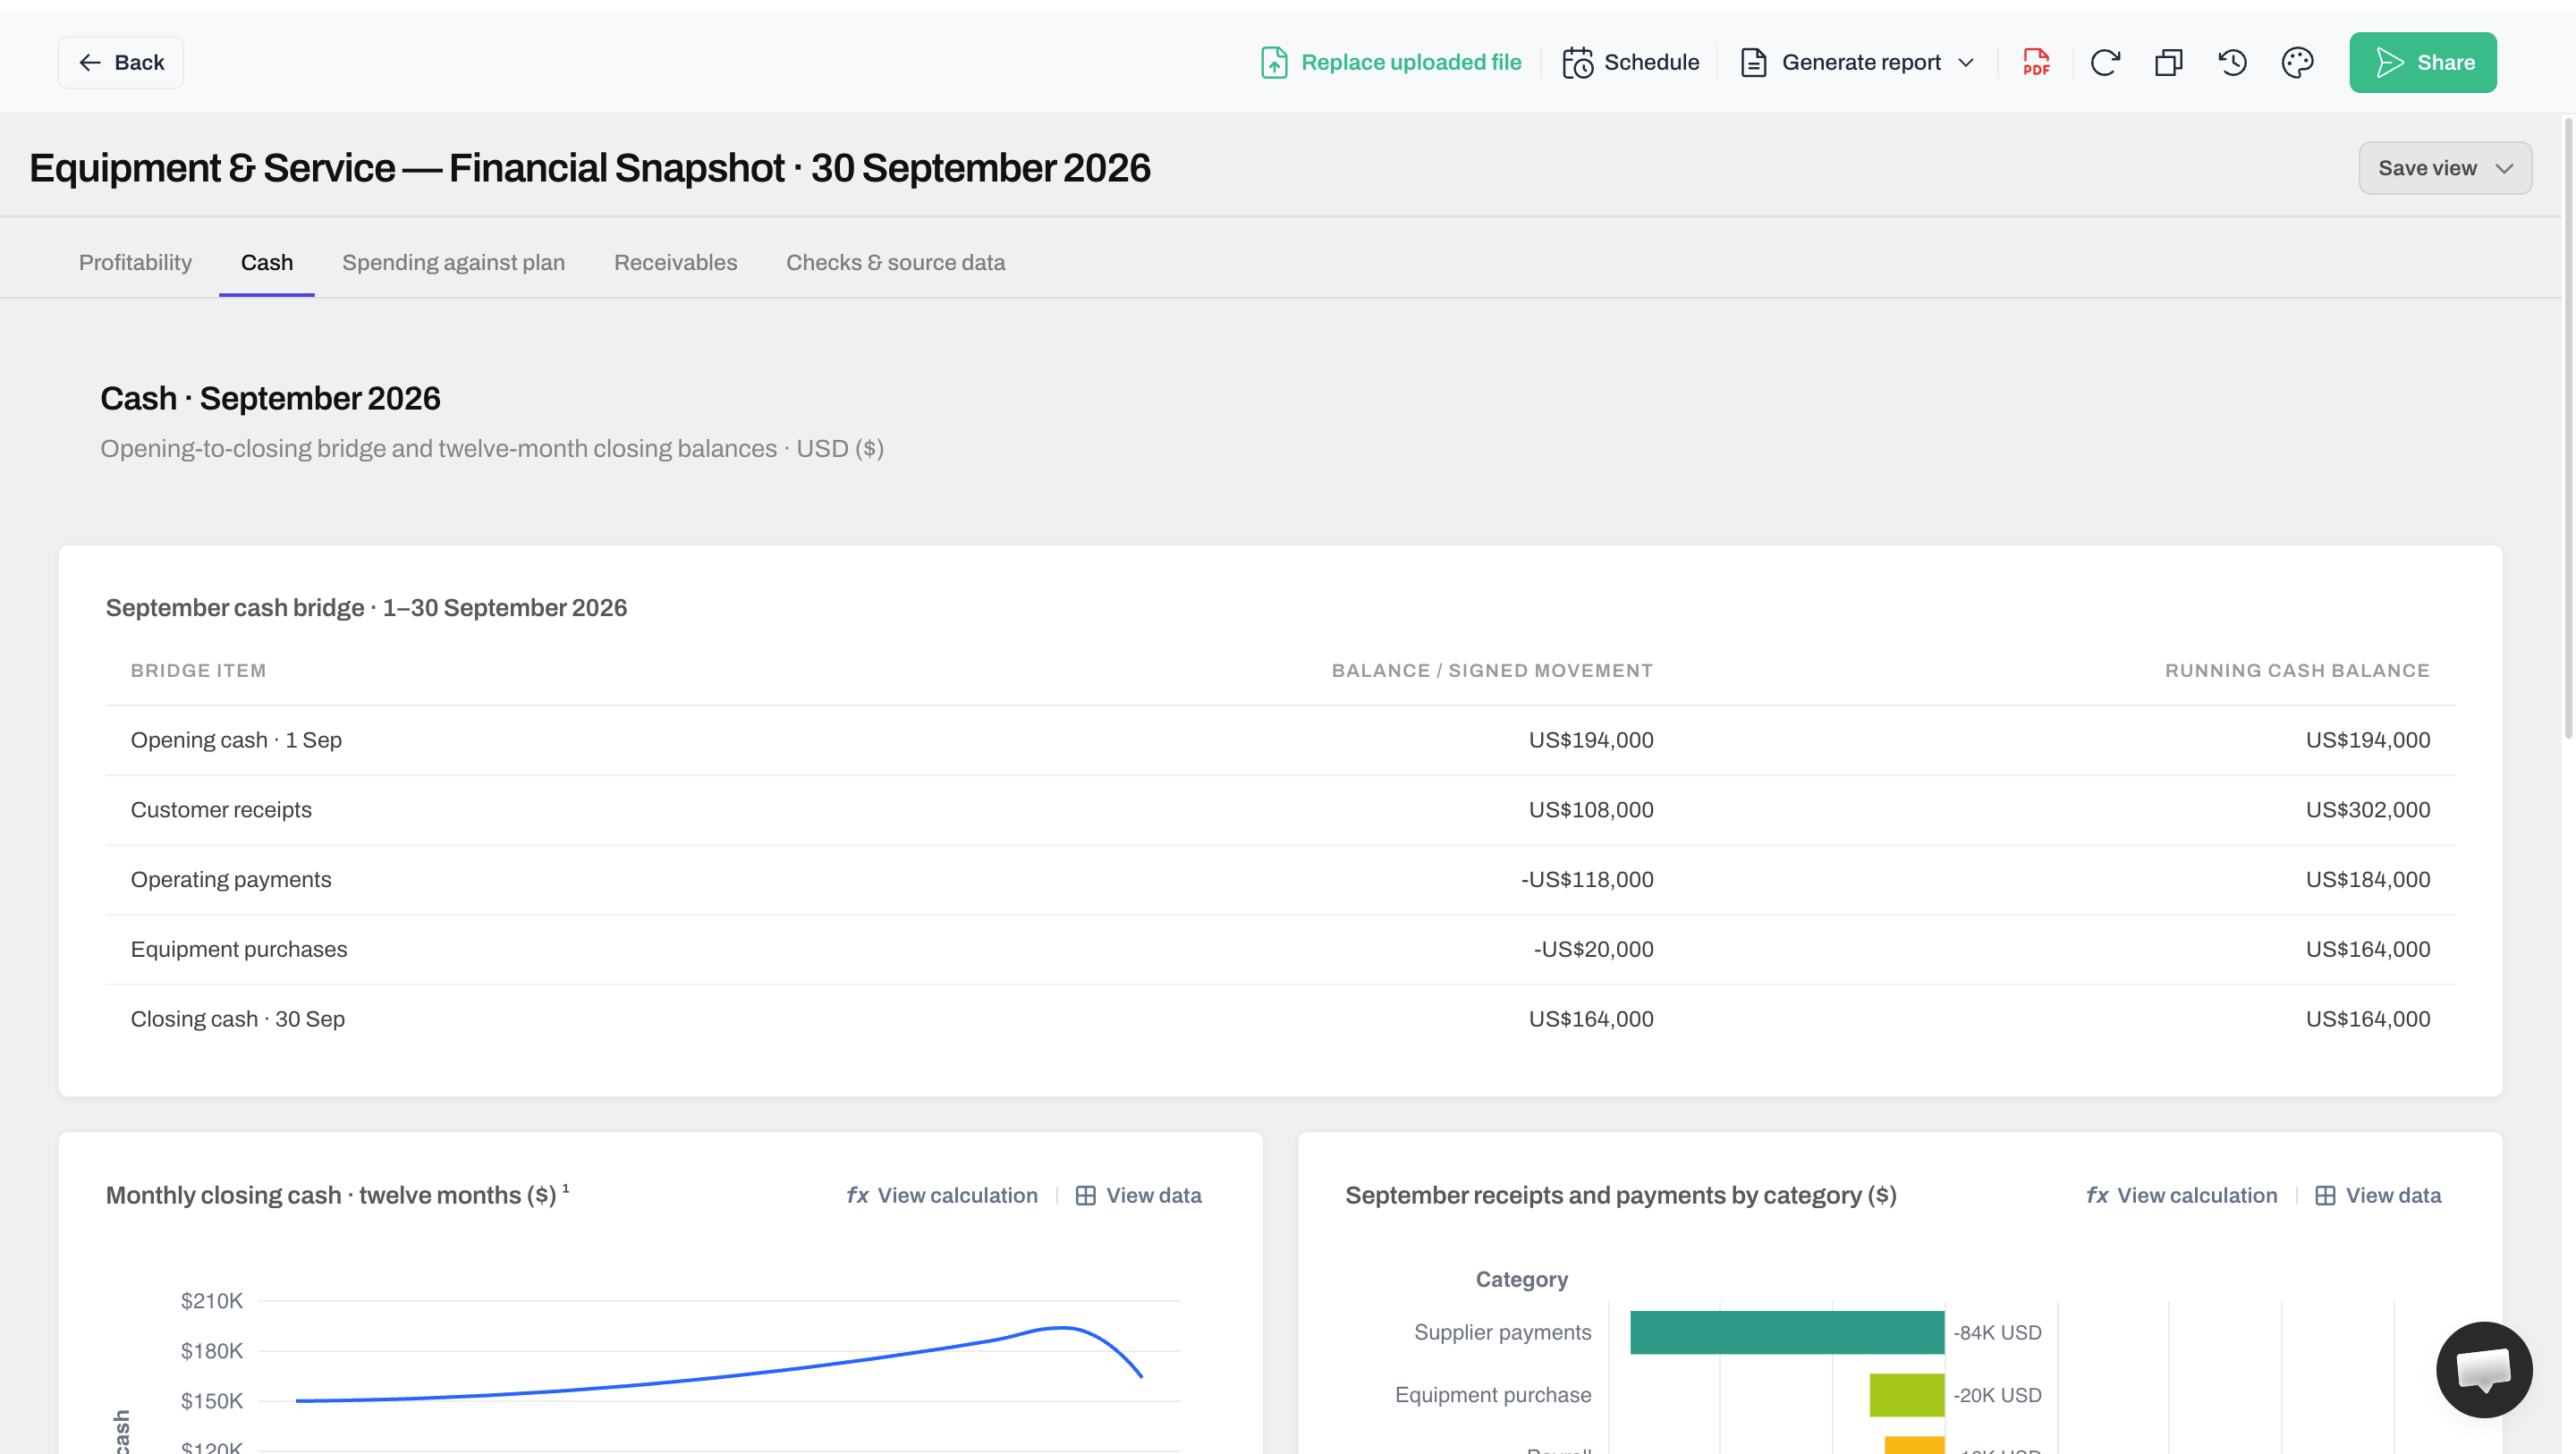
The Cash tab shows bank cash falling $30,000 despite the $1,000 operating profit. Selling on credit creates revenue before payment arrives. The SEC's financial-statements guide explains why profit and cash differ.
Account for the movement in bank cash
Opening cash plus receipts minus payments explains the closing balance. First-party Anomaly screenshot; synthetic business-finance data.
The bank calculation is $194,000 + $108,000 - $138,000 = $164,000. Of the payments, $118,000 covers operating costs and $20,000 buys equipment.
Connect operating profit to cash without counting equipment twice
Customer receipts are $12,000 below September revenue. This increases receivables, the money customers still owe, by $12,000 in this simplified business. Depreciation is a non-cash expense, so add its $1,000 back when moving from operating profit to cash. Then subtract the equipment payment: $1,000 + $1,000 - $12,000 - $20,000 = -$30,000.
The depreciation relates to existing assets; depreciation on the new equipment starts after this sample. The equipment payment and depreciation are not two payments for the same purchase.
The bank rows reproduce closing cash; they do not independently confirm a bank statement's closing balance. For the construction method, see our cash-flow report from bank transactions guide. Next, investigate spending and collections separately: an equipment purchase and an unpaid invoice need different follow-ups.
04Inspect spending and overdue invoices
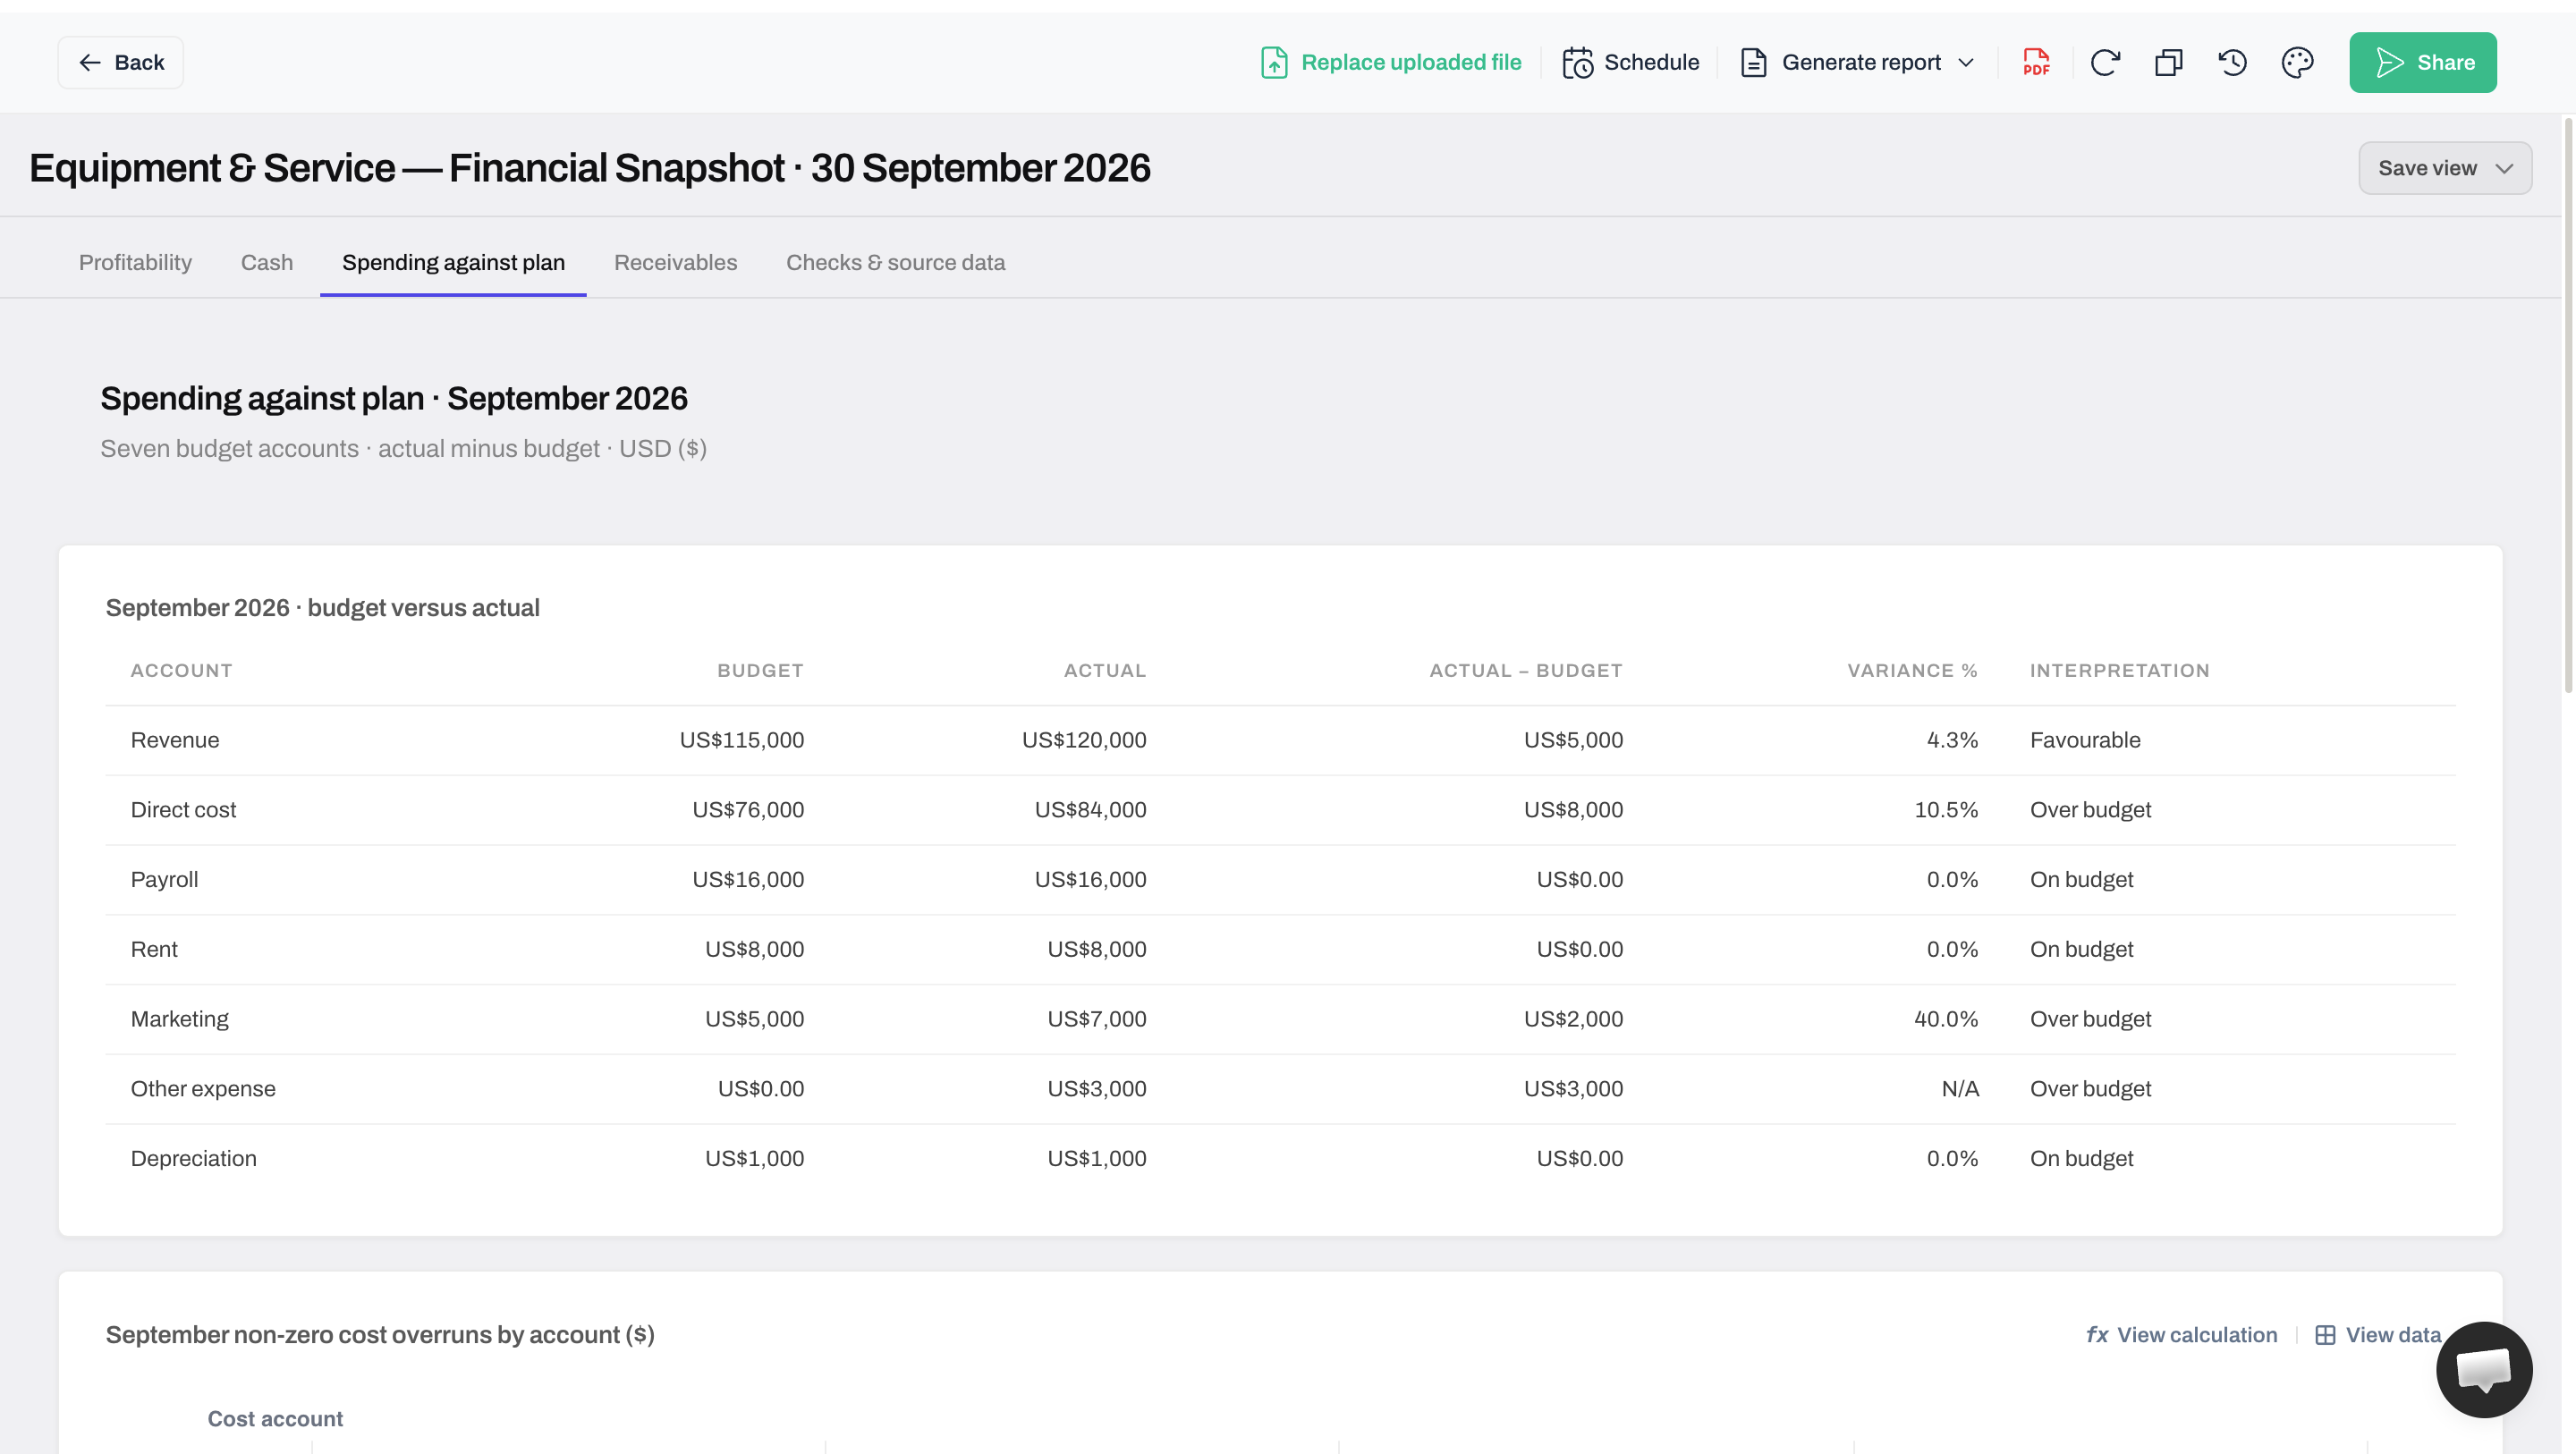
Open Spending against plan. Direct costs are $84,000 against a $76,000 budget: $8,000 over plan. Marketing is $2,000 over its $5,000 budget, or 40%. The bigger percentage is not the bigger dollar difference.
Read the amount and the basis of each variance
Actual minus budget uses the same sign convention throughout. Revenue and costs need different interpretations. First-party Anomaly screenshot; synthetic business-finance data.
A positive revenue difference is favorable; a positive cost difference is over budget under this convention. Other expenses are $3,000 against a zero budget, so their percentage variance is N/A. Keep the $3,000 visible instead of dividing by zero.
Compare costs at the same order volume
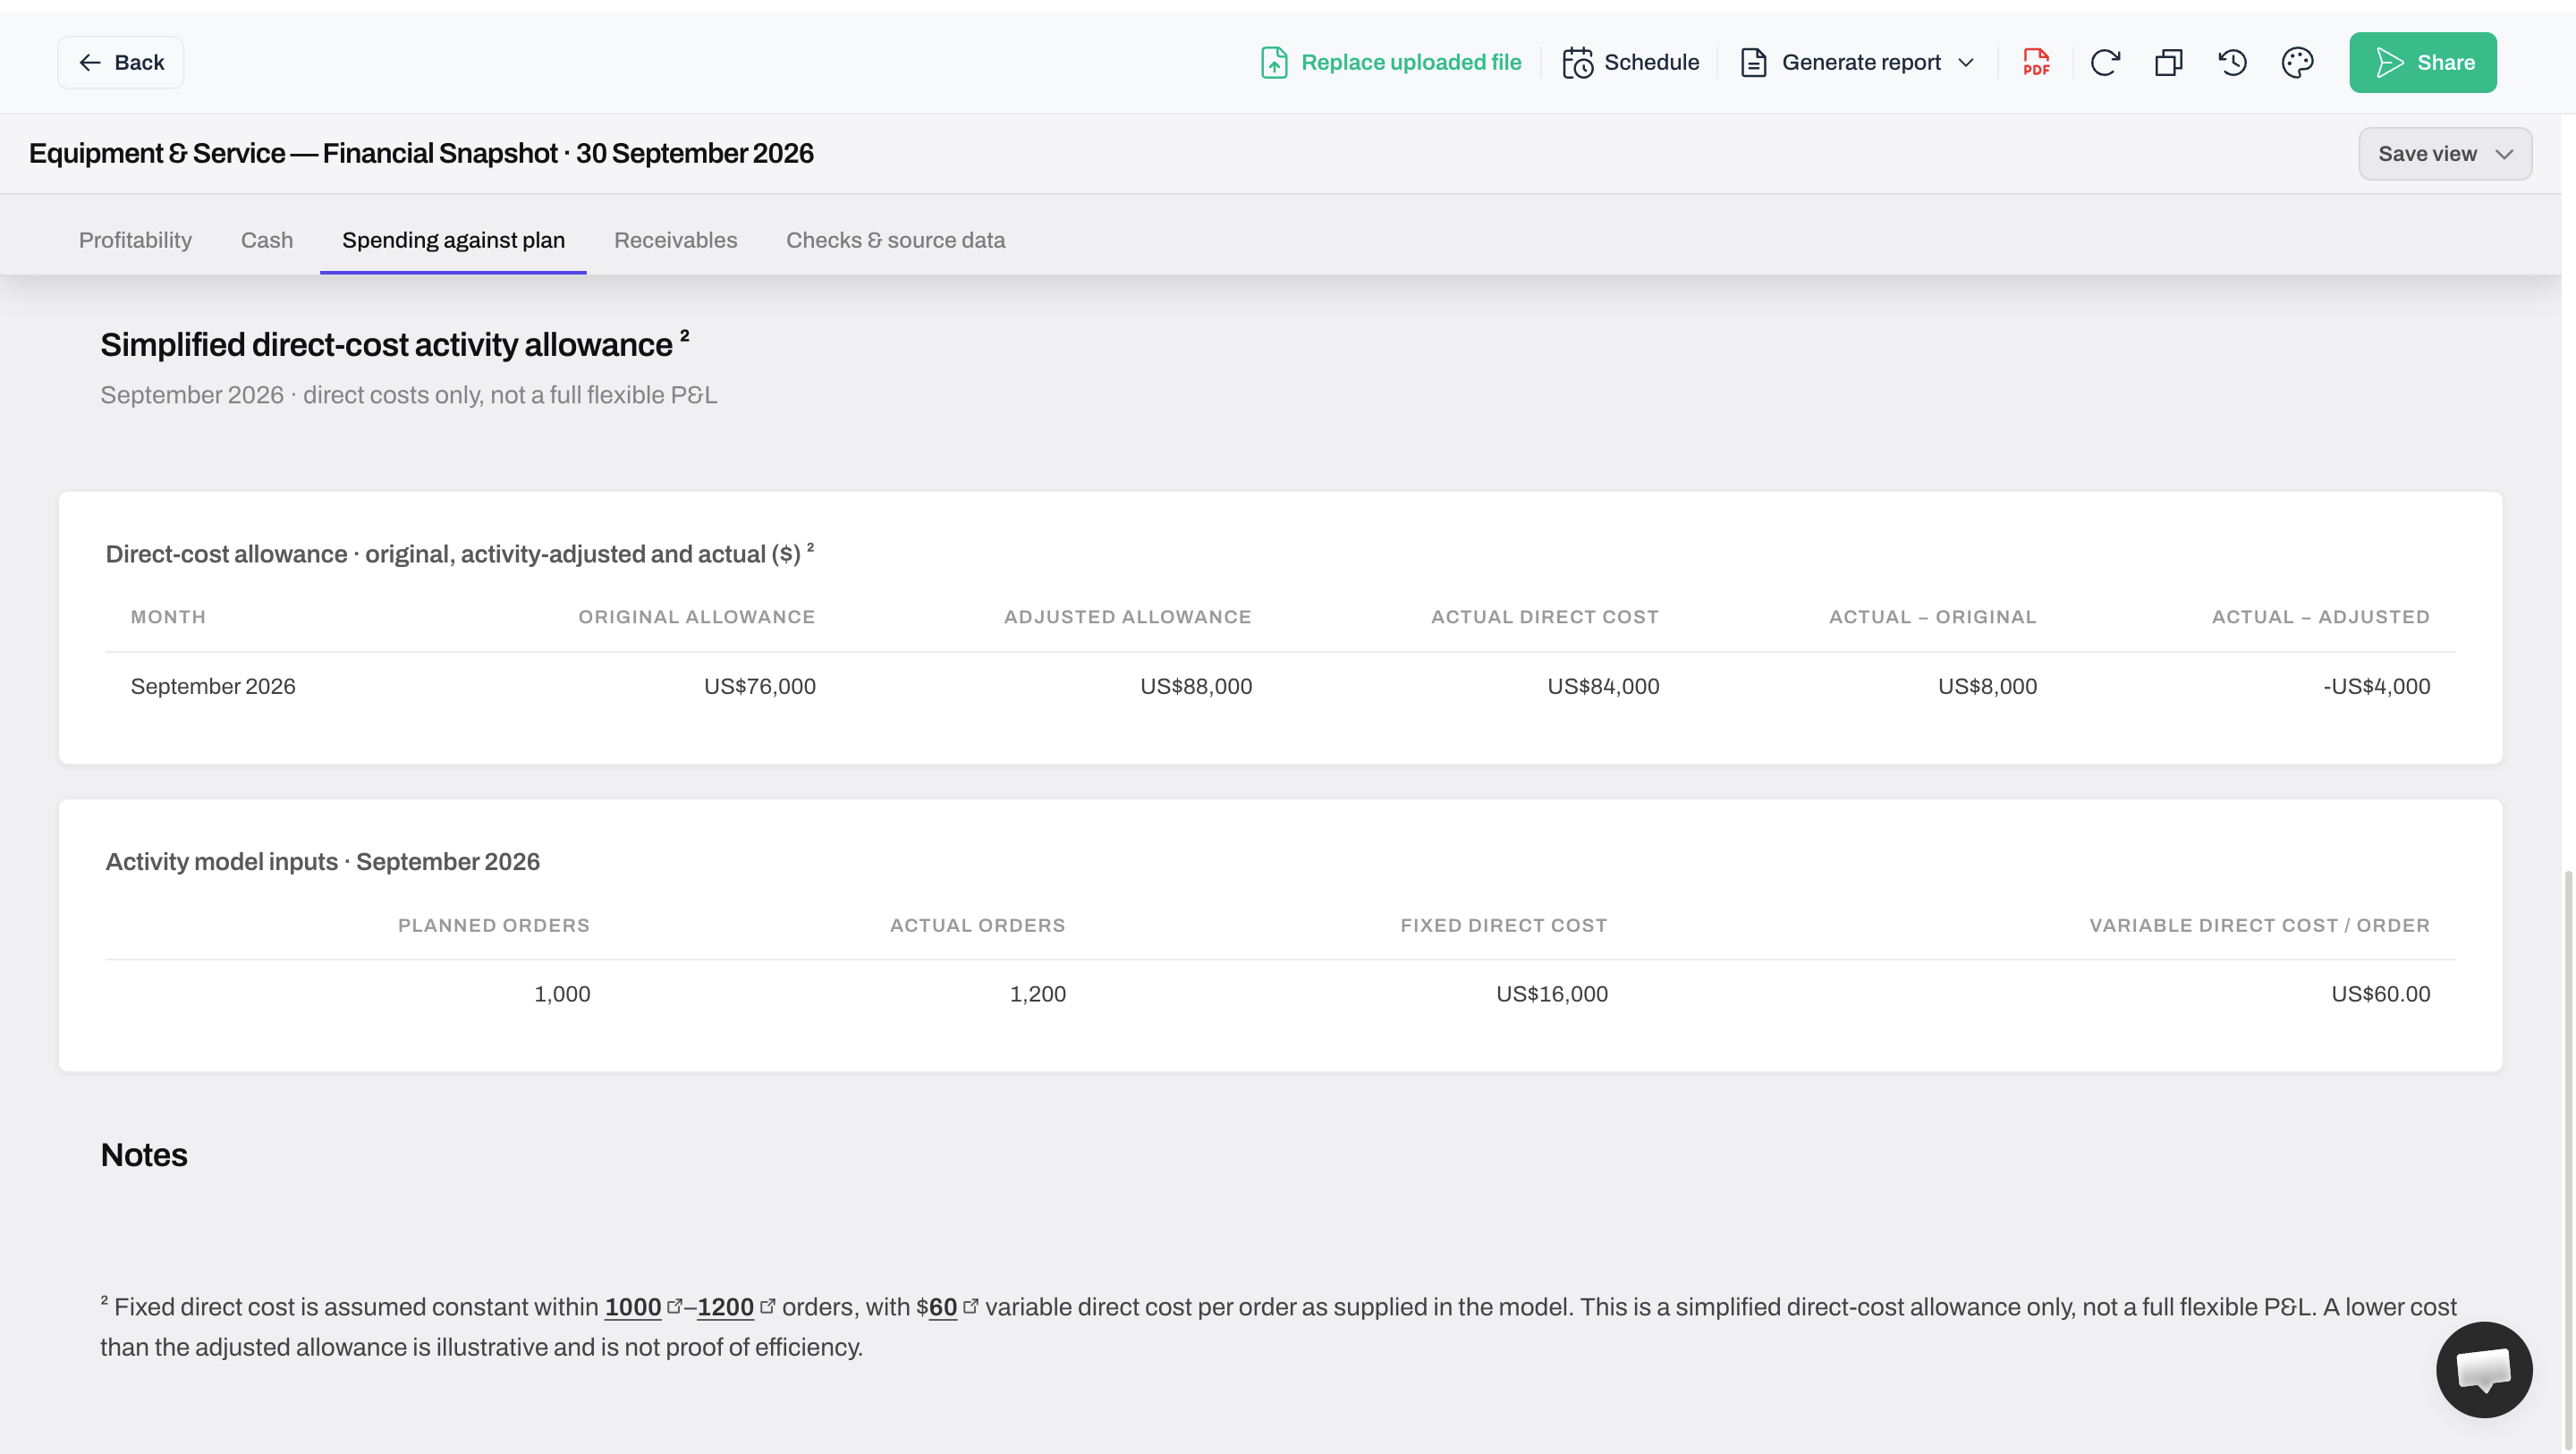
The original plan assumed 1,000 orders, but actual activity was 1,200. Our illustrative model assumes $16,000 fixed cost, unchanged with order volume, plus $60 variable cost for each order. The original allowance is $16,000 + ($60 × 1,000) = $76,000. At actual volume it is $16,000 + ($60 × 1,200) = $88,000.
The original budget asks whether total spending matched the plan: $84,000 is $8,000 above $76,000. The adjusted allowance asks what the same workload should cost under the model. The extra 200 orders add $12,000 to the allowance, making actual spending $4,000 below $88,000. There is no contradiction: the comparisons use different activity levels. ACCA's budgeting guide explains this flexed-budget principle.
The same cost, compared with two different allowances
Read the allowance alongside the order volumes and cost assumptions, not as a standalone efficiency score. First-party Anomaly screenshot; synthetic business-finance data.
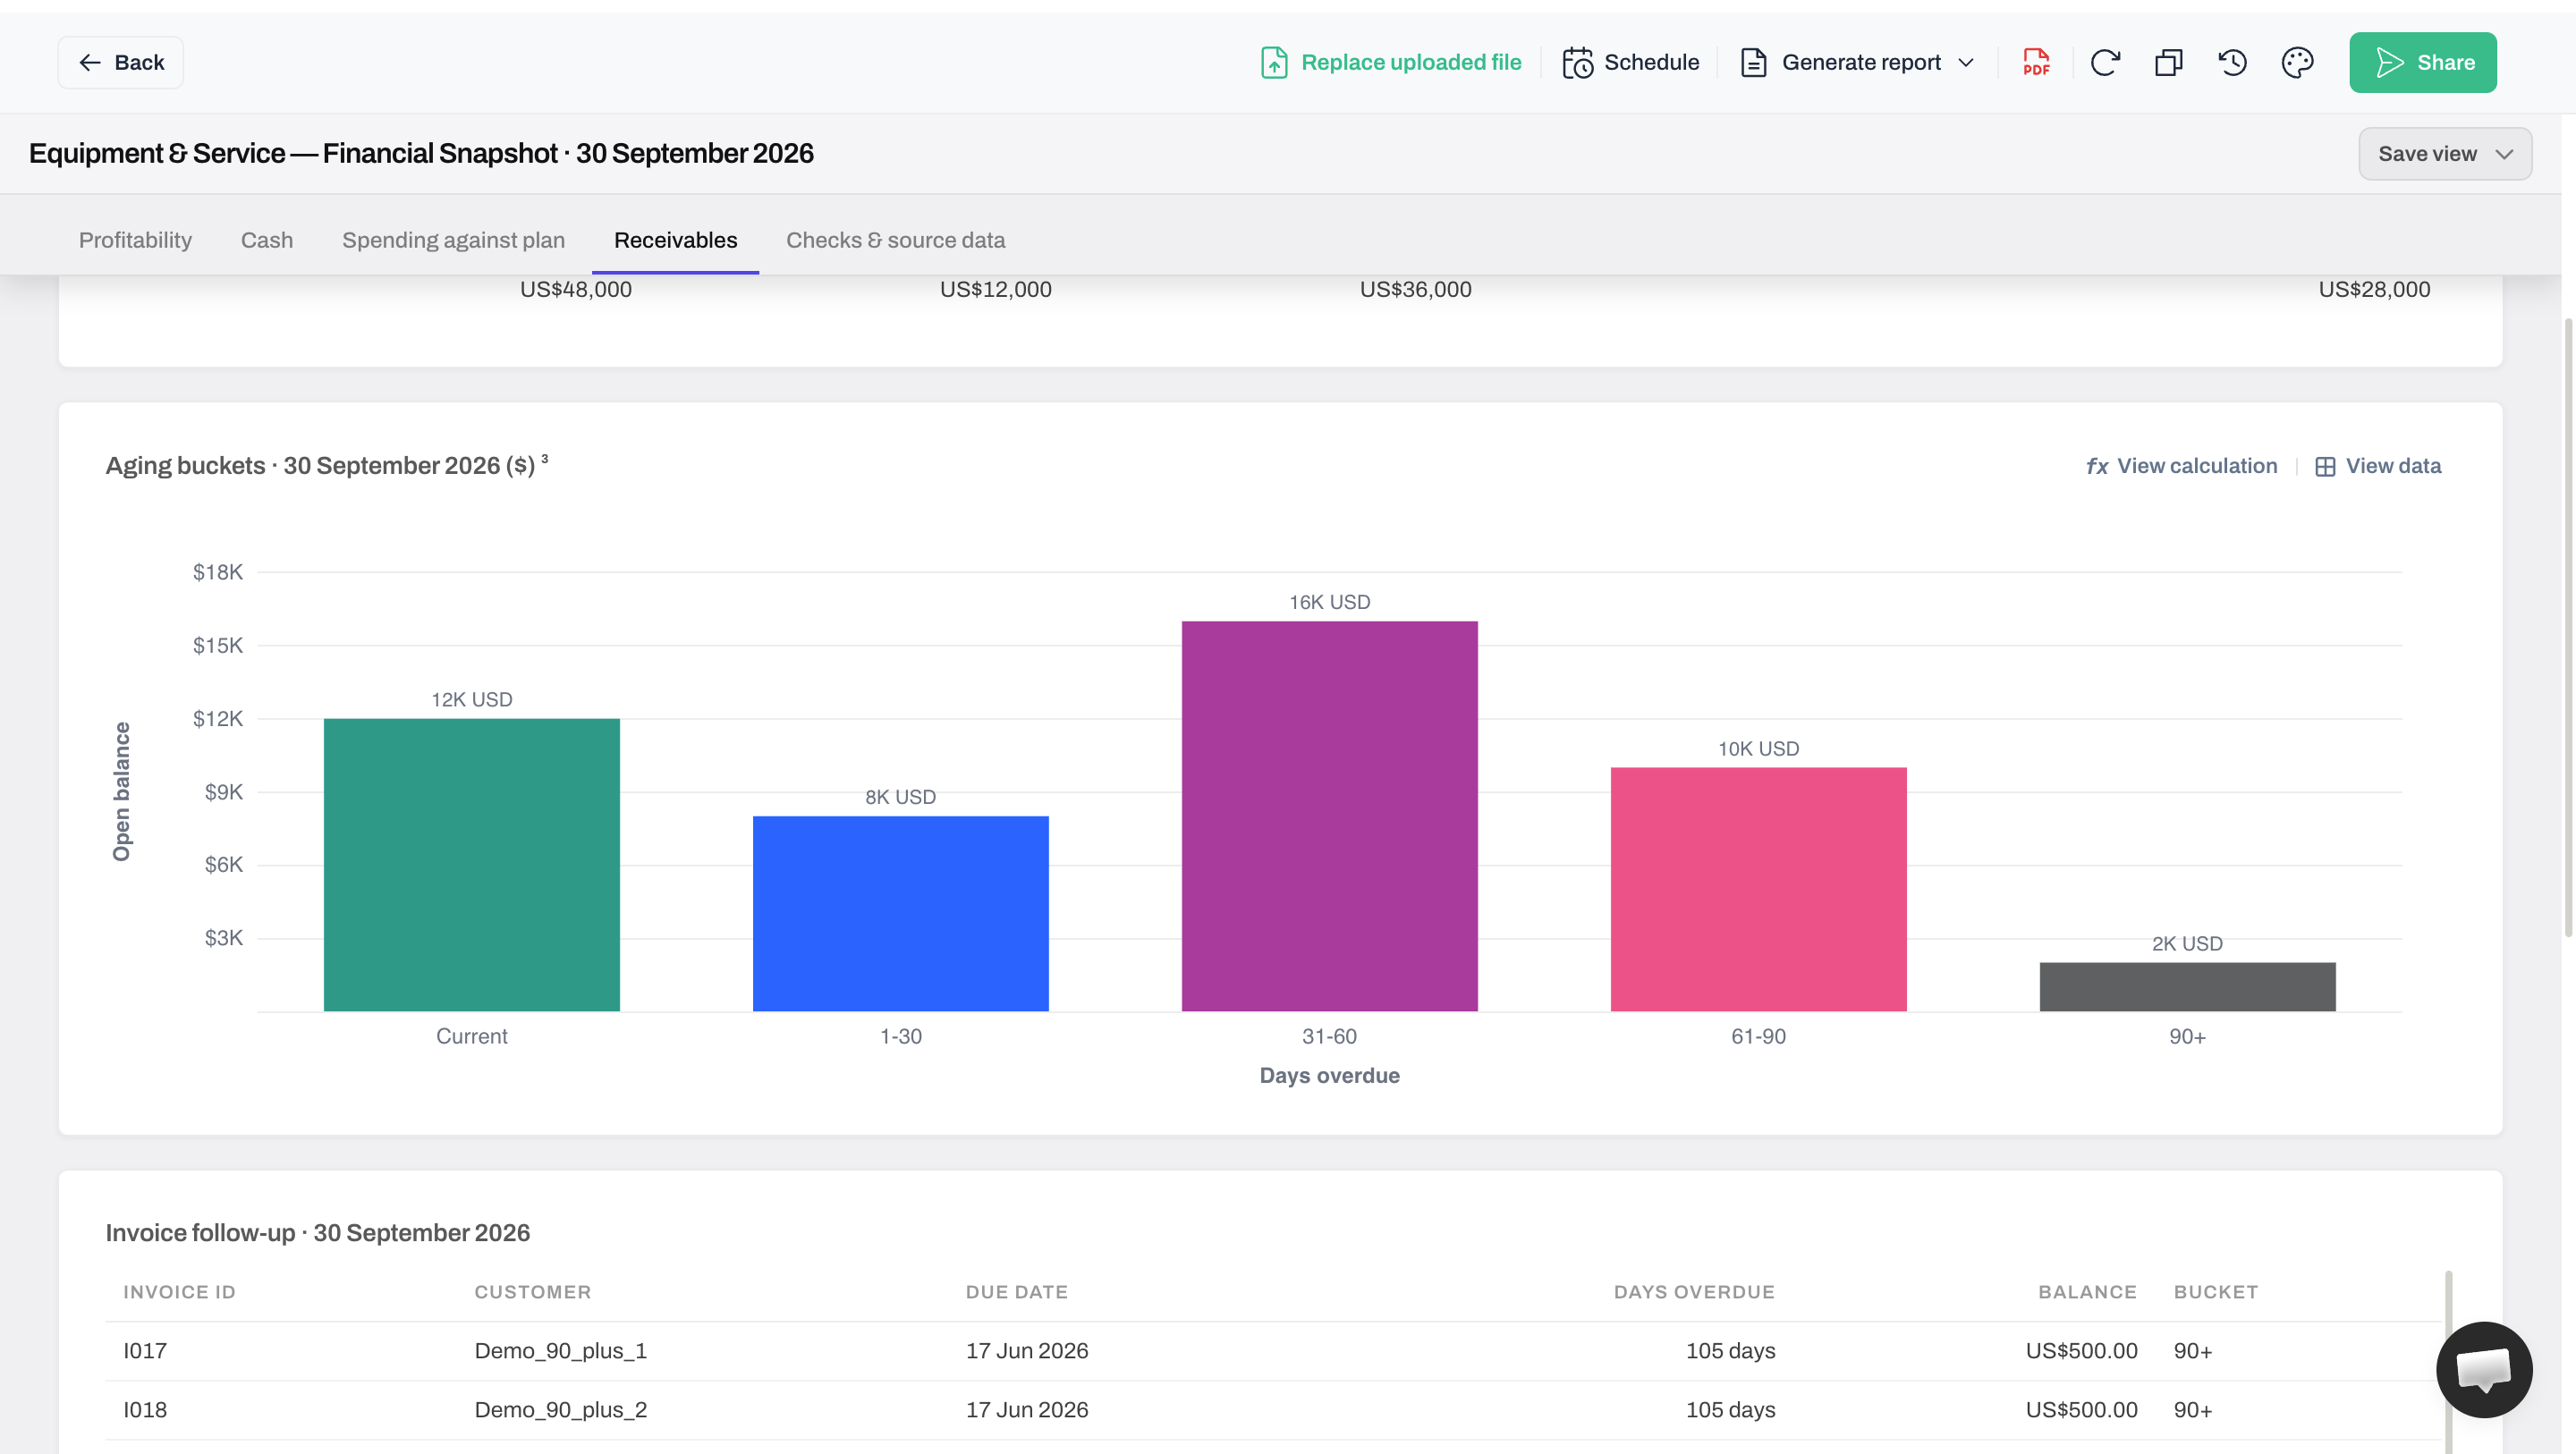
Now open Receivables: money customers still owe. Of the $48,000 open balance, $12,000 is current and $36,000 overdue. Of that overdue amount, $28,000 is more than 30 days past due.
Separate current invoices from overdue balances
Aging uses days past the due date at the fixed reporting snapshot. First-party Anomaly screenshot; synthetic business-finance data.
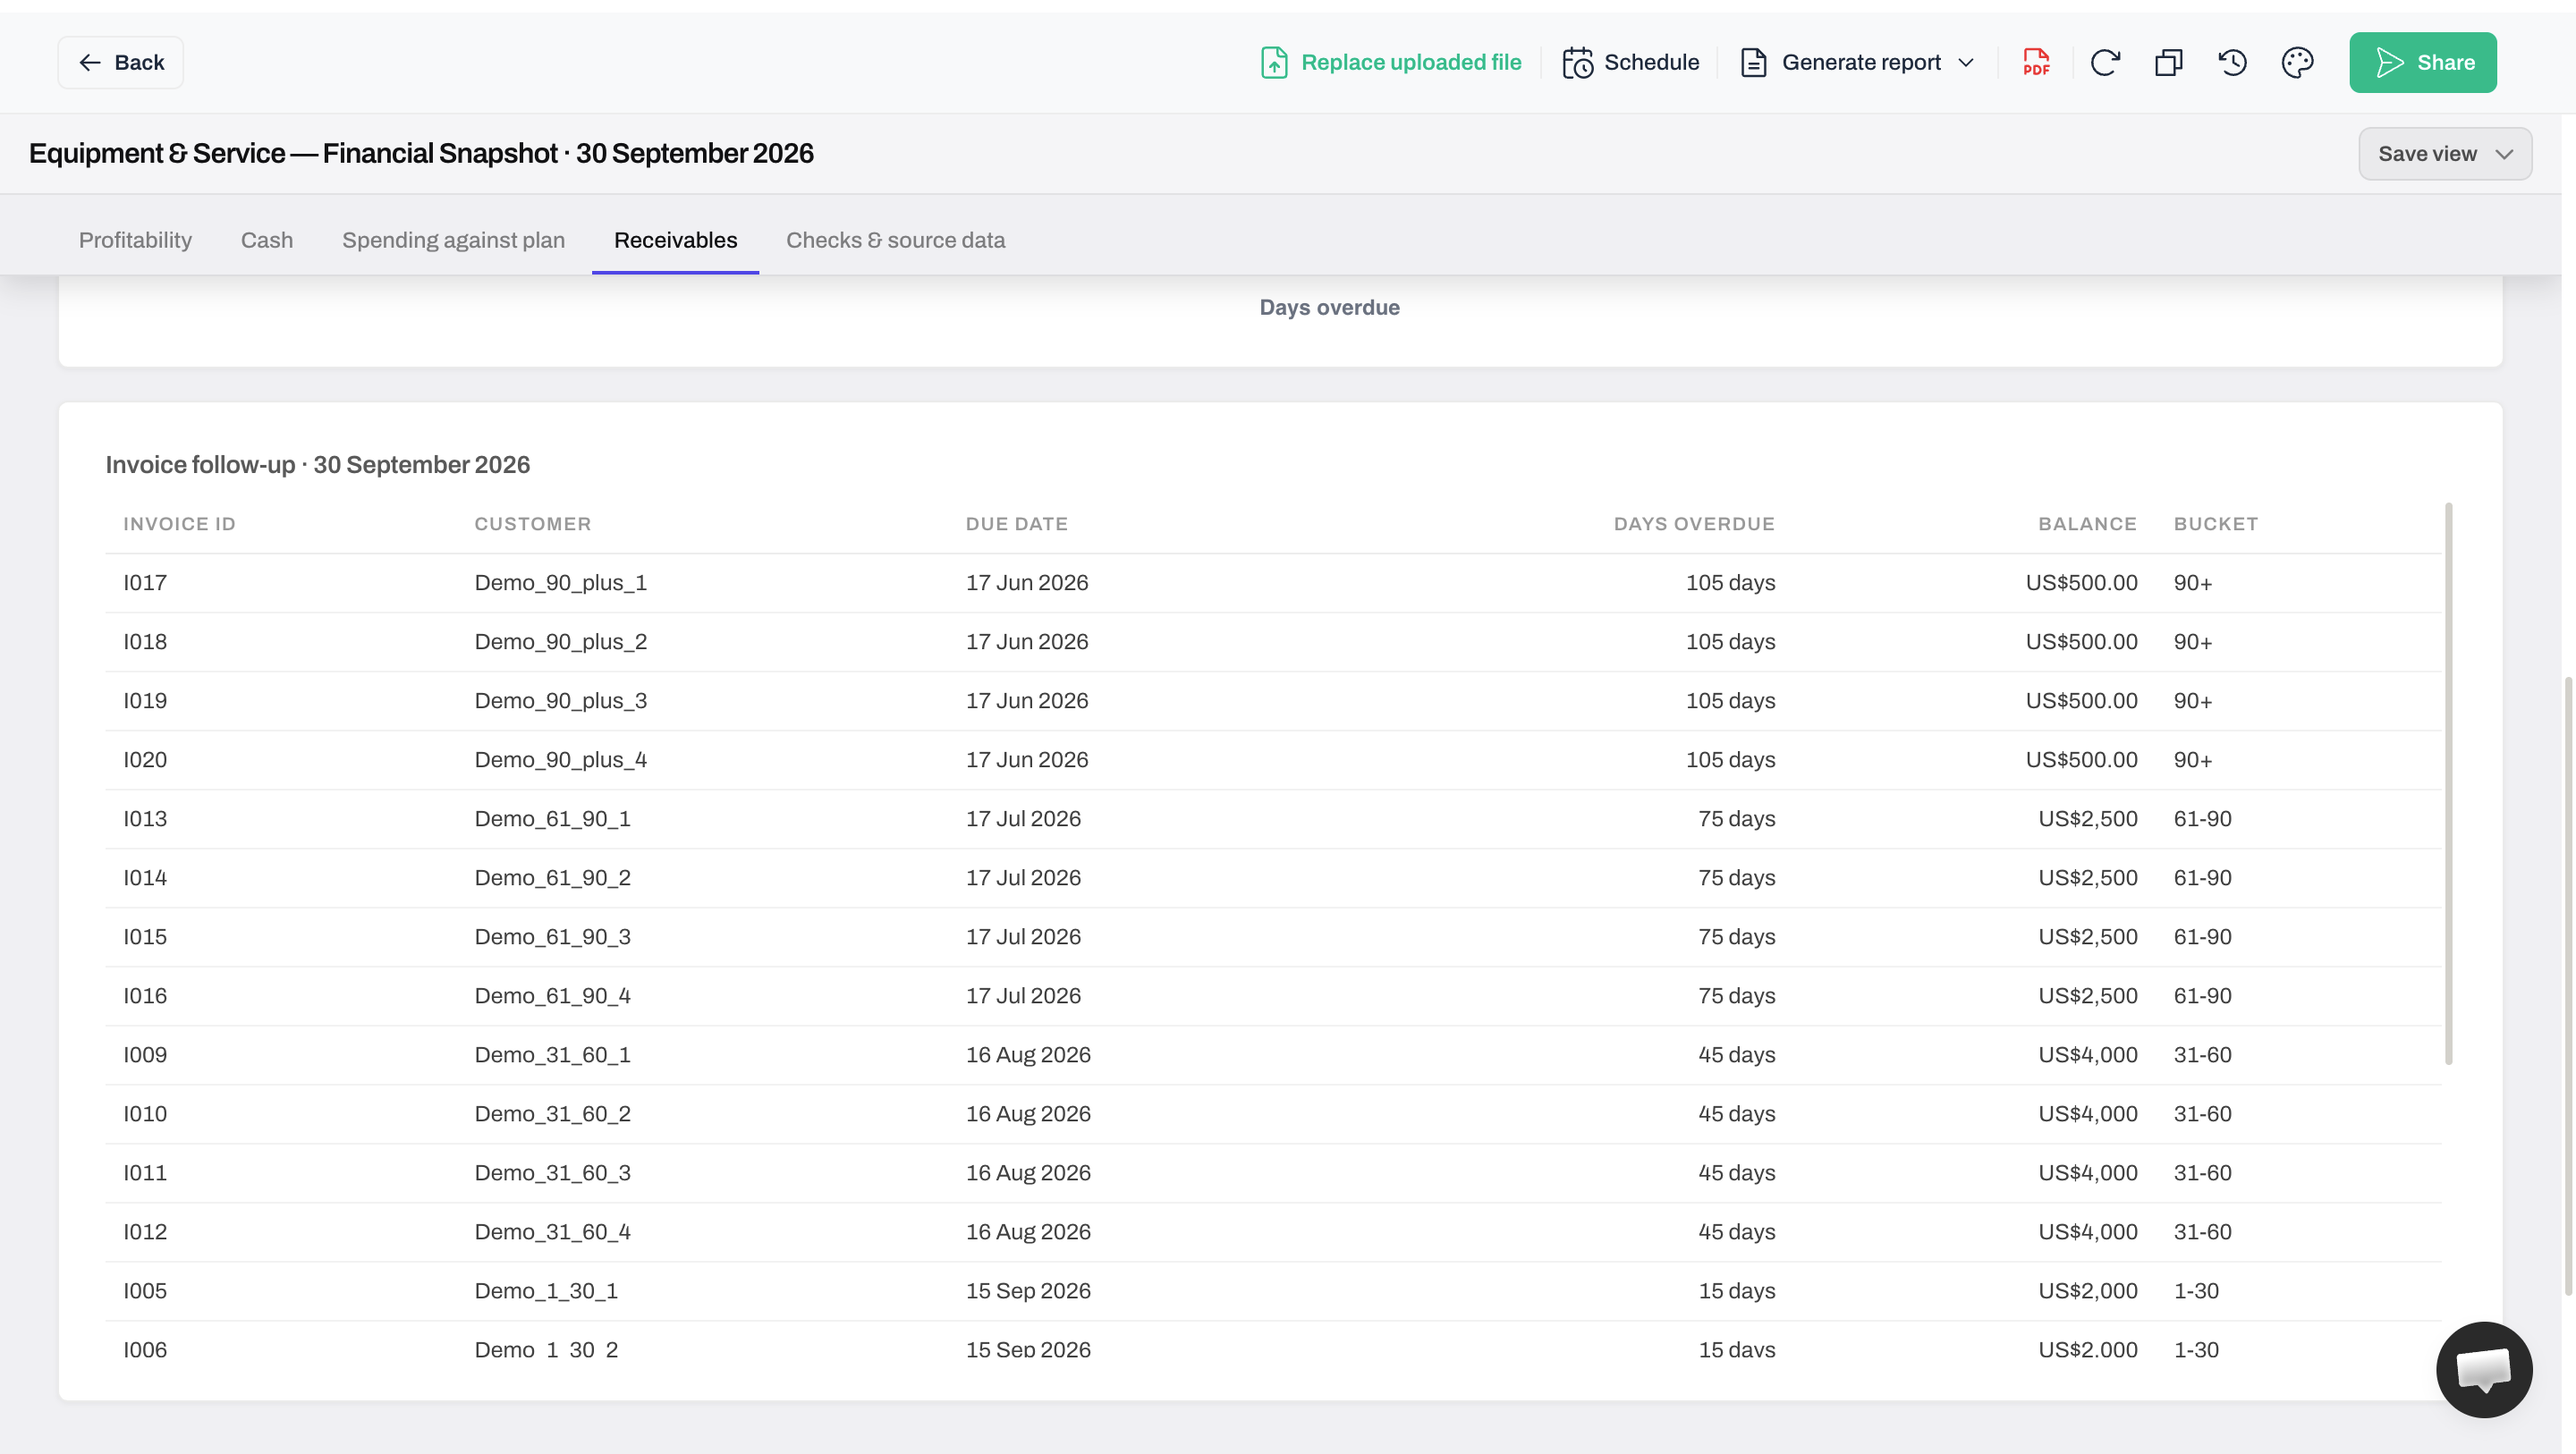
Open the invoice list to turn the overdue total into specific follow-ups. Check due dates and outstanding amounts before assigning them.
Go from an overdue total to a specific follow-up
Inspect invoice-level detail before deciding who needs a reminder. First-party Anomaly screenshot; synthetic business-finance data.
Our receivables-aging guide explains the method. Before acting on either spending or collections, check the figures behind the finding.
05Verify a finding against the source
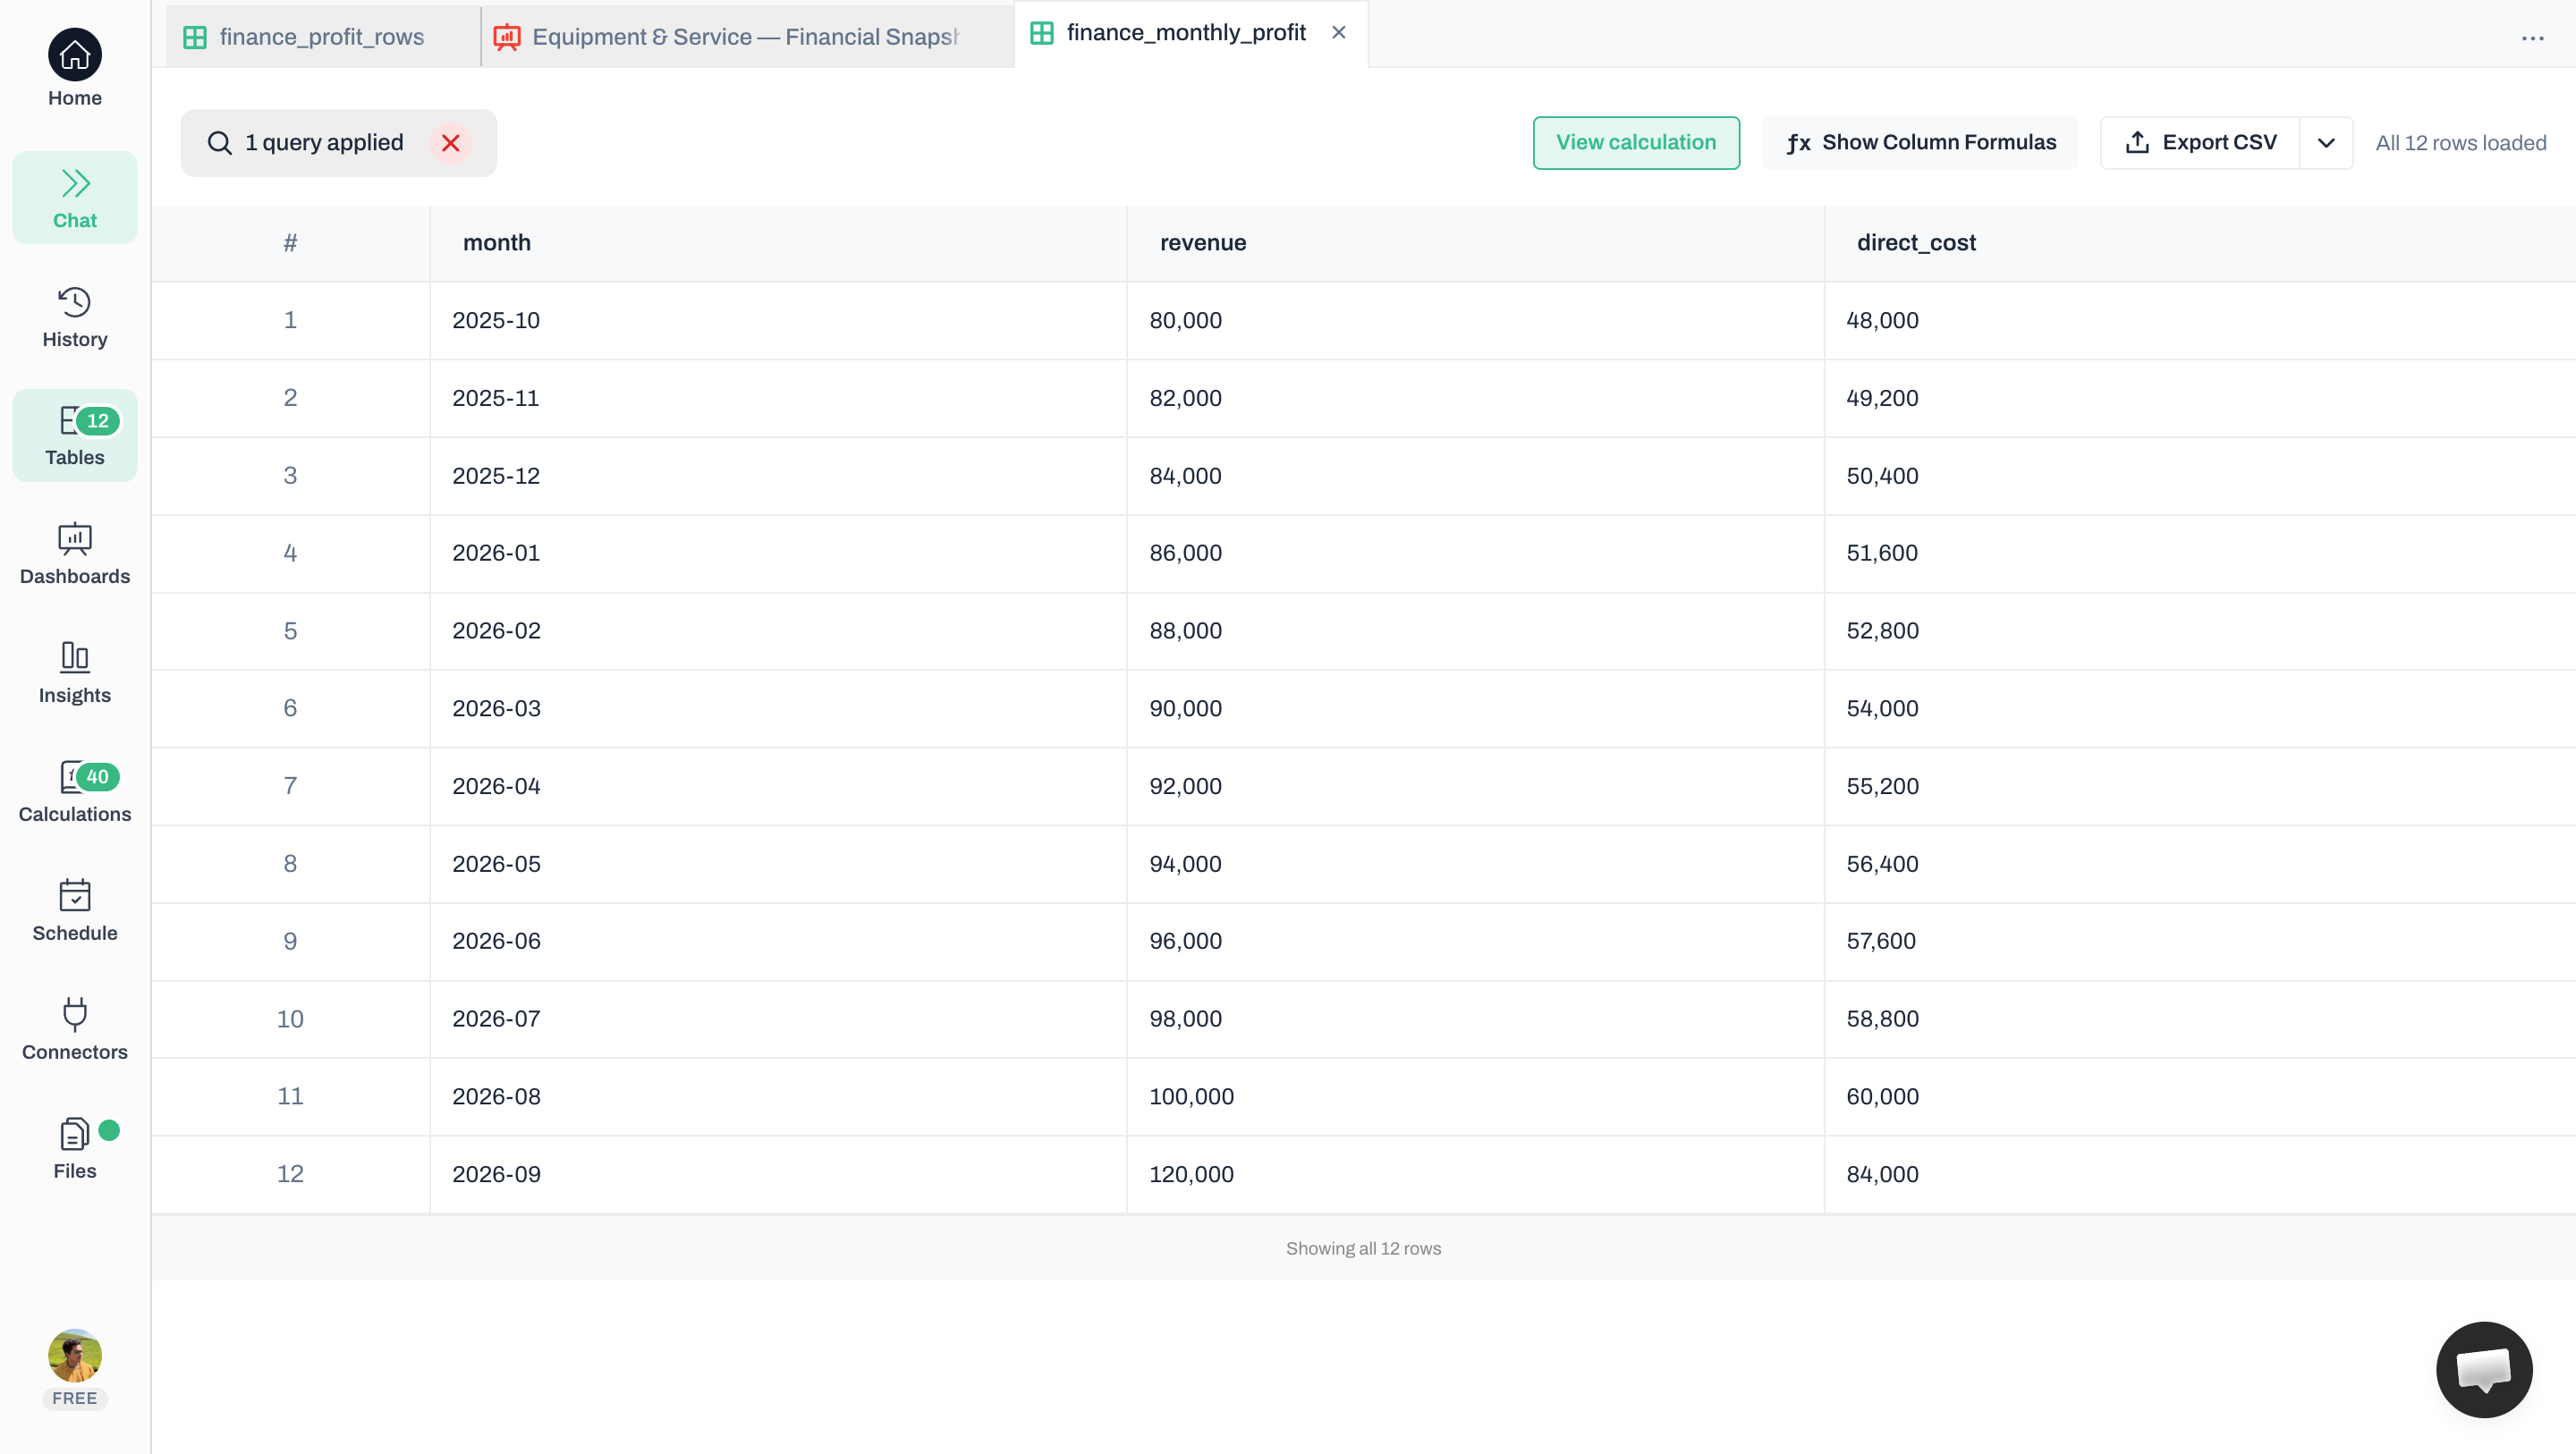
Return to the margin finding. Use the chart's View data and View calculation controls to inspect the rows and working. Confirm the month and included accounts, not just whether the answer looks plausible.
Check the working, not only the chart
Match the displayed measure to its source, reporting date and calculation. First-party Anomaly screenshot; synthetic business-finance data.
September revenue rows total $120,000 and direct-cost rows $84,000. Gross margin is ($120,000 - $84,000) / $120,000 = 30%. You can now explain the lower margin from checked amounts, while leaving its commercial cause open for investigation.
Apply the same check to exceptions. Match one budget row per account and month. Each invoice's amount minus applied payments and credits should equal its open balance; the aging buckets should total $48,000. Keep payments and aging at the 30 September snapshot.
If the report and accounts disagree, check dates, included accounts and missing records before changing the headline figure. Correct arithmetic cannot fix an incomplete source file.
Repeat the review with the same definitions
Keep the same accounts, date fields, currency and exclusions next month. Check new totals and dates while preserving the previous comparison. If your figures come in through a connector, a saved link between Anomaly and the system that holds them, such as Google Sheets, resync it to bring in the new month. Otherwise, export fresh files, replace the old ones and recheck the totals. This demonstration verifies the initial snapshot, not automatic refresh or scheduled delivery.
Choose between spreadsheets, BI tools and Anomaly
Use a spreadsheet when you can maintain the exports, formulas and checks yourself. It suits a review whose inputs remain manageable.
Business intelligence (BI) tools suit recurring finance dashboards used by several teams. They make sense when someone maintains the source connections and shared metric definitions.
Use Anomaly to ask questions across your financial files, build the views and inspect their source rows and calculations in one workflow. This example takes five files to a checked monthly finding. Our financial-reporting software guide covers the fuller selection decision.
Before the meeting
Confirm these points before sharing the findings:
Are the date, currency and provisional or closed status visible?
Do comparisons use the same period length and definitions?
Do bank movements explain closing cash, and do invoice balances add up?
Can you inspect the source and working behind a challenged number?
Does each exception have a next check and a responsible person?
Frequently asked questions
Should a CFO dashboard include a balance sheet?
Include balance-sheet measures when they affect the meeting decision, such as borrowing, stock or supplier obligations. This example focuses on profitability, bank cash, spending and customer invoices. Add the relevant balance-sheet accounts before using it to assess debt capacity or the whole company's financial position.
How often should a financial dashboard update?
Match the update to the decision and source readiness. A monthly performance review needs a consistent closed period. A collections review may need newer invoice balances. Label the date of each view so a current bank balance is not mistaken for the cash balance at the last month-end.
Can I use this dashboard for more than one company?
Start with a separate, checked view for each company. Combining companies requires consistent account definitions, currencies and treatment of transactions between them. The sample's Equipment and Service labels are business units within one fictional company, not evidence of a multi-company consolidation workflow.
What if the month has not closed yet?
Label the figures provisional and give the cutoff date. Compare like-for-like periods or wait for the close before making a final monthly comparison. Missing supplier invoices or late adjustments can change the result, so identify outstanding items rather than treating an unfinished month as a completed one.
Turn the finding into your next review
You now have a checked explanation: sales rose, direct costs grew faster, and cash also funded equipment and uncollected sales. Assign the cost investigation and overdue-invoice follow-ups to someone in your team, with a date to report back.
To try this workflow in Anomaly, attach your profit-and-loss, bank, budget and open-invoice exports. Add an activity model if you need the adjusted-budget comparison. Specify the reporting date, then check one dashboard figure against its source.