How to Choose Financial Reporting Software When Your Numbers Live in Excel
A vendor-neutral way to choose financial reporting software when your numbers live in Excel: three routes, the criteria that decide, and a worked example you can reproduce.
Ash RaiTechnical Product Manager, Data & Engineering
11 min read
Quick answer — choosing financial reporting software when your data is in Excel
When your numbers live in Excel there are three honest routes to recurring financial reports: keep them in Excel with Power Query and templates, connect your accounting system to a reporting tool, or run an AI analysis workspace on the exports you already have. The question that decides between them is whether every number in the report has to trace back to a specific source row — if it does, you are choosing for traceability, not for charts. This guide gives you the three routes, a neutral criteria table, a worked example you can reproduce on a sample file, and the line none of these tools cross: statutory consolidation, close, and audit assurance are a different category of product.
This guide starts from a different situation: your numbers arrive as exports — from QuickBooks or Xero, a payments processor, a payroll run, a bank download — and they meet in Excel. Rather than assume you already run a single accounting system or an ERP, it takes that Excel starting point as given and helps you choose a tool from there: what each route does, how to weigh the criteria, and how to keep every figure defensible.
01What you are actually automating
Before comparing tools, be precise about the work. Common recurring outputs include a management P&L, a cash report, a budget vs actual, and a board or investor pack that wraps them together. The month gets eaten by the steps between the export and the finished report:
Export the data from each system.
Clean it — headers, types, blank rows, duplicated lines.
Map accounts and categories to the way you actually report.
Calculate the totals, subtotals, and comparisons.
Format it into something a stakeholder can read.
Distribute it, then answer the "where did this number come from?" questions.
A tool can take over the middle four steps. What no tool decides for you is the judgement: which adjustments are real, what the commentary says, and who signs it off. Keep that in mind when a product promises the report "writes itself" — it means the calculation and formatting, not the accountability.
02Route 1: stay in Excel
The most underrated option is the one you already own. Power Query turns a folder of monthly exports into one refreshable table, PivotTables build the summaries, and a saved template holds the layout. The "From Folder" refresh path is four short steps:
In Excel, open Data → Get Data → From File → From Folder and point it at the folder of monthly exports.
Power Query combines every file that shares the same columns into one table; per Microsoft's documentation it matches by column name, so the columns need not be in the same order.
Shape the combined table once — headers, types, and filters — then load it to the workbook and build your PivotTables and template on top.
Next month, drop the new export into the folder and click Refresh, and the same steps re-run on the new file.
Where it breaks: multiple entities that have to be combined, many exports with slightly different shapes, and version drift — three copies of "final" in an inbox, and no record of which number came from which file. Power Query can refresh on open or on an interval, but a basic query is not an unattended pipeline until you configure it, and it will not tell a reviewer why a figure changed.
03Route 2: connect the accounting system to a reporting tool
If your numbers really do all live in one ledger, the shortest path is that system's own reporting. QuickBooks Online generates the standard statements — profit & loss, balance sheet, and cash flow — directly from your bookkeeping data, along with receivables reports; customizable management-ready reports and two-way Excel sync sit in its higher tier. Xero produces profit and loss, balance sheet, cash flow, aged receivables and payables, and budget variance, with custom report layouts you can save, publish read-only, or export to Excel and PDF. (First-party product pages, accessed 2026-09-25.)
What these do well is exactly what they are built for: reports that follow the chart of accounts and drill back to the underlying transactions. QuickBooks Online can also email a set of reports on a schedule; Xero's saved report packs and templates are a practice-level feature in its partner tools rather than part of the standard reporting page. Where they stop is anything not in that ledger. The moment a number depends on a spreadsheet the accounting system never saw — a commission model, a second entity, a marketplace payout file — you are back to exporting and combining outside the tool. A dedicated reporting layer on top (the QuickBooks/Xero → reporting-tool pattern) adds nicer packs and account mapping, but it still reports on ledger data.
04Route 3: an AI analysis workspace on the exports
The third route keeps Excel as the source of truth but moves the calculation somewhere it can be inspected. An AI analysis workspace imports the exports you already have, builds the report you describe in plain language, and — this is the point for finance — shows the logic and the source rows behind each number, then re-runs on next month's file.
Disclosure: Anomaly AI is our product. It is one option in this route, and the criteria in the next section apply to it exactly as they apply to the others.
Anomaly AI imports Excel and CSV files (and connects to sources like GA4, BigQuery, Google Sheets, MySQL, and Snowflake), turns a request such as "build a management P&L from these transactions" into an interactive result, and lets you open any figure to see its calculation and the exact rows it came from. Outputs go back out as an Excel report, an Excel-native dashboard, a PDF, PowerPoint, or Word, and a report can be scheduled by email on Pro and above. What it does not do is equally important to state: it is not a statutory consolidation or close tool, it does not produce audited statements, and it is not a real-time monitor. Those boundaries are in what none of these tools do.
05How to choose — the criteria
There is no single "best" here, because the routes answer different situations. Weigh them against the criteria that actually change the outcome. The table lists the options in alphabetical order; read down the columns, not for a winner.
All your numbers already live in one accounting system
AI analysis workspace (Anomaly AI — our product)
Excel/CSV uploads; GA4, BigQuery, Google Sheets, MySQL, Snowflake
Import Excel/CSV; export Excel reports, Excel-native dashboards, PDF, PowerPoint, Word
Each number has a "view calculation" and the source rows behind it
Scheduled email reports (PDF, on Pro and above); re-run on the next file
No statutory consolidation or close
Free $0; Pro $25/month; Analyst $90/month; Team $45/seat/month (2-seat min); Enterprise custom
Numbers spread across exports; each figure must be defensible
BI / dashboard tool (e.g. Power BI, Data Studio)
Many connectors; Power BI expects data modeled first, Data Studio can connect directly
Power BI shapes data in Power Query; exporting underlying data is limited
Not automatic per number; depends on the model or connector you build
Publish and schedule dashboard refresh
Whatever you build into the model
Per-user monthly (Power BI Pro billed yearly); Data Studio has a free tier
Data is already clean and modeled; you want dashboards
Excel + Power Query
Any files you can open or point a query at
Native — it is Excel
Formulas are visible, but you build and own the checks
Manual, or refresh-on-open/interval once configured
Manual, across workbooks
Bundled in a Microsoft 365 subscription (or perpetual Office)
A few files, one owner, a stable monthly template
How to weigh it depends on who you are:
Owner-operator: the deciding criteria are Excel round-trip and price basis. If the numbers already sit in one accounting system, its built-in reports are usually enough; if they arrive as scattered exports, the cost of a heavier platform rarely pays back — stay in Excel, or use a workspace on the exports.
Small finance team: traceability and scheduling matter most. Once someone other than the preparer relies on the numbers, "where did this come from?" gets asked in meetings, and a tool that answers it per number saves the rework. Multi-entity is where the accounting system's base plan runs out.
Agency or consultant producing packs for clients: you are optimising for repeatable distribution across many datasets. The relevant criteria are data sources (you inherit whatever the client uses) and distribution. For the marketing-reporting version of that job, see client reporting tools for marketing agencies.
Notice what did not decide it: a feature count, or a "best/top" label. "What is the best financial reporting software" has no answer without the row you are in — the useful question is which criteria your situation is sensitive to.
06Worked example: from a transactions export to a report you can trace
Here is the traceability route made concrete, on a file you can download and run yourself. The sample is one month of small-business transactions — 11 rows with date, description, category, type, and amount.
Follow along with the sample file
f1-transactions-sample.csv — 11 transactions that reconcile to a clean management P&L. Synthetic data, no real customers. Download the sample CSV.
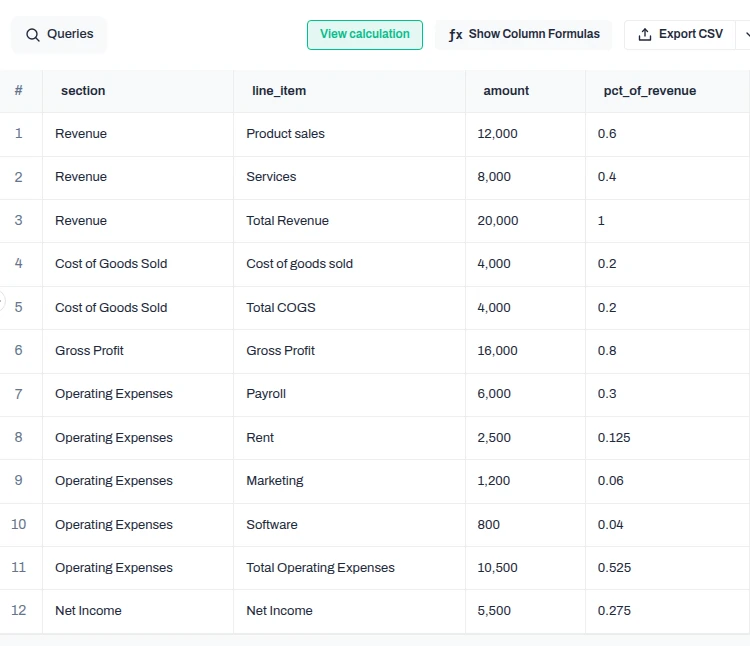
The file totals to a management P&L you can check by hand: revenue $20,000 (product sales $12,000 + services $8,000), cost of goods sold $4,000, gross profit $16,000, operating expenses $10,500 (rent $2,500, payroll $6,000, software $800, marketing $1,200), and net income $5,500. Those are arithmetic facts of the file — the test of a reporting tool is whether it produces them and lets you prove each one.
The steps are the same whichever way you get there; in an AI workspace like Anomaly they look like this:
Import the transactions file (Import Data → drop the CSV).
Ask for the report: "Build a management P&L from these transactions — revenue, COGS, gross profit, operating expenses by category, and net income."
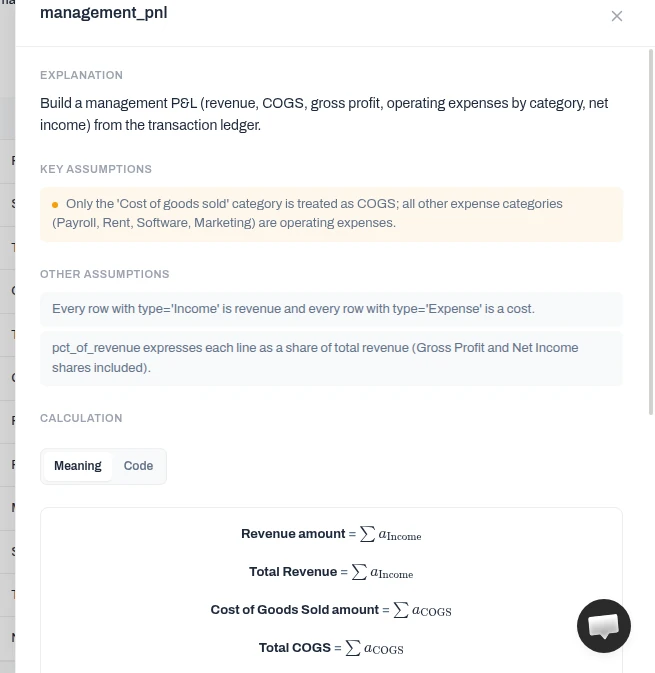
Open a number — say gross profit — and read its calculation (revenue minus cost of goods sold).
Trace to source rows: the exact transactions behind each subtotal, so marketing's $1,200 is visibly the two ad lines, not an unexplained figure.
Export to Excel or PDF, and re-run the same report on next month's file.
The management P&L Anomaly built from the sample on the run recorded in the Source Record: revenue $20,000, cost of goods sold $4,000, gross profit $16,000, operating expenses $10,500, net income $5,500 — the same totals you can check by hand. First-party product screenshot; illustrative sample data.Open any figure and "View calculation" shows the explanation, the assumptions, and the formula behind each line — revenue and total revenue as the sum of the income rows, cost of goods sold as the sum of the cost-of-goods-sold rows, and the same pattern down to gross profit (revenue minus COGS) and net income. First-party product screenshot; illustrative sample data.
That chain — line, calculation, rows — is the difference between a report you present and a report you can defend when someone questions a figure. A dashboard tool can draw the $16,000; whether you can open it back to the eleven rows depends on the model behind it.
If you run a small business, the heaviest products in this category — consolidation and FP&A suites — are built to solve multi-entity close and planning problems you probably do not have yet, and the setup cost is real; skip them. What actually matters at your size is narrower: an Excel round-trip (your data goes in and useful output comes back out without a migration), a price basis you can predict, and clarity on who owns the definitions — the one person who can say what "revenue" includes. A tool nobody on the team can operate is not cheaper than a spreadsheet, whatever the sticker says.
08What none of these tools do
Be clear about the edge. None of the routes here handle statutory consolidation, a formal close, or IFRS/GAAP compliance, and none provide audit assurance — a tool can make your numbers traceable, but it cannot sign them. If you need consolidated statutory accounts across legal entities, a group close calendar, or audit-grade controls, that is a different category of software (financial consolidation and close platforms) and a conversation with your accountant or auditor, not a reporting-tool purchase. This guide is about producing management and operational reports you can trust and defend — not about replacing professional assurance.
FAQFrequently asked questions
What is financial reporting software?
Financial reporting software turns accounting and transaction data into recurring reports — a management P&L, cash report, budget vs actual, or board pack — with less manual work than rebuilding them in a spreadsheet each period. In practice the category spans three different kinds of product: an accounting system's built-in reports, an AI analysis workspace that reports on your exports, and BI or dashboard tools that visualise data you have already modelled. They are not interchangeable, so the useful first step is deciding which kind fits your situation.
Is accounting software enough for financial reports?
Often yes — if all your numbers live in that one ledger. QuickBooks Online and Xero both generate the standard statements (profit & loss, balance sheet, cash flow) directly from your bookkeeping data and can drill back to the transactions behind a line. The limit is that they report only on data that is in the accounting system. As soon as a number depends on a spreadsheet the ledger never saw — a second entity, a commission model, a marketplace payout — you need something that reports across the exports too.
What is automated financial reporting?
Automated financial reporting means the export, cleanup, mapping, calculation, and formatting steps are handled by the tool so you do not rebuild the report by hand each period — you refresh it on the new data. What stays manual is the judgement: which adjustments are real, what the commentary says, and who signs it off. Treat "the report writes itself" as a claim about the calculation and formatting, not about accountability, and check that you can still trace each number.
Can you do financial reporting from Excel?
Yes. Excel with Power Query and PivotTables is a legitimate route: point Power Query at a folder of same-schema exports, and it combines them into one table you refresh each month. It works well for one entity, a few files, and a stable template owned by one person. It gets fragile with multiple entities, many differently shaped exports, and version drift — at which point either an accounting system's reporting or an AI workspace on the exports usually earns its keep.
What's the best financial reporting software?
There is no single best — it depends on the criteria in the section above. Match the tool to your situation: if your numbers already live in one accounting system, its built-in reports are usually enough; if they arrive as scattered Excel exports and each figure has to be defensible, an AI analysis workspace that shows the calculation and source rows fits better; if the data is already clean and modelled and you mainly want dashboards, a BI tool does that. Decide by data sources, Excel round-trip, traceability, scheduling, multi-entity needs, and price basis rather than by a ranking.
Build a report you can trace
If your numbers live in Excel and each figure has to hold up, try the traceability route on your own file: import the transactions, describe the report, and open any number to its calculation and source rows.
Ash Rai is a Technical Product Manager with 5+ years of experience building AI and data engineering products, cloud and B2B SaaS products at early- and growth-stage startups. She studied Computer Science at IIT Delhi and Computer Science at the Max Planck Institute for Informatics, and has led data, platform and AI initiatives across fintech and developer tooling.