
Data Analysis
9 min
How to Recover When Your CSV Upload Fails
A practical CSV upload recovery workflow for file size, encoding, delimiters, headers, malformed rows, validation, and safe re-upload.
Read More
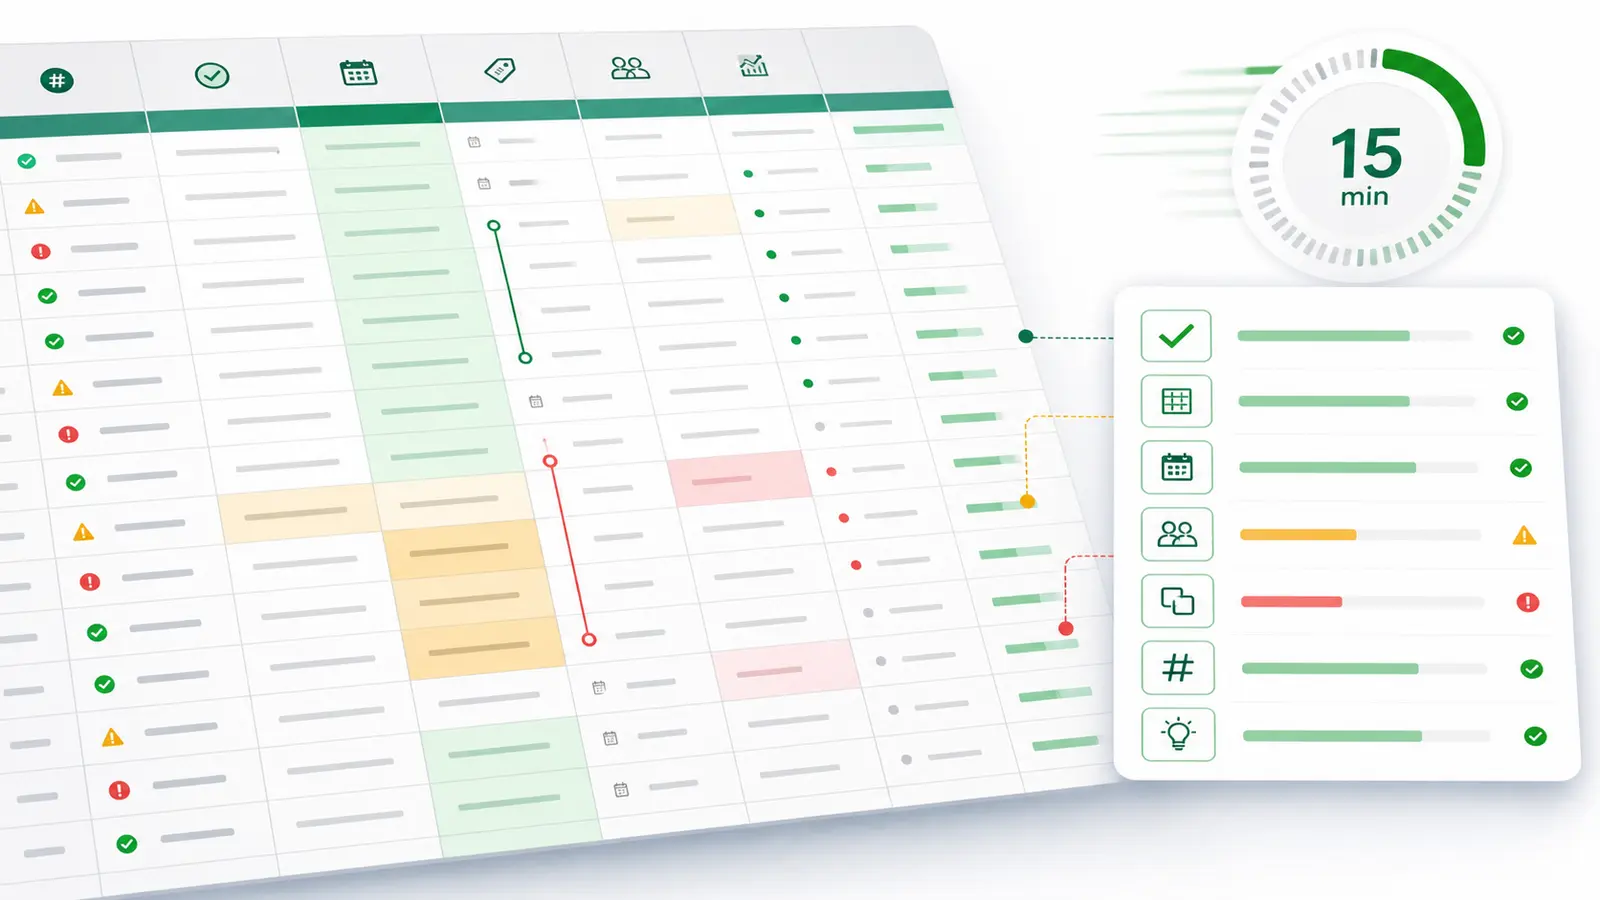

Quick answer — pre-meeting data audit for a large CSV
A 15-minute pre-meeting data audit is a focused first pass: define the meeting question, confirm the CSV is complete enough to use, check schema, missing values, duplicates, date windows, outliers, grouping dimensions, and top movers, then write only the claims the data supports. It is not exhaustive cleanup, statistical modeling, or guaranteed root-cause analysis.
You have a large CSV and a critical meeting coming up. The executive or client expects a data-driven answer. You do not have time for full cleanup, modeling, and a polished dashboard tour. You need a defensible first read.
That is the job of a pre-meeting data audit: find the fastest safe answer the file can support, and just as importantly, name what the file cannot support yet.
Large CSVs make this risky. Microsoft says Excel worksheets are limited to 1,048,576 rows by 16,384 columns. Microsoft also warns that if a CSV exceeds the Excel grid, some data may not load, and saving over the original file can lose data that was not loaded.
So the audit is not just "open the file and sort descending." It is a quick sanity check on whether the file is complete enough, parsed correctly enough, and narrow enough to support a meeting-safe claim.
This 15-minute audit is a rapid assessment. It is designed to identify immediate insights and obvious data-quality risks before you walk into a room.
It can help you:
It cannot clean every field, reconcile every source, prove causation, forecast the next period, or guarantee a root cause. If the meeting needs that level of certainty, the honest answer is not "give me 15 minutes." It is "I can give you a first-pass read now and a verified follow-up after the full analysis."
That distinction matters. Executives do not need false confidence. They need a clear answer with visible evidence and boundaries.
Before opening the CSV, write the question you need to answer.
"What happened?" is too broad. So is "why are sales down?" A better 15-minute question sounds like:
Then lock the basics:
The point is to reduce the file to a decision surface. If the meeting is about a CAC spike, use the same discipline as a board-safe CAC explanation: define the metric, show the evidence, name uncertainty, and state the next action. If the meeting is a client performance review, pair the audit with a pre-meeting analytics prompt workflow so every prompt has a source, date range, and caveat.
Use this as a clock, not a checklist you keep perfecting forever.
If the CSV needs deeper cleanup, move to a full CSV analysis workflow. The 15-minute audit is for deciding what is safe to say now.
Use this matrix when the meeting is close and the CSV is too large to trust by eye.
| Check | Why it matters | What to inspect | Meeting-safe wording |
|---|---|---|---|
| File completeness and row count | Incomplete files skew totals, averages, and top-mover rankings. | Expected row count, column count, export timestamp, and whether the file was truncated by a spreadsheet grid. | "The file appears complete enough for this first-pass read, but we should confirm row counts against the source before treating it as final." |
| Header and schema match | Wrong headers make the rest of the analysis look right while pointing at the wrong columns. | Expected headers, renamed columns, missing columns, duplicate names, and unexpected extra fields. | "The key columns match the expected schema for the meeting question." |
| CSV parsing and quoted fields | CSV fields can include quoted commas, line breaks, and escaped quotes. Bad parsing can shift columns. | Delimiter, header row, field count, quoted fields, line breaks, and whether suspicious rows have shifted values. | "The sample rows parse cleanly enough for a directional read; rows with complex quoted fields still need a fuller check." |
| Metric column type | A numeric metric treated as text can break sorting, sums, averages, and top-mover analysis. | Currency symbols, commas, percent signs, blanks, text values, and negative values. | "The metric is usable for this first pass after checking type and obvious invalid values." |
| Missing values | Missing dates, identifiers, or metric values can change the story. | Nulls and blanks in the metric, date, entity, and grouping columns. | "The answer depends on columns with visible missingness, so this should be framed as provisional." |
| Duplicate rows or keys | Duplicates can inflate counts, revenue, user totals, orders, or events. | Duplicate rows, duplicate IDs, duplicate composite keys, and repeated transaction or customer identifiers. | "There are duplicate-risk checks to resolve before we call this final; the directional read still points to the same segment." |
| Date window and freshness | The wrong period can create a fake spike, drop, or ranking. | Start date, end date, timezone, comparison period, late-arriving rows, and export timestamp. | "This read covers the period visible in the file; the newest rows may need a source-system refresh." |
| Grouping dimensions | Dirty categories split the same entity into multiple buckets. | Case, whitespace, aliases, blank categories, merged labels, and inconsistent naming. | "The segment ranking is useful, but category cleanup may change the exact ordering." |
| Outliers | Extreme values can dominate averages and movement tables. | Minimums, maximums, negative values, impossible values, and unusually large records. | "The movement is concentrated in a small number of high-impact rows, so we should inspect those rows before generalizing." |
| Top movers | Meetings usually need the strongest visible contribution, not every chart. | Largest positive and negative movement by the relevant dimension. | "The largest visible movement in this CSV is in this segment; we still need context before saying why." |
| Metric definition and business rules | The same label can mean different calculations across teams. | Metric formula, inclusion/exclusion rules, business definitions, and cross-column consistency. | "This answer uses the visible metric definition in the file; we should confirm it matches the business definition." |
| Evidence and caveat | Executives can use caveated evidence. They cannot use overconfident guesses. | Source rows, filters, calculations, missing sources, and follow-up checks. | "Based on this file, the leading hypothesis is clear enough to discuss, but not final enough to treat as root cause." |
RFC 4180 is a useful reminder that CSV is simple only on the surface. Headers may or may not exist, field counts should stay consistent, and quoted fields can contain commas, line breaks, and escaped quotes. If the parser gets that wrong, the executive story gets built on shifted columns.
The meeting is where first-pass analysis either becomes useful or dangerous.
Say what the file supports. Say what you checked. Say what still needs proof.
| Unsafe wording | Meeting-safe wording |
|---|---|
| "The root cause is this segment." | "This segment is the largest visible contributor in the CSV. We need source-system context before calling it root cause." |
| "The campaign failed." | "The CSV shows campaign-attributed movement. We need spend, targeting, and conversion context before calling it a failure." |
| "Revenue dropped because region X failed." | "Revenue is lower in this period, and region X is the largest visible contribution in this file. We still need to confirm file completeness and metric rules." |
| "This proves the trend will continue." | "This file shows the current movement. Forecasting the next period needs a separate analysis." |
| "The dashboard is wrong." | "The CSV and dashboard appear to use different definitions or filters. We should reconcile them before choosing one number." |
This language is not timid. It is executive-safe. A first-pass audit can be punchy without pretending the file answered questions it did not answer.
Anomaly AI is an AI data analyst for large business datasets. For this workflow, the relevant fit is simple: upload a large CSV, ask a focused meeting question, inspect the logic behind the answer, and turn the output into something you can use in the room.
Supported upload formats include .xlsx, .xls, and .csv files up to 1GB. Anomaly also supports workflows around GA4, BigQuery, Google Sheets, MySQL, Snowflake, and other supported connectors.
For a pre-meeting audit, Anomaly can help you:
That does not make it a magic root-cause tool. The analyst still reviews the source data, generated logic, metric definitions, and caveats before presenting. The advantage is that the workflow is verifiable instead of trapped in a spreadsheet tab or a loose chat transcript.
For broader tool selection, see the AI tools for CSV analysis comparison. For Excel-specific workflows, see Excel data analysis with Anomaly AI.
Yes, if the dataset is ready, the meeting question is narrow, and the goal is a first-pass read. No, if the file needs exhaustive cleanup, cross-source reconciliation, modeling, or root-cause proof. A 15-minute audit is for finding the safest answer you can say now.
Check row count, column count, file completeness, headers, metric/date columns, missing values, duplicates, date window, grouping dimensions, top movers, and caveats. Do not start with charts. Start with whether the file can support the claim you want to make.
The common risks are truncation, bad parsing, inconsistent fields, missing values, duplicate rows or keys, the wrong date window, dirty grouping dimensions, unclear metric definitions, and business rules that are not visible in the file. Great Expectations frames data integrity around relationships, dependencies, business rules, cross-column consistency, and value dependencies; those are exactly the checks that keep a fast audit from becoming a confident wrong answer.
It depends on the file. Excel is convenient, but Microsoft documents worksheet limits of 1,048,576 rows by 16,384 columns and warns that oversized CSVs may not fully load. If you open a large CSV in Excel, cross-check the row and column counts and do not save over the original file if Excel did not load everything.
No. Anomaly AI helps you inspect data, review generated logic, define metrics, ask questions, and turn source-backed analysis into usable outputs. The final root-cause explanation still needs evidence and human review.
The goal of a 15-minute pre-meeting data audit is not to sound certain. It is to avoid being confidently wrong.
Use the quarter hour to narrow the question, check whether the CSV is safe enough, find the largest visible movement, and write the caveat before someone asks for it. If the file supports a claim, say it. If it only supports a hypothesis, say that too.
If you want a traceable workspace for large CSVs, dashboards, reports, and source-backed meeting prep, start with Anomaly AI.
Experience AI-driven data analysis with your own spreadsheets and datasets. Generate insights and dashboards in minutes with our AI data analyst.
Technical Product Manager, Data & Engineering
Ash Rai is a Technical Product Manager with 5+ years of experience building AI and data engineering products, cloud and B2B SaaS products at early- and growth-stage startups. She studied Computer Science at IIT Delhi and Computer Science at the Max Planck Institute for Informatics, and has led data, platform and AI initiatives across fintech and developer tooling.
Continue exploring AI data analysis with these related insights and guides.
A practical CSV upload recovery workflow for file size, encoding, delimiters, headers, malformed rows, validation, and safe re-upload.

A precise guide to the five advanced Excel workflows where Anomaly AI is faster than pivot tables, and where Excel still wins.

A workbook-safety workflow for analyzing .xls and .xlsx files with AI: sheets, headers, formulas, hidden data, sensitive fields, and source-backed outputs.