
DATA ANALYSIS
How to Recover When Your CSV Upload Fails
A practical CSV upload recovery workflow for file size, encoding, delimiters, headers, malformed rows, validation, and safe re-upload.
A practical CSV upload recovery workflow for file size, encoding, delimiters, headers, malformed rows, validation, and safe re-upload.

A precise guide to the five advanced Excel workflows where Anomaly AI is faster than pivot tables, and where Excel still wins.

A workbook-safety workflow for analyzing .xls and .xlsx files with AI: sheets, headers, formulas, hidden data, sensitive fields, and source-backed outputs.

A practical no-Python workflow for analyzing a 1GB CSV when Excel freezes, truncates, or crashes, with file checks, source-backed calculations, and exportable outputs.

A safe people analytics prompt library for querying aggregate HR data: headcount, attrition, hiring, workforce costs, data quality, and executive caveats.

Run a focused 10-minute HR audit before a board meeting: headcount, attrition, hiring, workforce costs, privacy caveats, and safe wording.

Run a manufacturing tender margin leak analysis before pricing, bid/no-bid, or margin review meetings with a cost-driver matrix and safe wording.
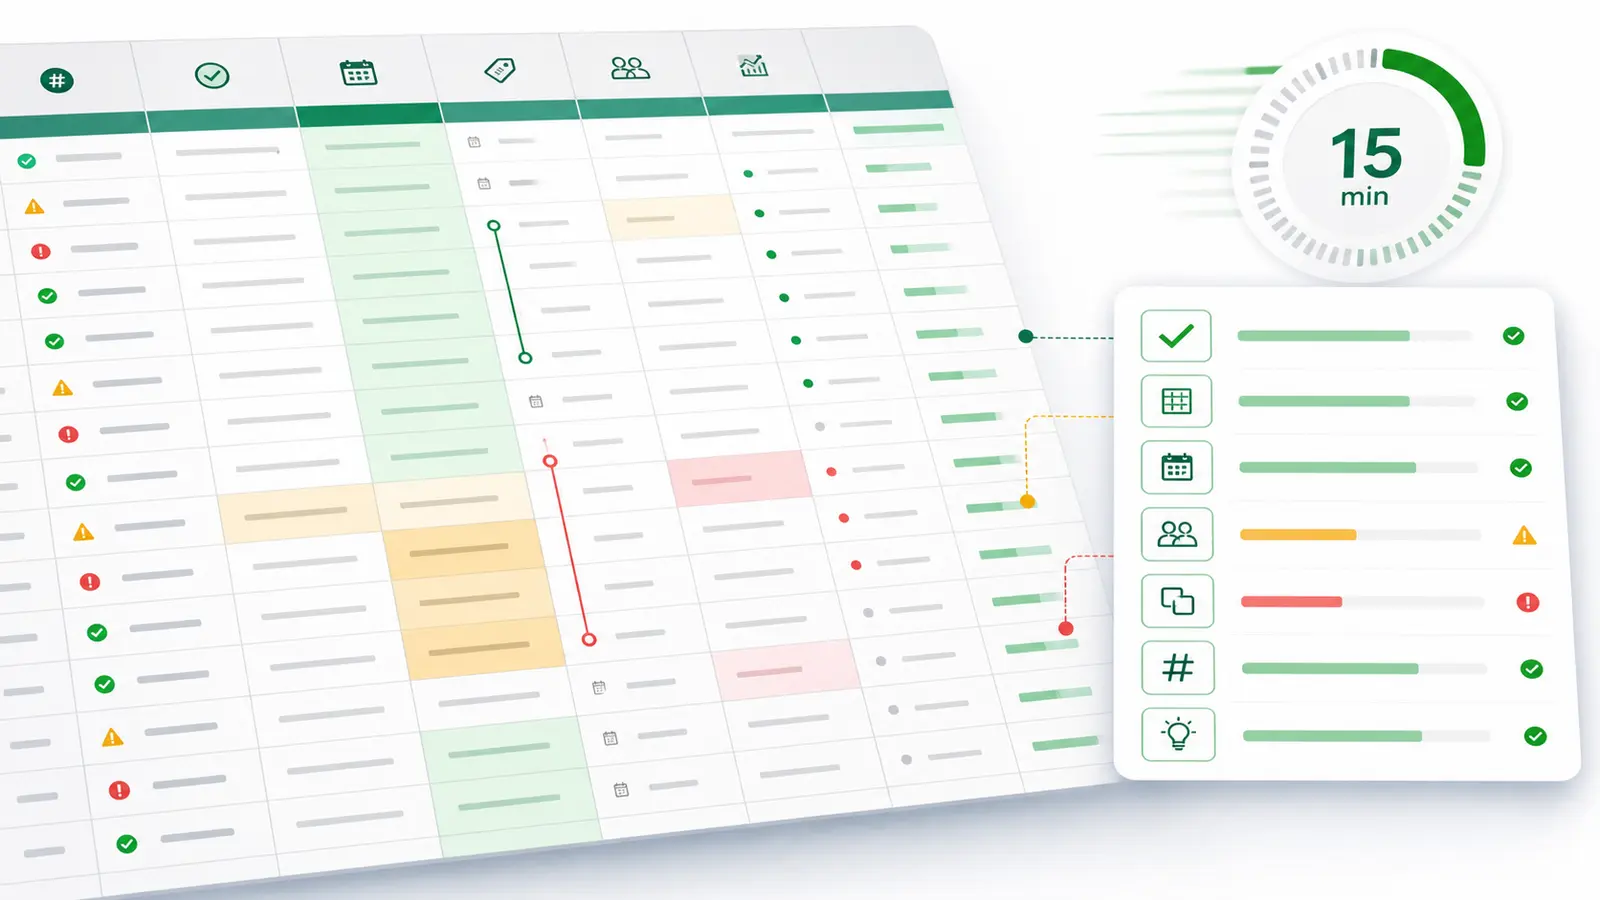
A focused 15-minute workflow for auditing a large CSV before an executive meeting: schema, missing values, duplicates, top movers, and safe caveats.

A working CSV analysis guide for 2026 — inspect, clean, validate, and analyze CSV files with SQL, with the honest take on where AI helps and where it fails.

Discover the top data analysis tools in 2026. Compare Excel, Tableau, Power BI, Python, R, and AI-powered platforms. Expert analysis of features, pricing, and use cases to help you choose the right analytics tools for your organization.

Learn proven Excel analysis techniques from a data engineering expert. Master data analysis tool excel with formulas, pivot tables, and charts. Includes real-world examples, expert tips, and when to upgrade to AI data analyst tools for large datasets.

Master Excel's quick analysis tool to transform raw data into insights in seconds. Learn how quick analysis tool excel can save you 80% of data analysis time with conditional formatting, charts, totals, tables, and sparklines—all with a single click.

Three approaches to visual database analysis in 2026: raw SQL + charting, traditional BI platforms, and AI agents that turn database questions into dashboards and visual analysis.