Tools & Comparisons
12 min
Best Tableau Alternatives for Small Teams in 2026
Leaving Tableau as a small team? Match the replacement to which part of Tableau you keep and which cost, setup, or specialist burden you are trying to shed.
Read More
Tools & Comparisons — Accuracy test · 2026
We gave ten AI tools, including ChatGPT, Claude and Julius AI, the same sales data and checked every answer for accuracy.
 19 min read
Quick answer — which tool should you try first?
Start with Anomaly AI or Deepnote. Both connect to Excel files, databases and many other data sources, and both got all four tasks right in our test. Anomaly AI (our product) did it on the Free plan and shows the SQL and Python behind each answer. Deepnote gives you a notebook you can edit and rerun; we tested its paid Team plan.
Which AI data analyst is the most accurate and reliable? The best way to find out is to give each tool a question you already know the answer to. We asked ten tools, from ChatGPT and Claude to Julius AI, Deepnote and our own Anomaly AI, to analyze the same sales and returns data: calculate totals, compare product categories and regions, and create a monthly chart. We checked every answer against calculations made from the source data, then looked at whether the results were useful outside the chat. This page reports what each tool actually did with that data; if you want a broader guide to choosing an AI data analysis tool by team and data source, our comparison of 10 AI data analysis tools covers that question.
The test data was a sales and returns dataset built from the public AdventureWorks sample, with six related tables covering sales, returns, products, product categories and sales regions. We gave it to each tool as a single spreadsheet upload, except ThoughtSpot, which received the same tables as separate CSV files because its spreadsheet route was unavailable in our account. What the test really measures is whether a tool can work across related tables without double-counting, which is the same problem you meet whenever your data comes from more than one source.
Disclosure: Anomaly AI is our product. Our team conducted these tests. The table compares observed results and workflow fit.
On smaller screens, scroll horizontally → · Keyboard: focus the table, then use the arrow keys.
| Tool | Recorded rating /25 | Price · verified 8 Oct 2026 | Learns your business definitions | Verifiability | What happened in our test |
|---|---|---|---|---|---|
| Deepnote | 24/25 Provisional |
Free; Team $39/editor/mo annual or $49 monthly | Definitions your team publishes, plus your instructions | Yes — editable code | All four tasks completed, values correct, table and chart exports |
| Anomaly AI | 24/25 Provisional |
Free; Pro $25/mo; Team $45/seat/mo | Yes, automatically recalls your past work and saved definitions | Yes — calculations and checks | All four tasks completed, reference totals correct, one date error, data export |
| Claude | Under review Explanation and code defects |
Free; Pro $20/mo or $17/mo annual | Memory, plus project instructions | Partial — code omits a displayed category | All four tasks completed, core totals correct, explanation and code defects, downloadable HTML brief |
| ChatGPT | 23/25 Provisional |
Free; Plus $20/mo | Memory, not guaranteed to keep everything | Yes — formulas and code | All four tasks completed, reference totals correct, one date error |
| Julius AI | 23/25 Provisional |
Free; Plus $20/mo | Learns on connected databases only | Partial — code defect | All four tasks completed, values correct, one code defect |
| Better Analyst (Formula Bot) | 21/25 Separate self-score |
Free; Starter $20/mo ($10 first month) | Relies on definitions you set up | Partial — exports checked; code not rerun | All four tasks completed, checked values correct, cleaning failed |
| Google Gemini | 20/25 Provisional |
Tested plan not shown; Google AI Pro $19.99/mo | Memory once switched on, plus instructions | Yes — “Show code” | Three of four tasks completed, returned values correct |
| ThoughtSpot | 16/25 CSV-only editorial rating |
Pro from $50/user/mo annual; usage-based option | Yes, learns definitions you teach it | Partial — conflicting code | Six CSV files: all four requests answered, with errors in the code and written findings |
| Amazon Quick | 11/25 Provisional |
Free; Plus $20/user/mo annual or $25 monthly | Only definitions an author or admin sets up | No — full data unavailable | Four responses, none of which fully answered the task |
| Hex | Not assessed Original upload failed |
Community free; Professional $36/editor/mo | Only definitions an admin or manager sets up | No — original upload failed | Our test file failed to upload, which blocked the first request, and the other three were not attempted. Tests with different files worked. |
How to read the results: compare the workflow, completed tasks, checks and failures alongside the recorded ratings. Each total originally added five 0–5 judgments: correctness, data handling, output usefulness, verifiability, and cost and access. Claude's overlooked errors still need a consistent regrade. The equal 24/25 totals for Anomaly and Deepnote do not establish equal accuracy. A successful result on this dataset does not establish accuracy on other data.
This comparison asks whether a tool can answer questions correctly and show enough working to check them. For a chart-first choice, see our AI data analysis and visualization guide; dashboard appearance and sharing are a different decision.
If your work lives mainly in spreadsheets or CSV exports, our Excel AI tools guide and CSV analysis tools guide cover those narrower workflows in more depth.
Anomaly AI and Deepnote suit different ways of working. Anomaly AI brings answers, charts and checking instructions together in a project. Deepnote provides an editable notebook for analysts who want control over the code. Both completed our core tasks, but separate cleaning tests exposed weaknesses in each.
On smaller screens, scroll horizontally →
| Tool | Workflow fit | Observed strengths | Observed weaknesses |
|---|---|---|---|
| Anomaly AI | Review answers and charts together in one project | Four requests completed; requested totals correct; calculation checks and a data export on the tested Free account | A separate messy-data test returned 43,506 units instead of 45,314. |
| Deepnote | Inspect, edit and rerun analysis code | Correct core results; editable notebook, validation checks, table and chart exports in the selected run | Tested on a paid Team account. A separate messy-data test retained duplicates: 45,755 units instead of 45,314. |
Download a report you can reopen outside the chat.
Claude Free produced a saved webpage; public sharing was unavailable.You already use ChatGPT and want the results in Excel.
ChatGPT Free produced an Excel summary with a formula and chart.You need a PDF report you can pass on.
Julius Free produced a two-page PDF; we also hit its daily credit limit.You want to use Google's chat app for data questions.
Gemini completed three of four tasks; we could not confirm the account's plan.You want to ask questions about CSV data.
ThoughtSpot answered our questions, but its code and written findings contained errors.Your data is clean and you need downloadable charts.
Better Analyst exported charts, but mishandled duplicates and dates in the separate cleaning test.Whatever tool you shortlist, test it on your own data before you rely on it. Success with converted files does not prove that a tool can handle a file with several related tables, and these file-upload tests do not show how a tool performs when it is connected directly to a database or data warehouse.
We compare correctness, data handling, useful outputs and access to the calculations, with prices and tested accounts shown alongside the results. The overview retains recorded provisional ratings where no new grade is assigned, while Claude is under review and Hex's analysis of our test file could not be assessed. The historical evidence preserves the earlier assessments; this is not a controlled accuracy leaderboard. Correct numbers, careful joins, usable outputs and visible working matter just as much for an AI analytics platform connected to live data as for a chat assistant reading an uploaded file, although every tool here was tested with an uploaded file.
On 7–8 October 2026, four browser requests covered inspecting the dataset, sales summaries, category return rates, and a monthly chart with supported findings, checks and an export.
Did the numbers and explanations match the source data?
Did it read every table and join records without double-counting?
Were the tables, chart, summary and export usable?
Could another analyst inspect the calculations and repeat the checks?
Could the account finish the job, with understandable costs?
Our six-table dataset contains 56,046 sales rows and 1,809 return rows. We checked against source calculations, totaling sales and returns separately to avoid double-counting. The data has no transaction sale prices or July–December 2017 records; neither revenue nor zero sales for those missing months can be inferred.
Retries and accounts: the comparison uses 7 October runs for Anomaly, Claude, ChatGPT and Julius, and 8 October retries for Deepnote, Gemini, Quick and Hex. Earlier failures remain recorded: troubleshooting success is not first-attempt success. Plans and models differed, including Free accounts, Deepnote Team, and Quick and Hex trials. Testers knew the expected answers during retries. Selected runs do not establish repeatability.
Additional tests: messy data, larger files, refresh and export tests sometimes used paid plans and are reported separately from the main results. ThoughtSpot used converted CSVs, and Better Analyst's main test was a later run; these differences limit direct comparisons.
The evidence page contains the file identifier, exact questions and reference answers, plus additional-test details. The assembled test file is not publicly redistributed; raw logs are available only to reviewers.
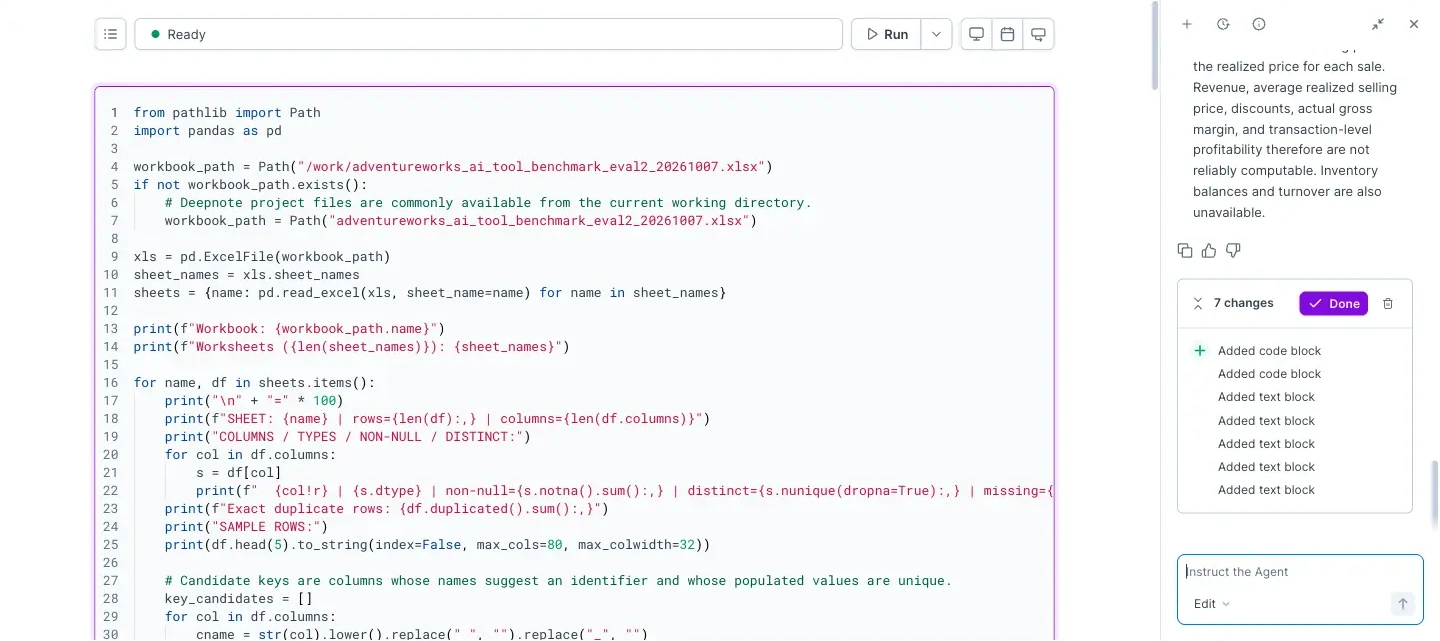
Working in an existing Team workspace, we got correct answers to all four requests from Deepnote. It kept code, explanations and a chart together in a notebook—a document where an analyst can edit and rerun the calculations. It also generated checks, an executive summary, a downloadable table and a chart image.
The upload that worked went through the project's Files sidebar, after an earlier way of uploading failed; we did not establish Free-plan access to this workflow. In the separate messy-data test, it counted duplicate sales, adding 441 extra units: 45,755 rather than 45,314. Choose the notebook for review and editing, not as a guarantee that cleaning was correct.
Price — verified 8 October 2026: Free; Team $39/editor/month billed yearly or $49 billed monthly.
See and edit the code that reads the data
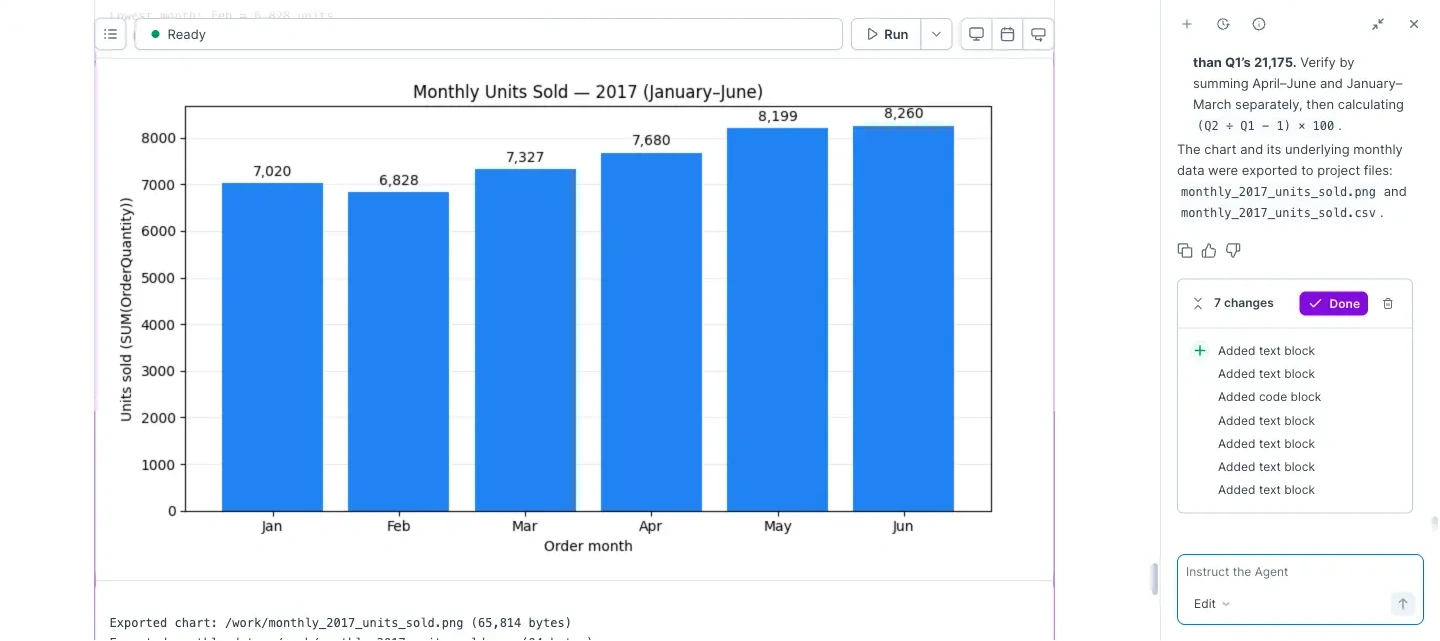
The chart and its six checked monthly values stay beside the analysis
Anomaly AI's production Free plan completed all four requests and matched the requested reference totals. It kept findings, charts, calculations and a downloadable data file in one project. That makes it worth considering when you want to review an answer without moving between separate files.
It connected the six tables, warned against double-counting sales and returns, and refused to treat a product's catalog price as actual revenue. Its working was visible as SQL queries and Python analysis code. But it misstated the returns data's date range as ending on 6 December 2017 instead of 30 June 2017, and a separate deliberately messy-data test returned 43,506 units instead of the correct first-half total of 45,314. Check cleaning separately even when the clean-file answers match.
Price — verified 8 October 2026: Free; Pro $25/month; Analyst $90/month; Team $45/seat/month with a two-seat minimum.
A chart with findings and instructions for checking the numbers
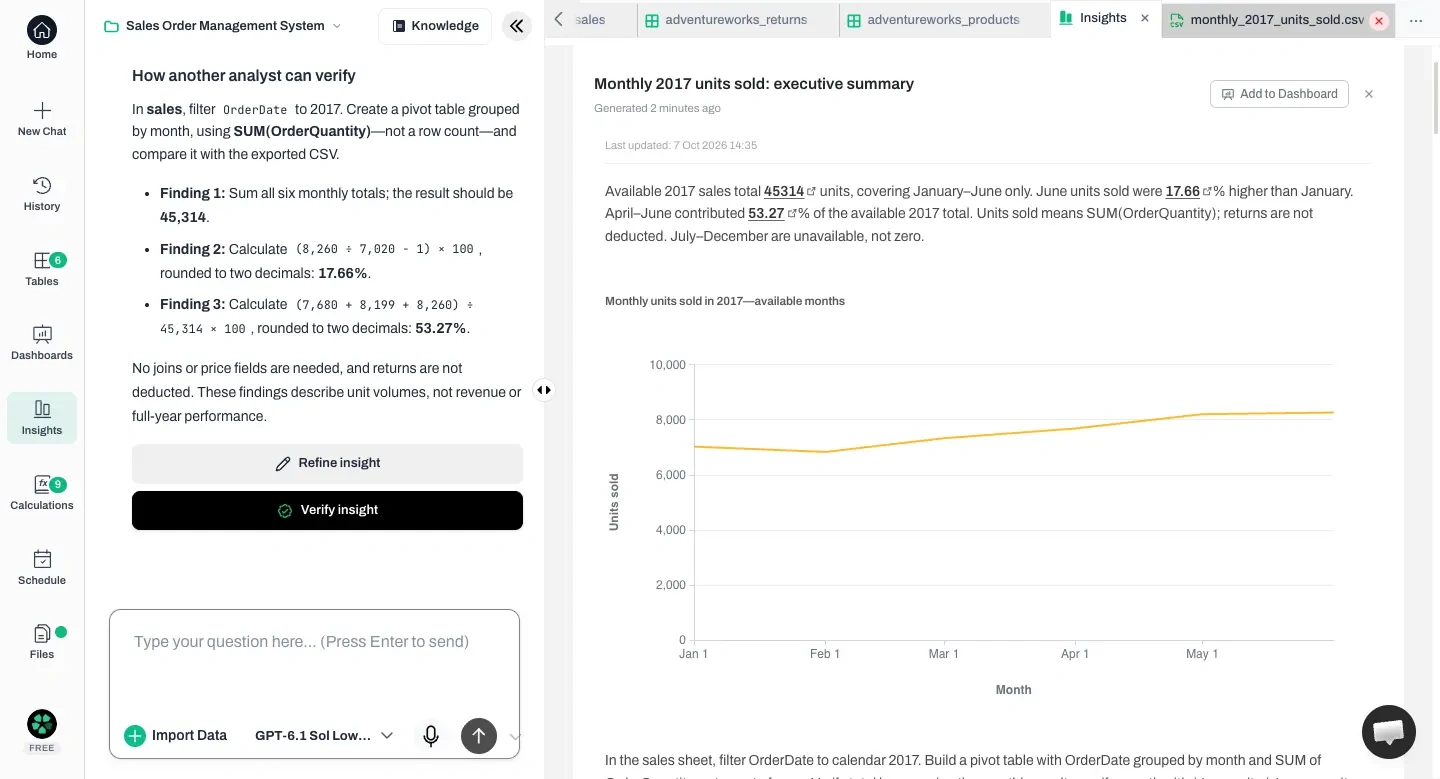
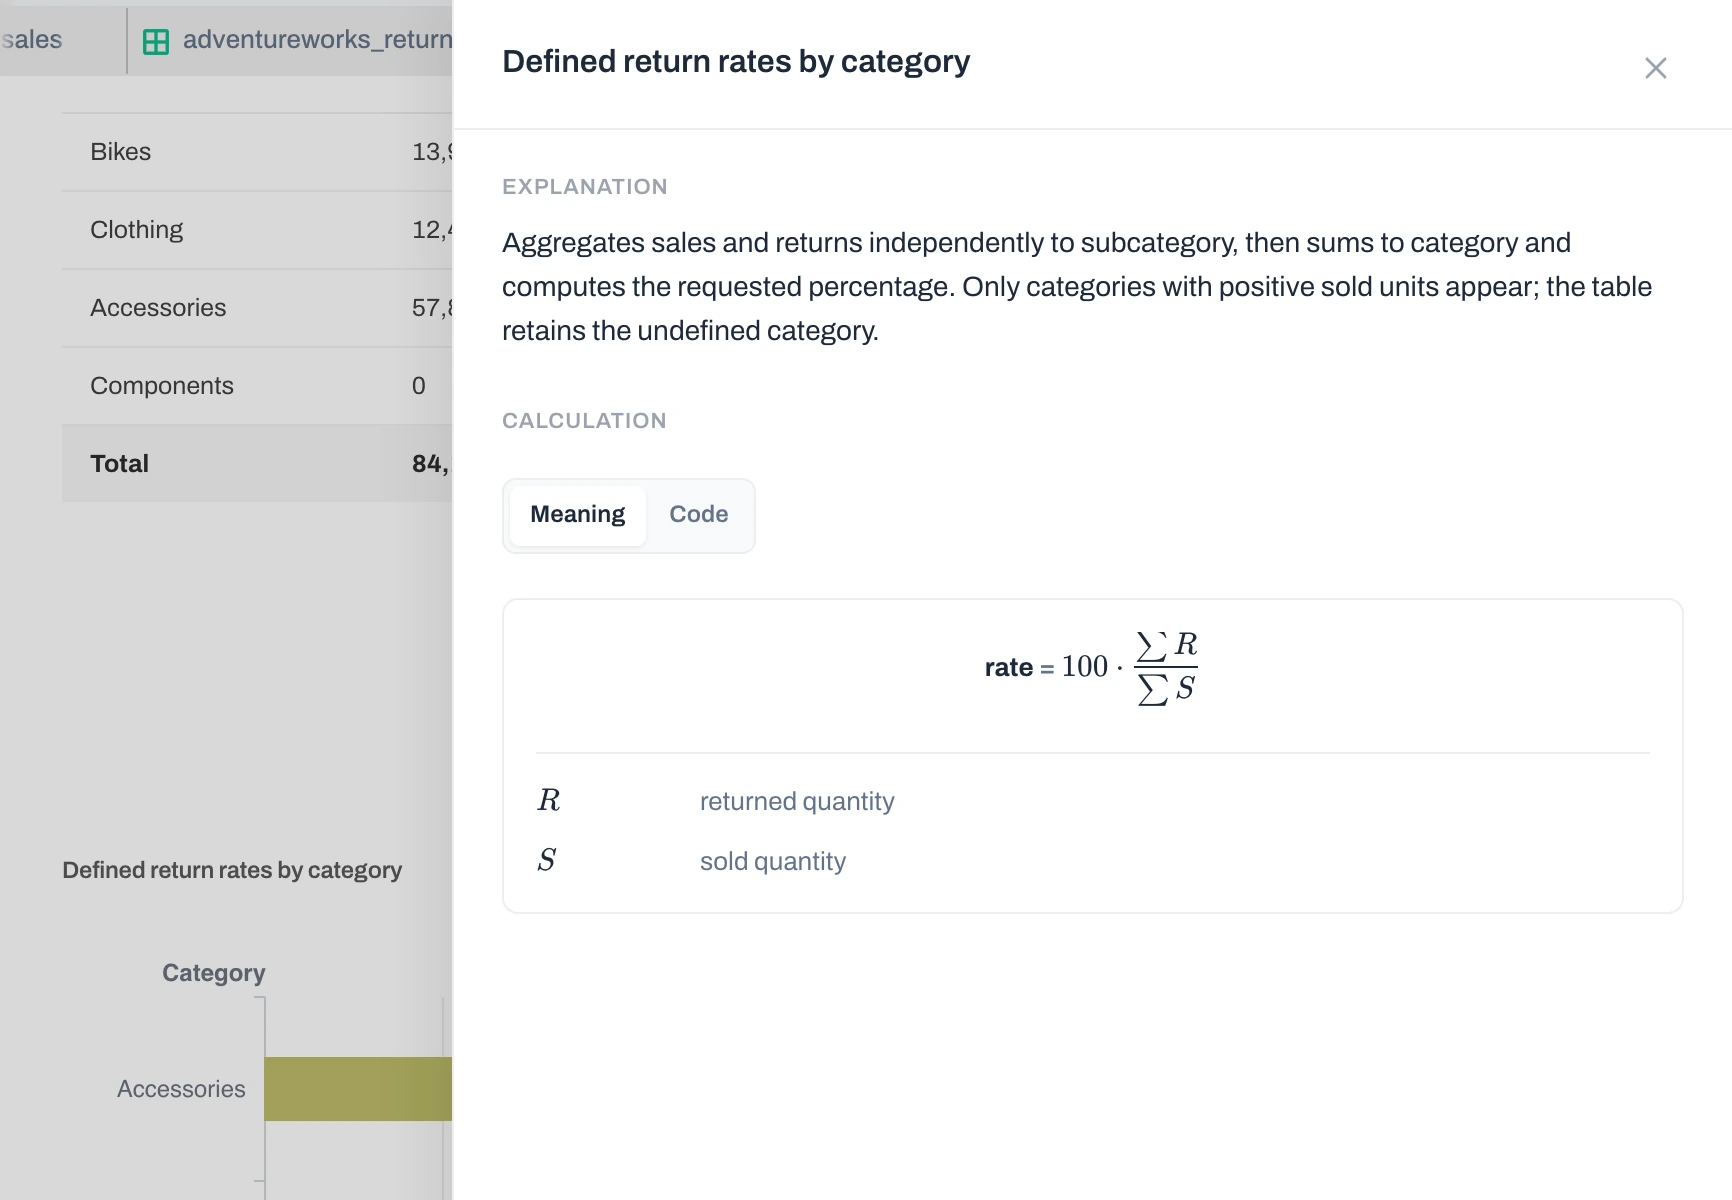
Anomaly AI showed the return-rate calculation as a formula
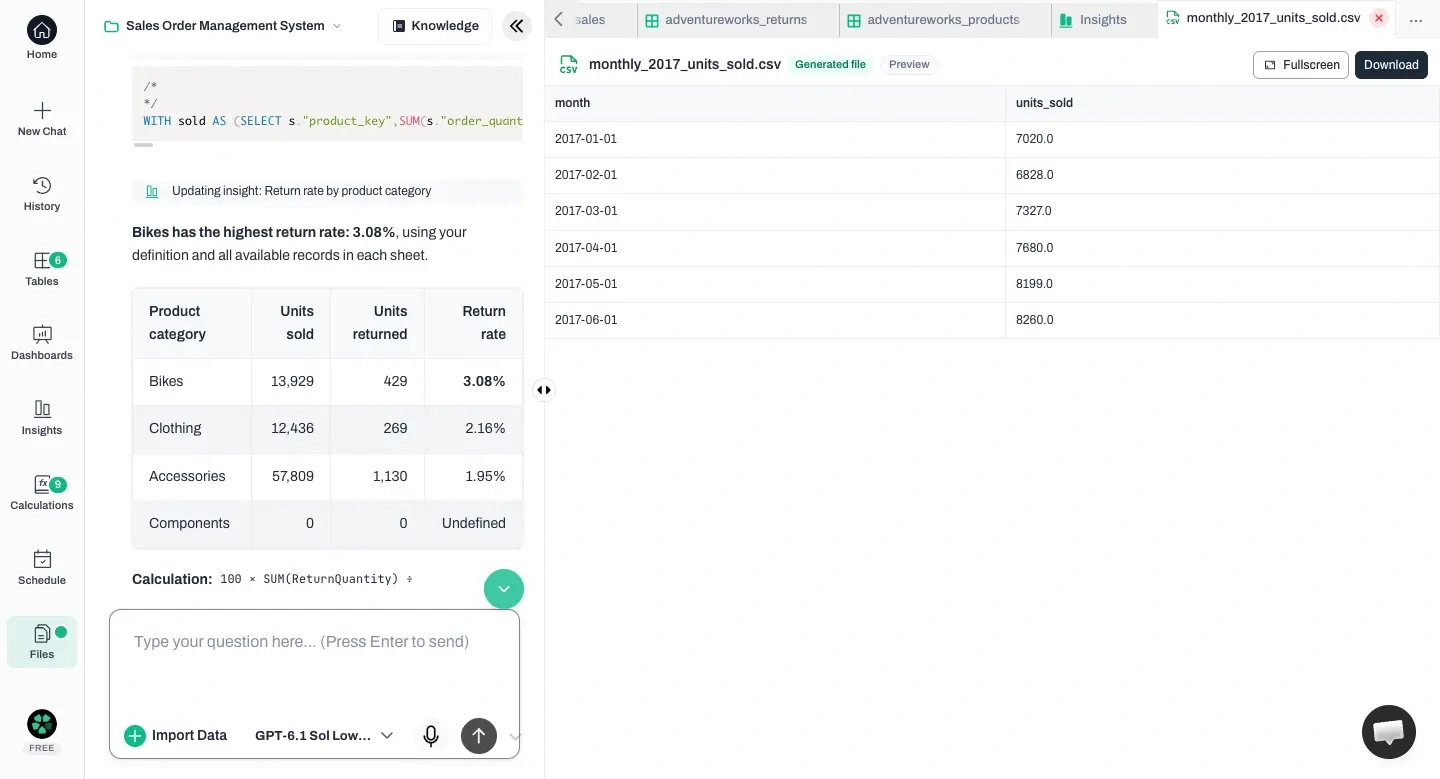
Download the monthly numbers, not just a picture of the chart
Claude completed our four requests with correct core totals and a downloadable brief on the Free account we tested. The 5.7 KB HTML brief was a small webpage we could download and reopen locally. Public sharing was unavailable, but the saved brief suited a one-off analysis you want to keep outside the chat.
Claude totaled sales and returns separately, kept the zero-sales Components category, and explained why revenue could not be calculated. It also supplied checks. The interface showed “Sonnet 5.5 Medium”; that is the recorded label, not an independently verified backend model.
Explanation and code limits: Claude said its Bikes and Clothing uncertainty ranges “barely overlap,” although its own numbers—2.81–3.38% and 1.92–2.43%—do not overlap. Its category table included zero-sales Components, but the accompanying SQL and Python would omit that row when run unchanged. Correct totals did not make every explanation or checking step correct.
A separate Pro-account test removed duplicates and handled mixed date formats, reaching the correct 45,314-unit first-half total. Its Excel and PowerPoint exports each contained six native chart objects—editable charts rather than pictures. Those paid-plan results do not establish what the Free tier can do.
Price — verified 8 October 2026: Free; Pro $20/month, or $17/month on the annual plan ($200 upfront); Max starts at $100/month.
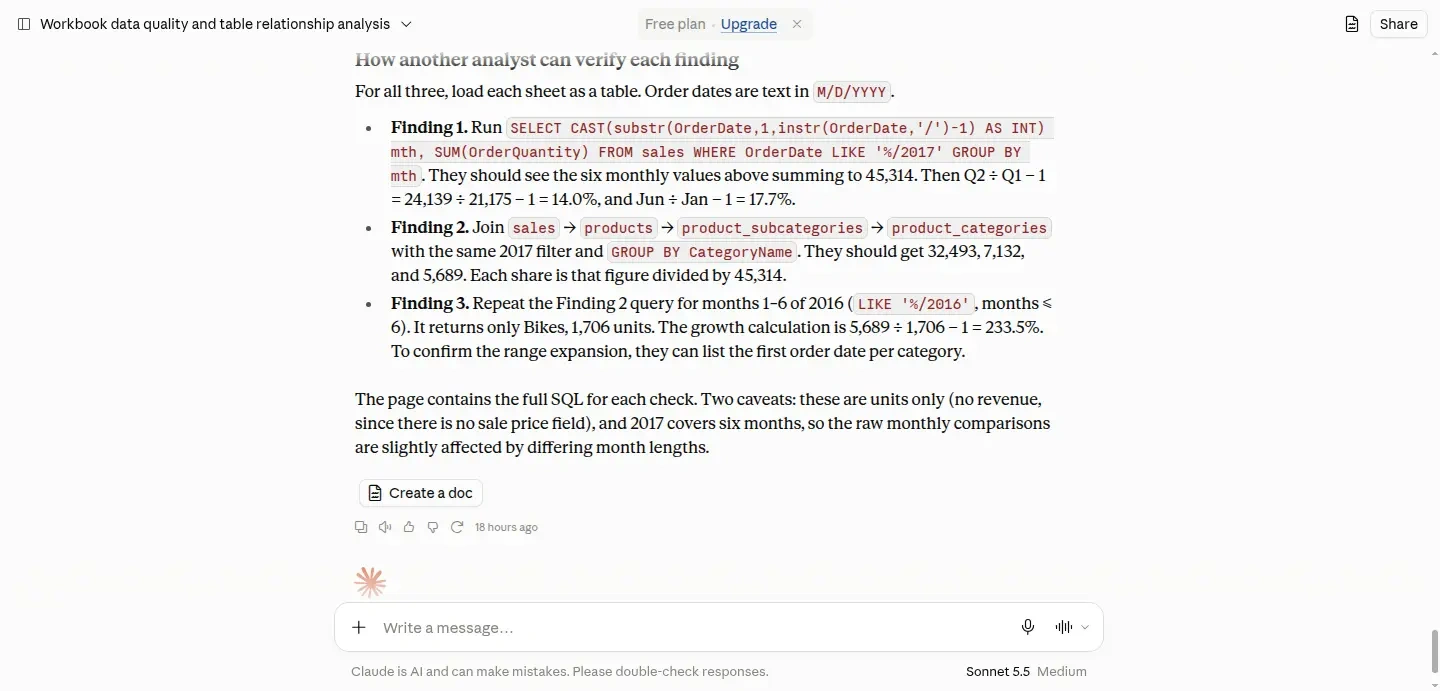
Claude showed how to check each finding against the source tables
The Free ChatGPT account we tested answered all four requests and matched every reference number. It generated an Excel workbook with a working formula, a chart, findings and checking instructions, so if you already use ChatGPT and want a summary you can keep working in, this was a genuinely useful output rather than just a chat answer.
It showed SQL and pandas, a Python tool for working with tables. It correctly identified missing July–December data and unavailable revenue. But it misstated the StockDate column's range as 2002–2003 instead of September 2001–June 2004; a separate retry also stopped incomplete.
The additional tests show why checking still matters. Duplicate sales inflated the first-half total to 45,755 instead of 45,314 units. On a 616,506-row file, component totals were correct but the written grand total was 1,025,155 instead of 925,914. The shared Free account also hit a daily analysis limit. Check the written summary as well as the tables.
Price — verified 8 October 2026: Free; Plus $20/month, confirmed in OpenAI's Help Center. The pricing page did not expose a USD amount in the checked session.
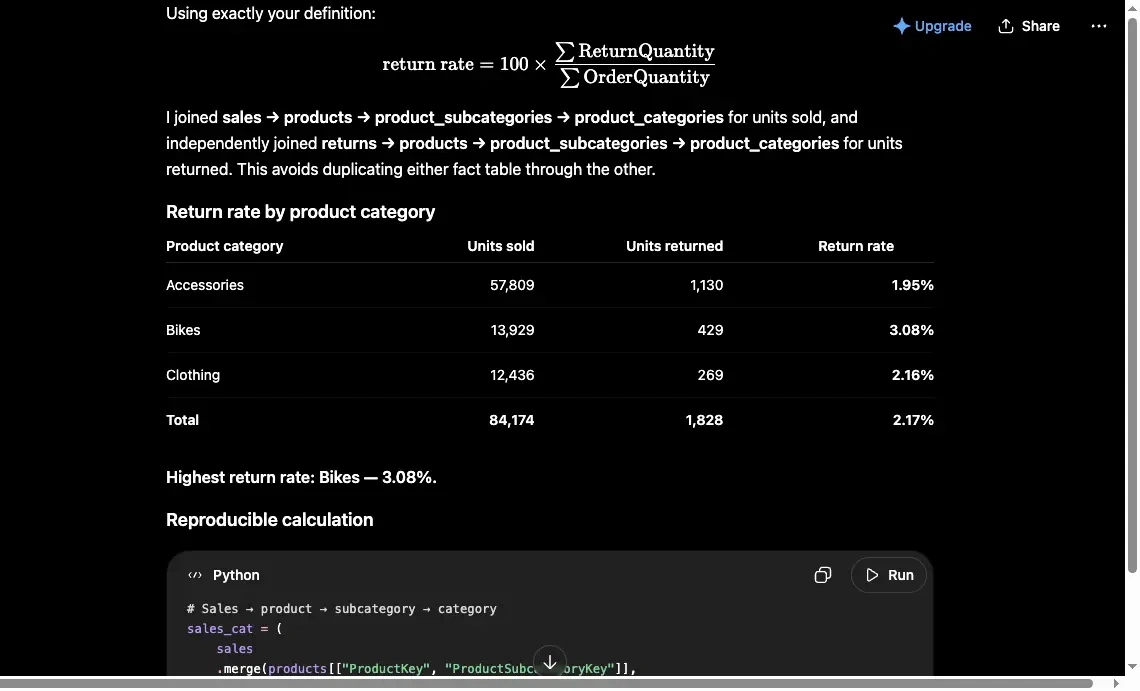
ChatGPT showed which numbers it divided and how it calculated the return rate
On the Free account we tested, Julius AI matched every requested value across all four responses. It produced a chart, an executive summary and a two-page PDF. That fits a one-off analysis you want to read or pass on without editing a notebook.
Julius handled the data safely and explained the return-rate limits, but the displayed code was not fully reusable. Its float("") expression tries to turn an empty value into a number and raises a Python ValueError. The snippet could not run unchanged despite the correct displayed answers.
The original test exhausted its 25-credit daily allowance. A separate attempt also ran out before messy-data and large-file checks, leaving those capabilities untested, not failed. The interface's “Julius 1.2 Lite” label was recorded, not independently verified as a backend model.
Price — verified 8 October 2026: Free; Plus $20/month; Pro $45/month, billed monthly.
Julius AI's final monthly table and the uploaded data
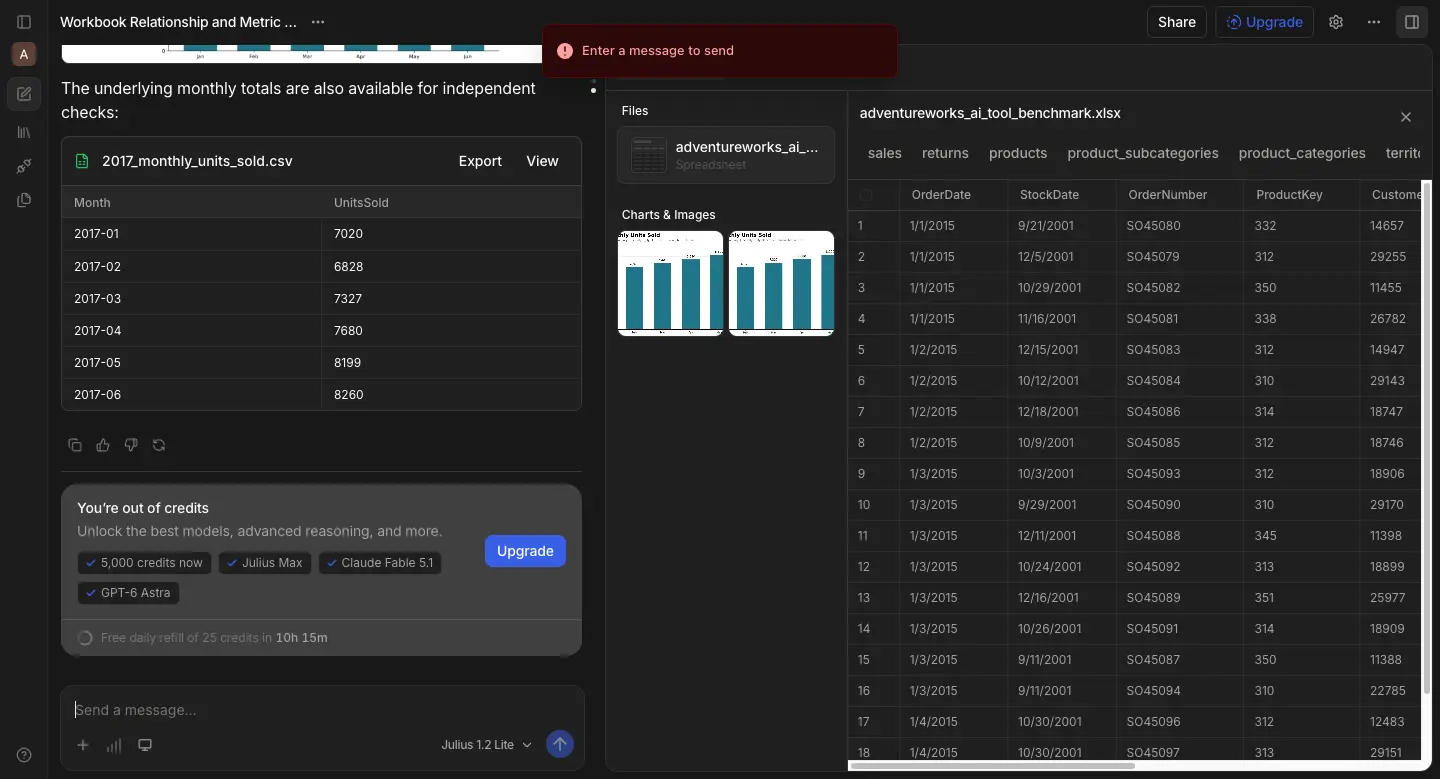
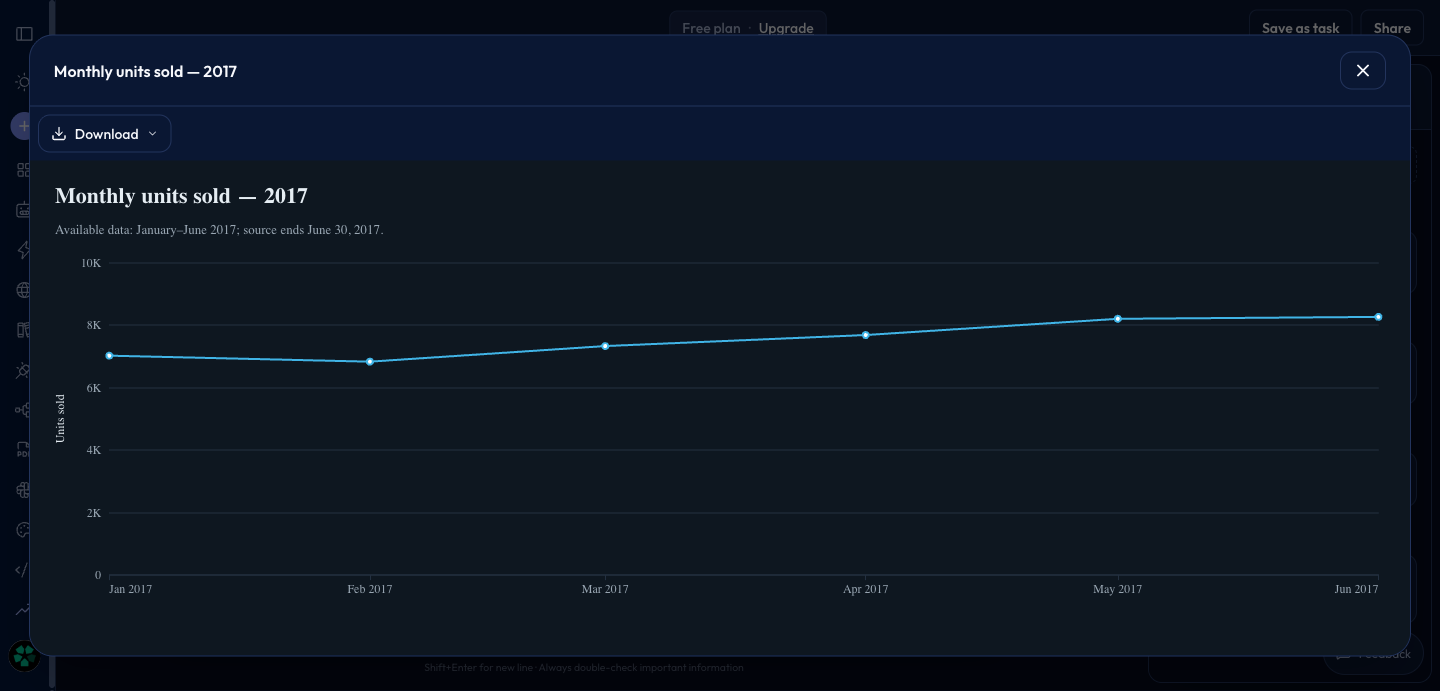
Better Analyst (Formula Bot) read all six tables and completed all four requests in our later Free/Base Model test. It correctly reported 84,174 total units and matched the six monthly chart values. It refused to invent revenue and exported a data table and an SVG chart image; a temporary chart error recovered automatically.
It is worth considering for questions about clean data and for downloadable charts, but cleaning needs a separate check. The messy test file returned 45,755, then 44,427 after one fixed retry, against the correct 45,314. It first retained duplicate sales, then excluded valid dates written in different formats. The Free plan's limits of one file per chat and 5 MB per file blocked our second-file and large-file tests; those are access limits, not calculation failures.
Checking limits: explanations of how tables were combined and exported values helped checking; we did not rerun the full code unchanged. Testers knew the expected answers.
We tested it and checked prices on 8 October 2026. Plans: Free; Starter $20/month ($10 first month). We did not test paid capabilities.
Better Analyst's exported chart values matched the source data
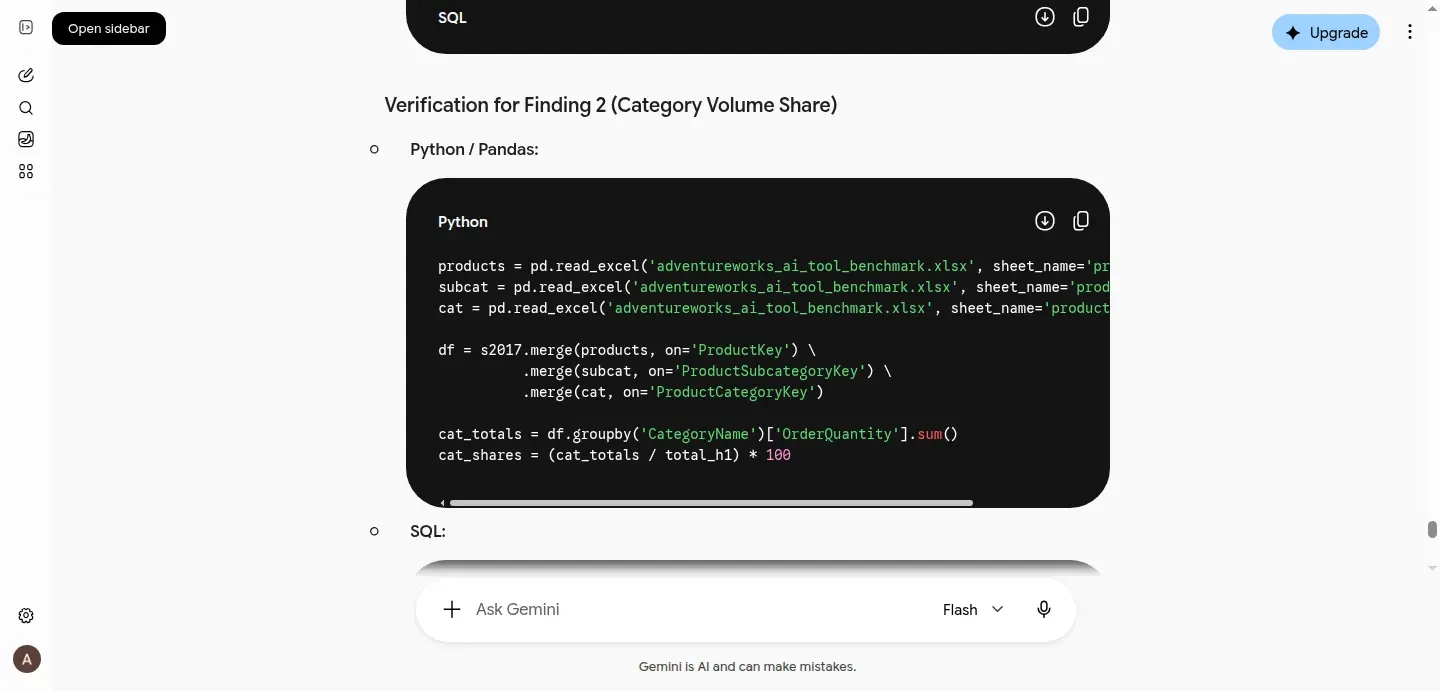
One request failed, but Gemini's standalone web app completed the other three on the personal account we tested; its exact plan was not shown. It accepted our test file without any conversion. The completed answers had correct year, category, region, return-rate and monthly numbers at the precision shown.
For someone already using Google's chat app, the correct in-chat chart and checking instructions were useful. However, the first request ended in an error despite code showing that file inspection had run. It also generated a downloadable file whose chart preview was unusable. The missing answer and an unsupported financial-impact statement were material limitations; successful background code did not count as a completed response.
Price — verified 8 October 2026: Google AI Pro was listed at $19.99/month. We could not confirm whether that was our account's plan.
Gemini showed the code connecting products to their categories
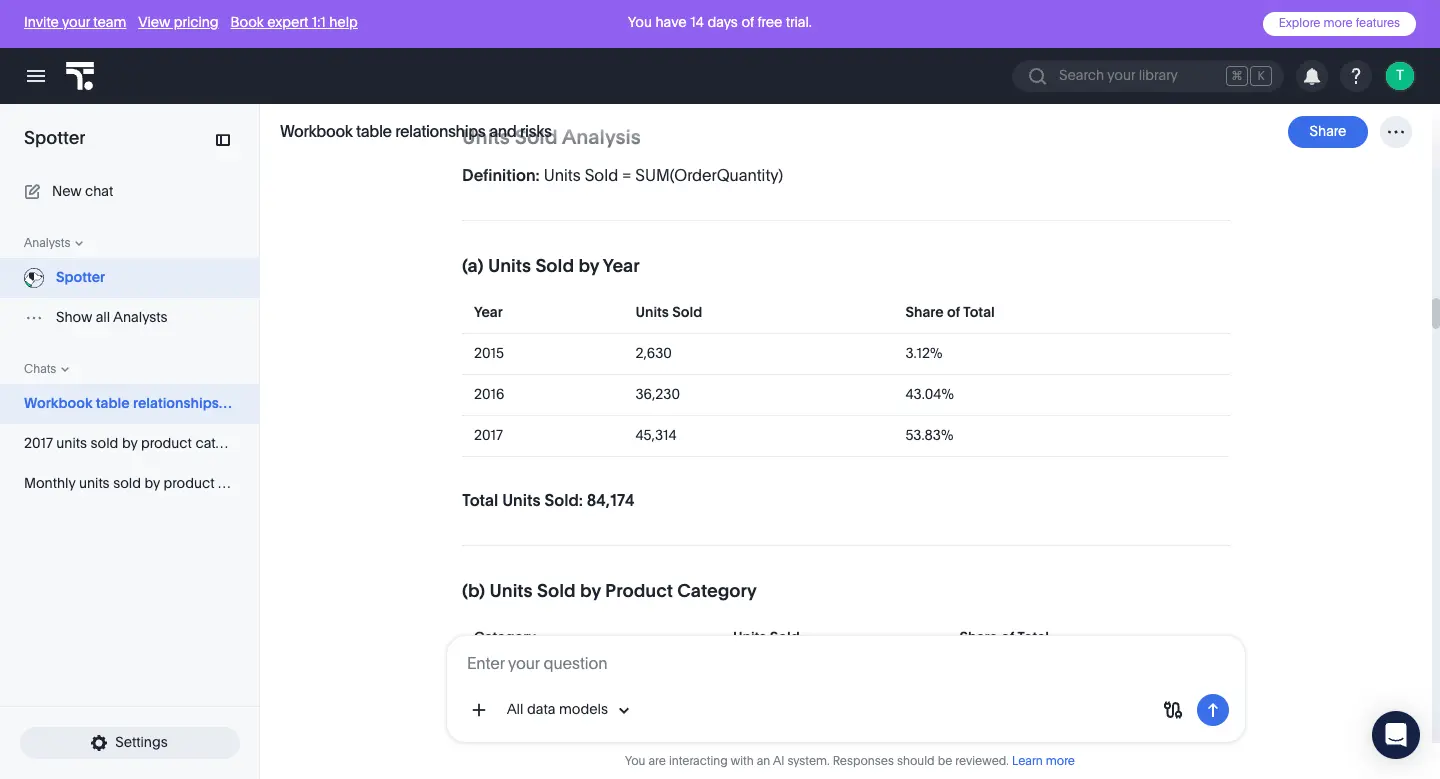
We tested ThoughtSpot's trial using six CSV files converted from our test file. It answered all four requests and returned correct core totals, but its code examples and written conclusions contained errors. If you want conversational CSV analysis, distinguish a correct displayed total from code that actually reproduces it.
Its code combined individual sales and returns rows in a way that would count units repeatedly. That SQL would yield a 100.57% Bikes return rate instead of 3.08%. Its April–June versus January–March growth headline said 27.9% rather than 14.0%; this differs from comparing January with June alone. In a separate messy-data test, duplicate sales inflated the first-half total to 45,755 instead of 45,314 units (+0.97%).
The original chart stayed blank. A later chart appeared only after browser-level display workarounds, so we have not verified normal chart rendering. Converting the data also does not establish that ThoughtSpot can handle the original multi-table file. These are material limits, not reasons to dismiss every ThoughtSpot workflow.
We tested CSVs after restoring account access because Analyst Studio, the documented Excel route, remained disabled on 8 October. Its message said: “Analyst Studio unavailable. Contact your org admin to know more.” ThoughtSpot documents XLSX support, but our account could not use it.
CSV-only assessment: these observations do not establish Excel support. Separate cleaning and chart-workaround tests are described in the access findings.
The 5 MB limit applies to Spotter chat attachments, not every upload route. Excel analysis through Analyst Studio and documented Liveboard/Answer exports remain untested. Price — verified 8 October 2026: Pro starts at $50/user/month billed annually; usage-based pricing is also offered. This does not identify our trial's commercial edition.
ThoughtSpot's yearly totals from six converted CSVs
Four responses did not add up to a completed analysis with Amazon Quick: none fully answered the task on our trial account. Its Space marked our file Ready, yet the analysis could access only passages and samples rather than complete tables. A file appearing uploaded did not mean the tool could calculate from all its rows.
Quick initially described a “complete picture” and wrongly treated the catalog's ProductPrice as an actual sale price. It later acknowledged the incomplete data. No requested totals series was calculated, the returns sample was wrong, and its final chart assigned zero to all twelve months instead of showing the six available values.
We would not choose this tested upload route for a complete analysis of an uploaded file. Its suggested queries and later warning were useful, but not substitutes for calculated answers. This was Quick Space, not Quick Sight's business-intelligence authoring workflow. The upload said “added 15 hours ago” when we revisited it; that does not establish a 15-hour processing time.
Price — verified 8 October 2026: Free; Plus $20/user/month billed annually or $25 billed monthly; Max $100/user/month billed annually or $125 billed monthly. Quick Sight was not tested.
A chart was produced, but every month was incorrectly set to zero
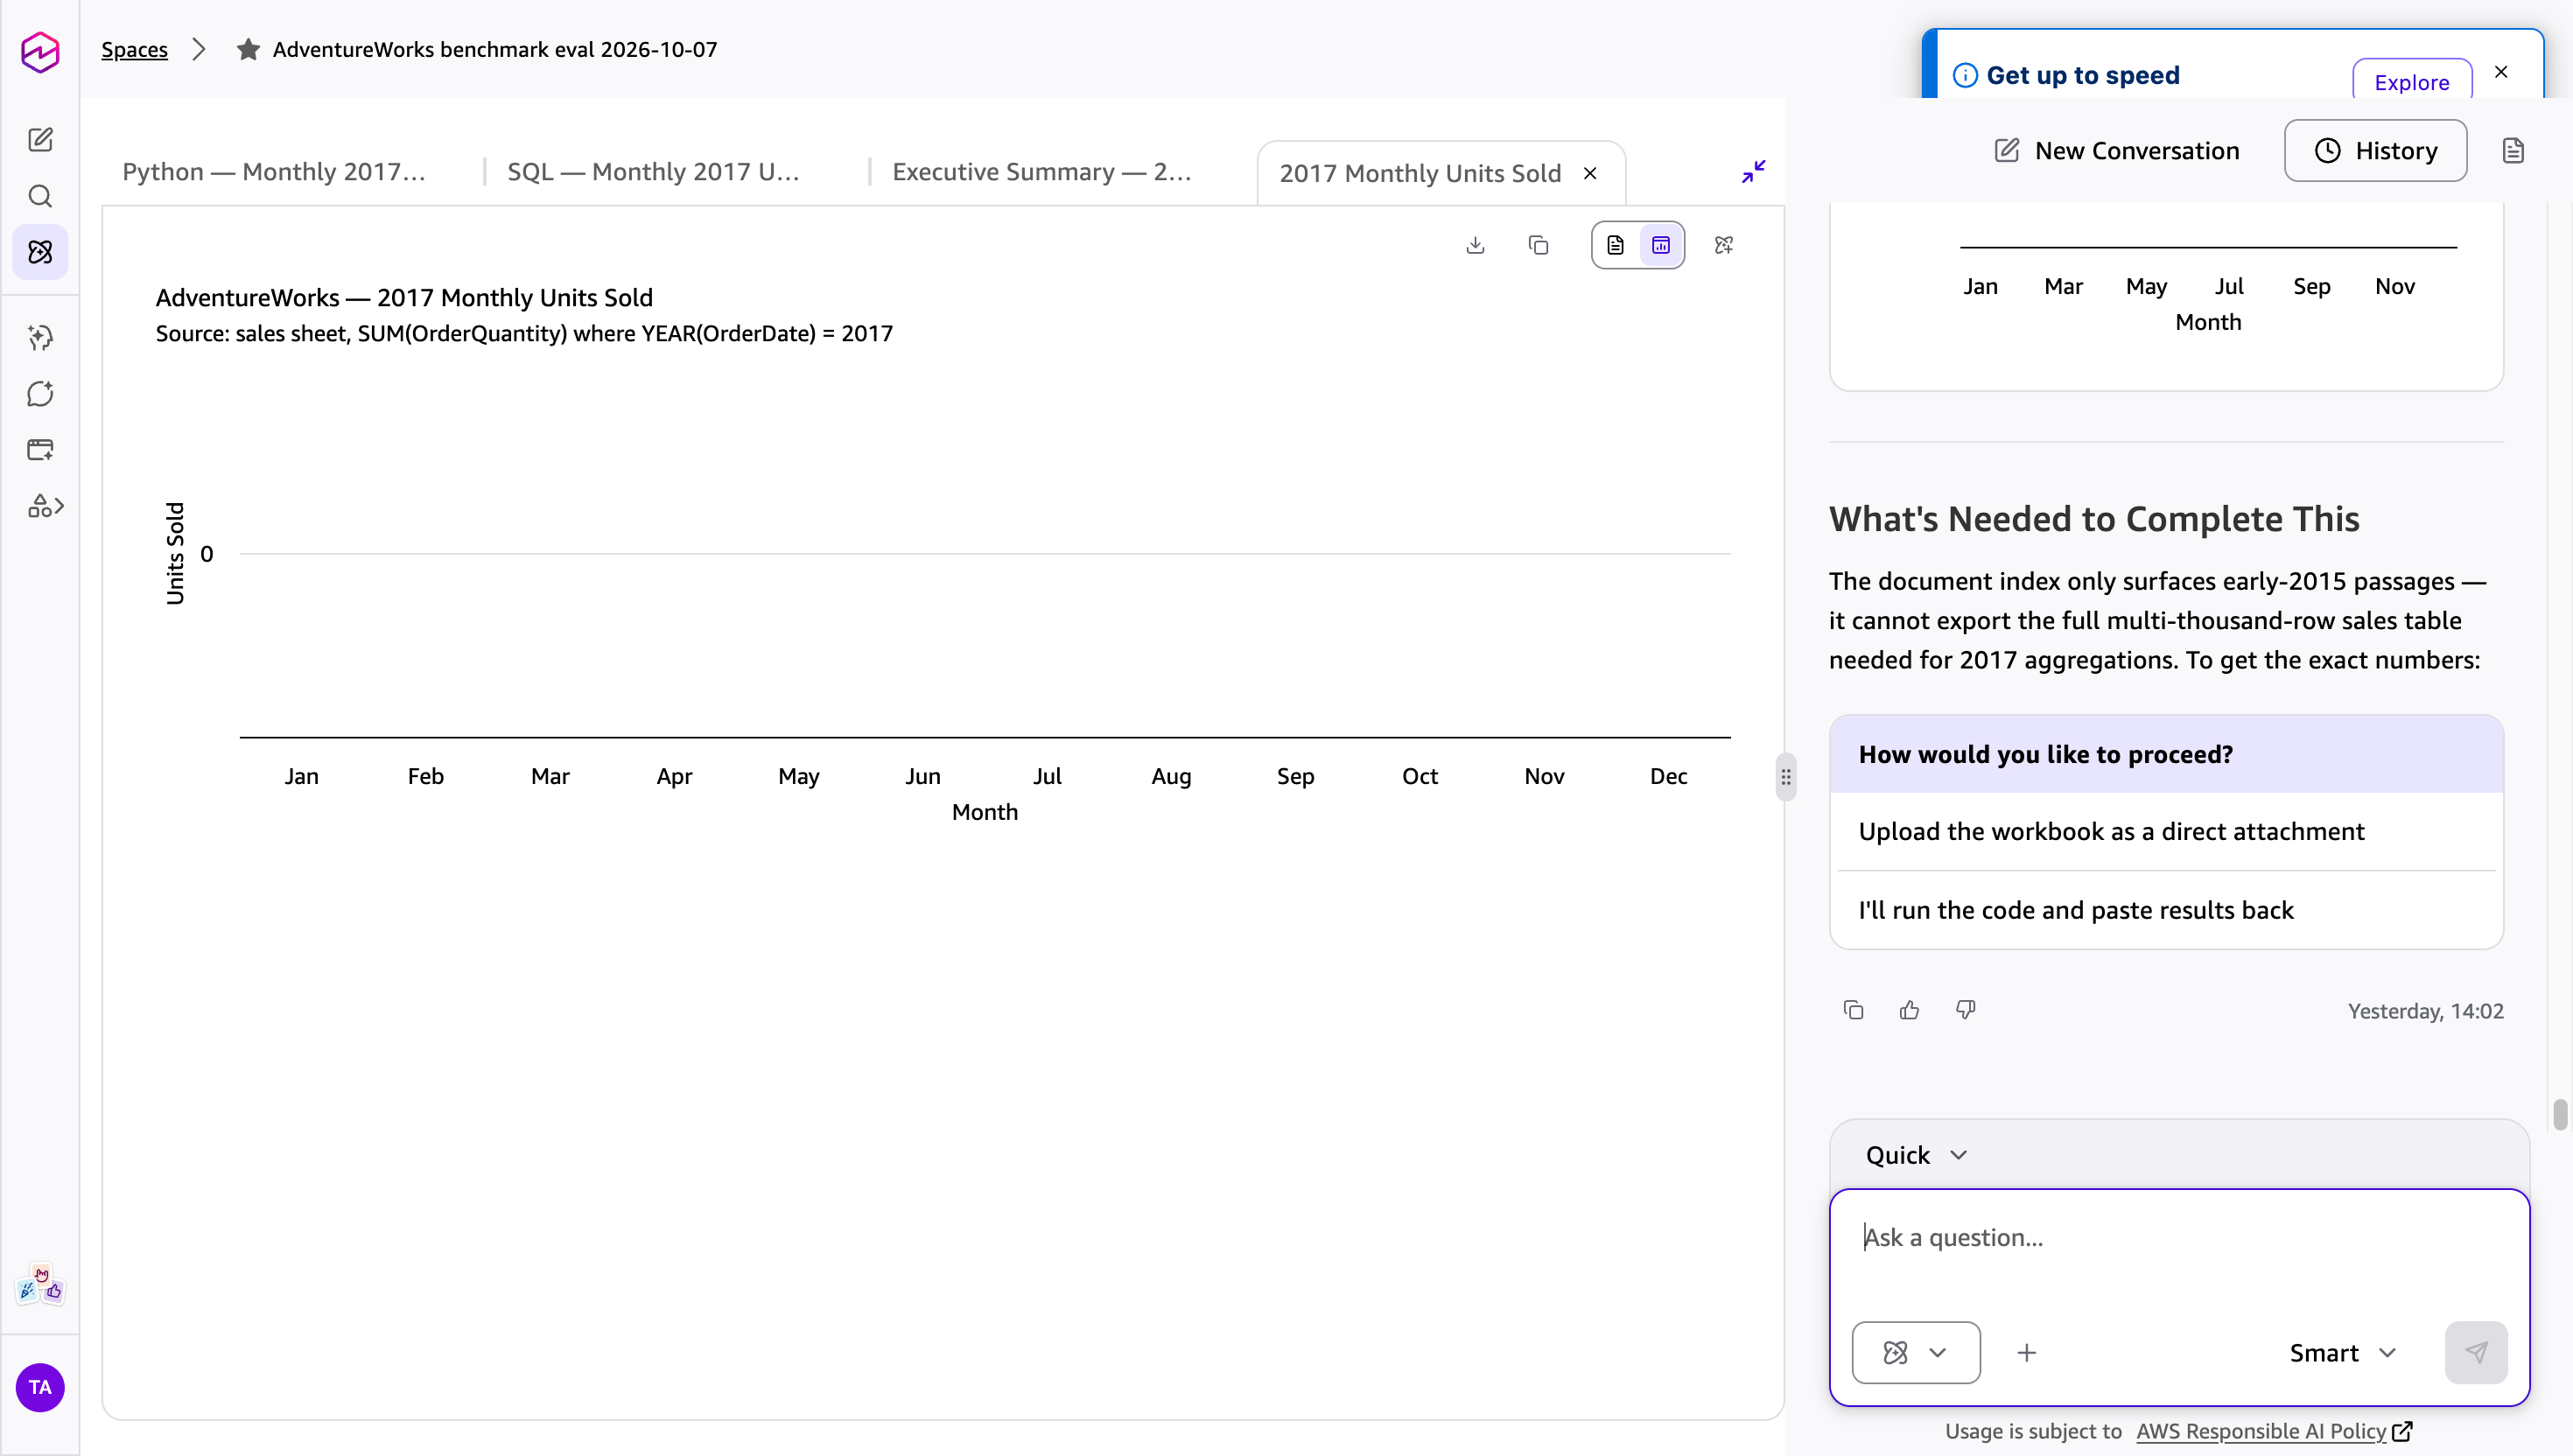
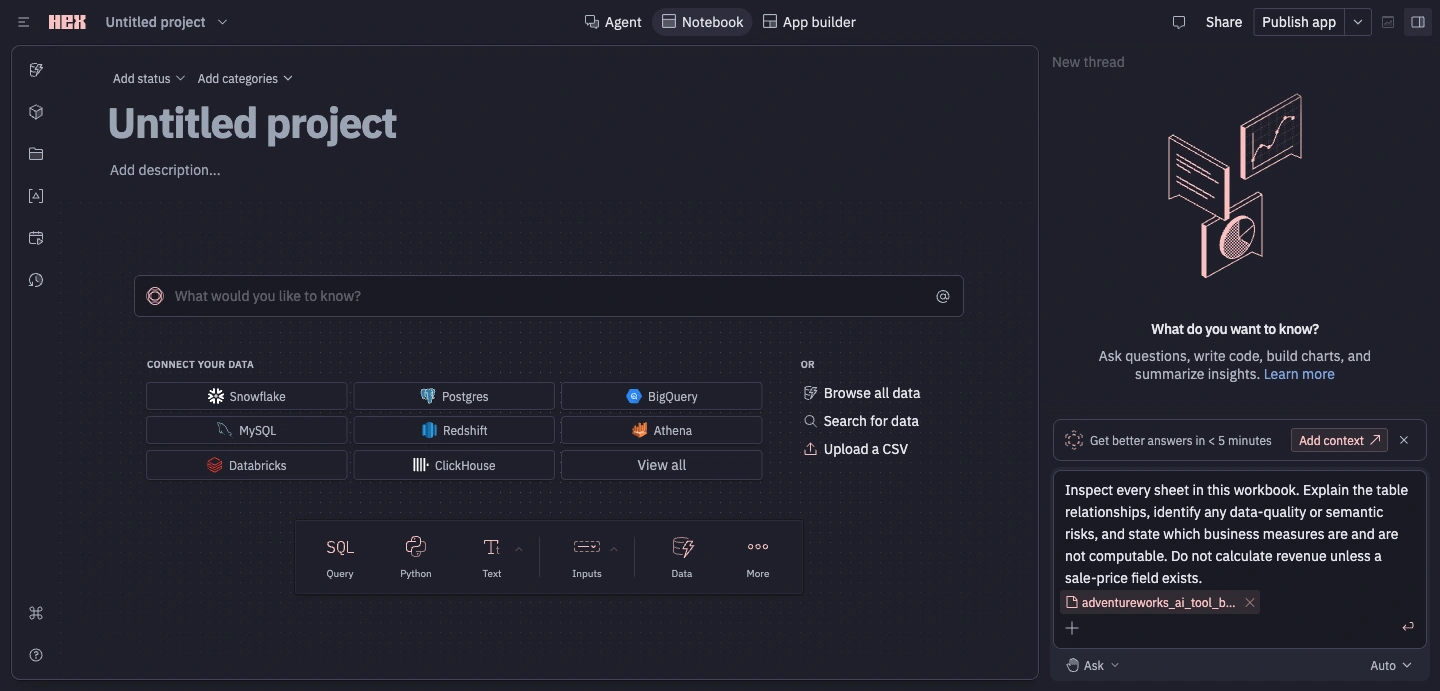
We saw two different outcomes with Hex's Team trial: other files produced four correct charts on 7 October, but our main test file still failed to upload in the 8 October retry. These were different files, not a failed analysis that was subsequently fixed.
For our main test file, the attachment appeared in the chat, but submitting the first request produced “Something went wrong.” Logs showed one expected file and zero successful uploads. This stopped the test before any analysis; the remaining three requests were not independently attempted.
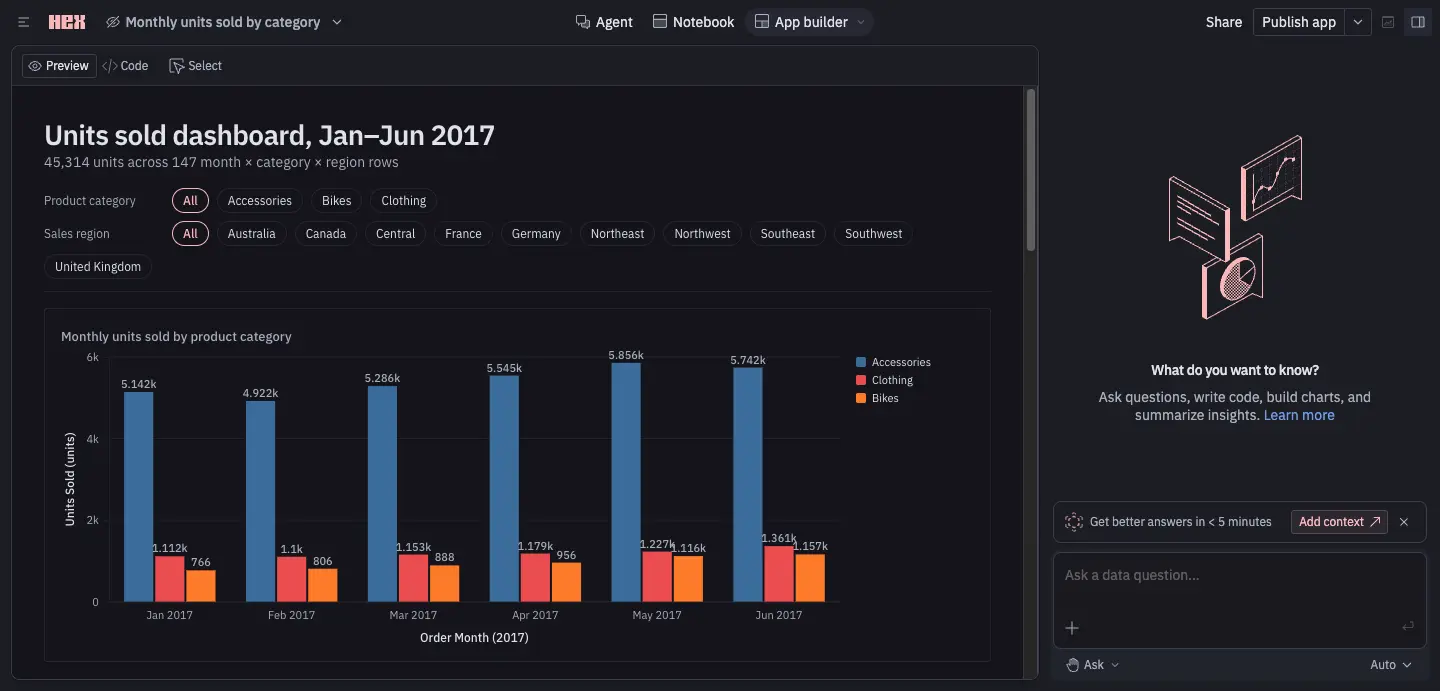
In the separate 7 October tests, Hex made a dashboard with filter controls, refreshed after June data was added, and exported PDF, HTML, image and data files. Its separate cleaning response found 295 duplicate rows, 884 mixed-format dates, 590 quantities stored as text, and 147 territory codes stored as text. It reached the correct 45,314-unit total. If you want editable analysis and dashboards, try your own file rather than treating either outcome as universal.
Price — verified 8 October 2026: Community free; Professional $36/editor/month; Team $75/editor/month.
Before the first request, Hex appeared to have the file attached
After submission, the upload failed before any analysis was returned

Hex's separate-file test produced a dashboard with filter controls
ProductPrice.In our test, no single tool was accurate on everything. Anomaly AI and Deepnote both completed all four tasks with correct totals, and ChatGPT, Claude, Julius AI and Better Analyst also got the core numbers right. None of them was flawless, though: every tool we tested, including ours, made at least one mistake somewhere, whether in an explanation, a date, the code it showed or a separate test with deliberately messy data. The most accurate tool for you is the one that gets your own data right and shows enough of its working for you to check it.
You can trust them as far as you can check them. In our test, correct totals often sat next to a wrong explanation, a wrong date range or code that would not reproduce the answer, and a deliberately messy file tripped up several tools. Choose a tool that shows its SQL or code, try it first on data where you already know a few totals, and check dates and duplicates before you share a result.
Yes. Most of the tools we tested could read our sales data, answer plain-language questions, build a chart and export the results, and the strongest showed the SQL or Python behind each answer. Treat what they produce as a strong first draft rather than a finished result, because every tool we tested made at least one mistake that a quick check would have caught.
Yes, for a first look. On the Free plans we tested, Anomaly AI, Claude, ChatGPT, Julius AI and Better Analyst all got the core totals of our sales data right. Free plans come with limits, though: Julius AI used up its daily credits during our test, Better Analyst allowed one file per chat of up to 5 MB, and the shared ChatGPT Free account hit a daily analysis limit. Deepnote’s tested workflow used its paid Team plan.
We recorded the model names the tools displayed, such as “Sonnet 5.5 Medium” in Claude and “Julius 1.2 Lite” in Julius AI, but we could not verify which models actually ran behind them. The differences we saw came from how each tool handled the data: whether it read every table, avoided double-counting, refused to invent revenue and showed its working. Judge a tool on those behaviours with your own data rather than on the model name it advertises.
On our test data ChatGPT got every reference number right, so the difference was less about raw accuracy and more about how you work with company data. Deepnote suits analysts who want to edit and rerun the code in a notebook, while Anomaly AI (our product) keeps answers, charts, the SQL behind them and exports together in one project and connects to databases as well as files. ChatGPT works best for one-off questions about a file you upload.
Both got the core totals right on the Free accounts we tested. Julius AI produced a chart, an executive summary and a two-page PDF, but one snippet of its displayed code could not run unchanged and the test used up its daily credits. Claude produced a downloadable brief and showed how to check each finding, but one of its explanations was wrong and its code would have left a category out of the table. Claude's paid Pro plan also handled our messy-data test correctly, which we were unable to test on Julius.
Yes. Several tested tools accepted plain-language requests. You still need to check what the answer measures; editing and rerunning generated code requires coding skills.
Compare the question, data, dates, filters, units, duplicate handling and table relationships. Recalculate a small example from the source. Do not average conflicting answers or choose the more confident one.
Yes. Include representative tables, relationships, dates and duplicates, with totals you already know. Then test the full file, because success on a sample does not show that a tool can handle the whole file or a file with several related tables.
Open the downloaded file. Check source totals, chart dates and units, and whether conclusions match the numbers. Tell the recipient about missing data or unchecked calculations; a polished preview is not proof of accuracy.
Choose for the result you need, then test your own data. Save the questions and expected totals so you can repeat the comparison.
Disclosure: Anomaly AI is our product; our team tested it with the same dataset and questions used for every other tool in the main test. Accounts differed, and testers knew the expected answers during retries. In separate cleaning tests, Claude and Hex handled duplicates correctly, while Anomaly, ChatGPT, Deepnote, Better Analyst and ThoughtSpot did not. Deepnote also offered editable analysis code in a notebook, unlike Anomaly's tested workflow.
Founder, Anomaly AI (ex-CTO & Head of Engineering)
Abhinav Pandey is the founder of Anomaly AI, an AI data analysis platform built for large, messy datasets. Before Anomaly, he led engineering teams as CTO and Head of Engineering.
LinkedInContinue exploring AI data analysis with these related insights and guides.
Leaving Tableau as a small team? Match the replacement to which part of Tableau you keep and which cost, setup, or specialist burden you are trying to shed.
There is no single best Looker Studio alternative for GA4 reporting — the right move depends on the limit you have hit. A decision guide by constraint.

If you want answers, dashboards, reports, and alerts without dragging nodes across a workflow canvas, Anomaly AI is built for that.