Tools & Comparisons
14 min
Best Looker Studio Alternatives for GA4 Reporting in 2026
There is no single best Looker Studio alternative for GA4 reporting — the right move depends on the limit you have hit. A decision guide by constraint.
Read More
Tools & Comparisons — Buyer’s guide · 2026
Leaving Tableau as a small team? Match the replacement to which part of Tableau you keep and which cost, setup, or specialist burden you are trying to shed.

12 min read
Quick answer — the best Tableau alternative for a small team
For a small team it comes down to two questions: which part of Tableau is genuinely worth keeping, and which operating burden — cost, setup, maintenance, or specialist dependence — you want to shed. Answer those and one path stands out. If Tableau's visual depth is the real value and cost is the only problem, right-size Tableau itself (Public or fewer Creator seats). If you want cheaper governed BI in the Microsoft stack, Power BI. If you'd rather own a low-cost, open tool, Metabase. If you just need free, low-maintenance dashboards, Data Studio (formerly Looker Studio). And if you don't have a BI specialist and need analysis that becomes both a dashboard and a reviewed report, a reviewable AI analysis workspace fits.
Small teams rarely leave Tableau because it's a bad tool. They leave because the fit stopped making sense: a Creator seat costs more than the reporting is worth, every dashboard change waits on the one person who knows the workbook, or the refresh and admin have quietly become someone's second job. So the useful question isn't "what's the closest thing to Tableau?" — it's "what do we actually need to preserve, and which of these burdens do we want to put down?" Answer those two, and the field of alternatives narrows quickly.
This guide is about that decision for a small team specifically. It isn't a broad visualization-tool ranking, a Power BI-first roundup, a three-vendor head-to-head, or a warehouse-dashboard tutorial; if that's what you're after, we link the right guides where they fit. Here, the job is to match the alternative to your reason for leaving.
Two questions decide most of this. Get them straight before you look at a single alternative.
Which part of Tableau is genuinely valuable to you? For some teams it's the visual and analytical depth — the ability to build a truly custom, interactive view. For others it's governance: shared definitions and a model everyone trusts. For many small teams, honestly, it's neither — they use a fraction of Tableau to publish a handful of dashboards. A viz-only replacement is a mistake if what you needed was governance, and an enterprise BI platform is overkill if all you needed was a clean shared chart.
Which operating burden do you want to remove? Usually one of three. Cost: Tableau Cloud is licensed by role and billed annually, and every deployment needs at least one Creator seat at $75 per user per month on the Standard edition (Tableau pricing) — a real floor if only one person builds and the rest just read. Maintenance: refreshes, extracts, and admin that keep needing attention. Specialist dependence: the fact that changing a report means finding the person who can. Name the one that actually hurts, and some alternatives drop off the list immediately.
Judge each option on the same six things a small team actually feels: how data gets in, how much it costs you to run, whether you can trust and inspect the numbers, what it produces, how you share it, and the real price with its minimum commitment.
| Tool | Data intake & modeling | Setup & operating burden | Analysis & trust | Output fit | Collaboration & delivery | Cost & minimum (checked Aug 2026) |
|---|---|---|---|---|---|---|
| Tableau (right-sized) | Broad connectors; Prep for modeling; assumes some prep skill | Real learning curve; rewards a capable owner | Deep calcs and LOD; lineage in applicable editions | Strong, custom interactive viz; PDF/image export | Cloud sharing and subscriptions; per-role seats, plus capacity-based Viewer access | Public free; Cloud role-based, annual, ≥1 Creator — Standard $75/$42/$15 |
| Power BI | Broad connectors + Power Query; governed semantic model | Modeling + refresh setup; easier in a Microsoft shop | Strong DAX measures, lineage, governed model | Interactive reports; export to PDF, PowerPoint, Excel | Publish/share via Pro or PPU; free users can view on F64+ capacity | Desktop free; Pro $14, Premium Per User $24 per user/mo (paid yearly) |
| Metabase | Databases and warehouses; CSV upload needs an admin-configured writable database (self-host) or the Cloud Storage add-on | Self-host the free Open Source edition, or managed Cloud you don't run | SQL plus models; lighter governance than Tableau/Power BI | Dashboards and saved questions | Sharing, dashboard subscriptions, and alerts | Open Source free (self-host); Cloud Starter $100/mo (5 users, then $6/user) |
| Data Studio (formerly Looker Studio) | Native Google connectors + partners; light modeling | Light setup; self-service dashboards; limited for heavy modeling | Reusable data-source fields; no centralized semantic model | Interactive dashboards; PDF | Share links; scheduled email delivery | Free; Data Studio Pro $9/user/project per month |
| Anomaly AI | GA4, BigQuery, Sheets, MySQL, Snowflake, or Excel/CSV upload up to 1GB | Low — ask in plain language; re-run on new data (re-upload a static file) | Reviewable logic and source-backed calculations; saved definitions and rules | Dashboard plus Excel, PowerPoint, Word, and PDF reports | Shareable dashboards and scheduled email reports — both on paid plans | Free; Pro $25/mo; Team $45/seat/mo (2-seat min, $90/mo) |
If the reason you're shopping is purely cost, one option is to keep Tableau and shrink the bill rather than switch. Tableau Public is free for building and sharing — with the important catch that everything you publish is public, so it's fine for demos and portfolios, not confidential reporting. Inside a paid deployment, licensing is by role: a Creator ($75/user/month on Standard, billed annually) covers full authoring — creating and publishing new workbooks and data sources, plus Tableau Desktop and Prep — while an Explorer ($42) can author and edit in the browser from already-published data, and a Viewer ($15) reads and interacts. Tableau Cloud also offers capacity-based Viewer access alongside per-user Creator and Explorer seats, which can lower the cost of read-only access for a wider audience. Every deployment still needs at least one Creator, so this isn't guaranteed to be the cheapest path — but if Tableau's interactive depth is genuinely what makes your reporting good, matching seats to roles is often less disruptive than a full replacement.
Power BI is the natural landing spot for a team that wants a real governed BI model at a lower cost than Tableau. Its semantic model lets you define a measure once and reuse it everywhere. On cost, compare workflows rather than single seats: Power BI Desktop is the free authoring surface, and a Pro license at $14 per user per month (paid yearly) adds publishing and sharing in the Power BI Service — so a build-and-share setup runs well under a Tableau Creator, though the roles aren't identical (a Tableau Creator bundles authoring and data prep). The catch is the work behind it: modeling, refresh scheduling, and the general assumption that someone on the team is comfortable in the Microsoft stack. It's the strongest fit when you already use Microsoft 365 and want governance you'll grow into — less so if the goal was to reduce the specialist dependence. If your search is really "what's the best Power BI setup," our Power BI alternatives guide and the Power BI vs Tableau vs QlikView comparison go deeper than we will here.
Metabase is the pick for a small team that wants to own its BI cheaply and doesn't mind a little ownership. The Open Source edition is free if you self-host it, and the managed Cloud Starter is $100/month with the first five users included (then $6 per additional user), which undercuts per-Creator BI licensing for a small group (Metabase pricing). It connects to your databases and warehouses and lets people ask questions with SQL or point-and-click; analyzing a spreadsheet or CSV rather than a connected database isn't automatic — on a self-hosted instance an administrator has to configure a supported writable database for uploads, and on Metabase Cloud it's an optional Cloud Storage add-on — so it isn't an unconditional file connector. The real tradeoff is ownership: the free edition means you run, update, and secure the server yourself, while Cloud hands that off for the subscription price. Its modeling and governance are also lighter than Tableau's or Power BI's. For a team comfortable running a small service — or paying for Cloud — and wanting predictable cost, it's a strong fit.
If your reporting is mostly a few dashboards on Google or marketing data, the lightest exit from Tableau is Google's free tool. Google renamed Looker Studio to Data Studio in 2026; the self-service version stays free, with a Pro tier at $9 per user per project per month. It connects natively to sources like GA4, Sheets, and BigQuery, and it's built for quick self-service dashboards rather than a modeled BI project. What you give up is depth: calculated fields live per data source rather than in a governed model, and it's not the tool for heavy joins or a custom analytical build. For a small team whose real need is a free, shared dashboard, that's often an acceptable trade.
The gap none of the above closes for a lean team is the specialist dependence itself: every option above still rewards someone who can model data and build the view. That's the constraint we built Anomaly for. You connect a source — GA4, BigQuery, Google Sheets, MySQL, Snowflake, or an Excel or CSV upload up to 1GB — ask for the analysis in plain language, and get an interactive dashboard plus stakeholder-ready outputs (an Excel report, a PowerPoint deck, a Word document, or a PDF) from the same work, with a scheduled email version on paid plans. The part that matters for trust is that the analysis is meant to be reviewed: you can inspect the logic, source data, and calculations behind an output before you share it, and saved metric definitions and business rules carry across so the dashboard and the report you send stay consistent.
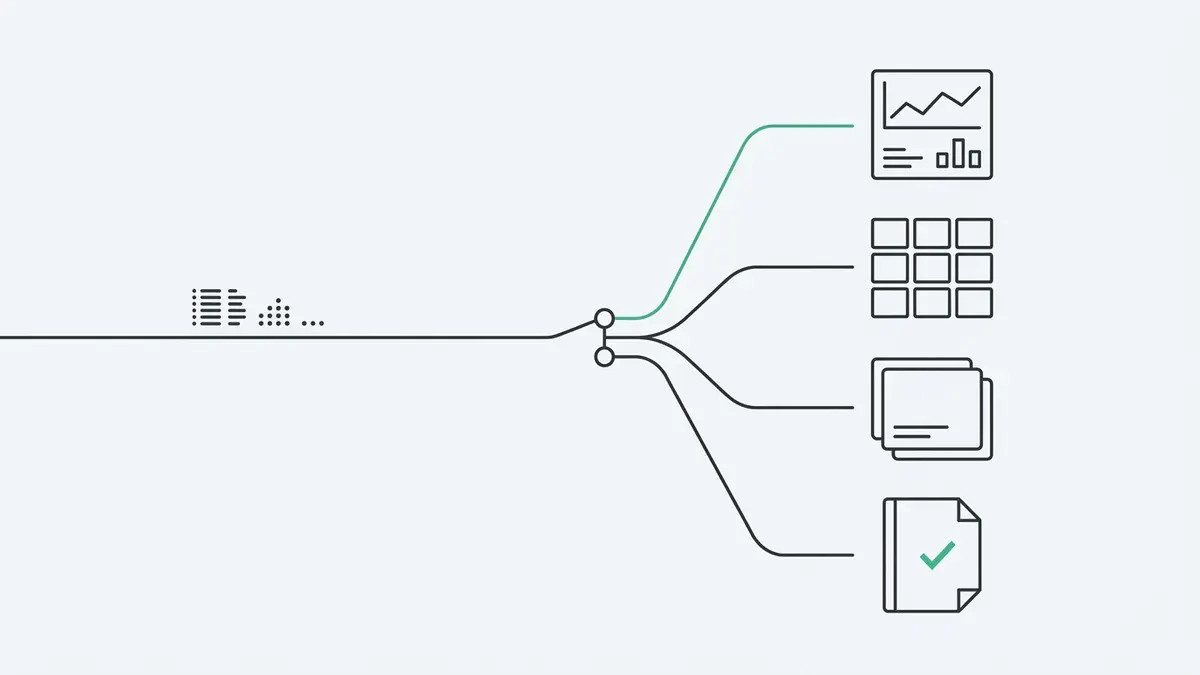
Connect a source or upload a spreadsheet — a dashboard and a report from one analysis
A few honest boundaries. Anomaly isn't a Tableau-grade visualization studio — if you need pixel-level custom charts or a deep enterprise governance and embedded-analytics platform, Tableau or Power BI is the better home. It isn't a real-time monitor either: a scheduled report re-runs your analysis, but it doesn't invent new data — a connected source pulls fresh data on refresh, while a one-off Excel or CSV upload is a snapshot you replace when new file data arrives. And it doesn't remove the human review step — it makes the numbers checkable so a person can sign off faster, not skip it. Reach for it when a small team needs to turn its data into a dashboard and a reviewed report without hiring or borrowing a BI specialist.
Switching isn't free. Rebuilding dashboards, retraining people, and re-establishing trust in the numbers all cost time a small team doesn't have much of. If your team genuinely uses Tableau's depth — custom interactive analysis, level-of-detail calculations, a library of workbooks people rely on — and the only complaint is the bill, look at the bill first: audit who really needs a Creator versus an Explorer or Viewer seat, weigh Tableau Cloud's capacity-based Viewer access for a larger read-only audience, and consider Tableau Public for anything that can be public. The honest test is the same one from the top: if you can't name the specific part of Tableau that's failing you, you probably don't need to leave it.
There isn't a single best one — it depends on which part of Tableau you need to keep and which burden you want to remove. If the depth is the value and cost is the only issue, right-sizing Tableau's seats may beat switching. If you want a lower-cost BI tool, Power BI, Metabase, and Data Studio each fit a different constraint (Microsoft stack, self-hosting, or free Google-data dashboards). And if the real blocker is that nobody on the team is a BI specialist, a reviewable AI analysis workspace is the option worth testing.
Several, with tradeoffs. Tableau Public is free but everything you publish is public. Metabase Open Source is free if you self-host it. Data Studio's self-service tier is free. Power BI Desktop is a free download; sharing in the Power BI Service normally needs a paid Pro (or Premium Per User) license, though on Premium or Fabric F64-and-above capacity, users with a free license can view content others publish. Anomaly has a free tier as well. The right free option depends on whether your blocker is cost, hosting, or private sharing.
Tableau Public is free, and there's a free Desktop edition, but Tableau Cloud is licensed by role and billed annually, and every deployment needs at least one Creator. On the Standard edition that's $75 per user per month for a Creator, $42 for an Explorer, and $15 for a Viewer; Enterprise is $115 / $70 / $35. For a team where only one person builds and the rest read, matching seats to roles — Viewer or capacity-based Viewer access for readers — can reduce the cost of staying, though every deployment still needs at least one Creator.
It depends on the replacement. Power BI and Metabase still reward someone who can model data and own the setup. Data Studio is lighter but limited in depth. A reviewable AI analysis workspace like Anomaly is designed for teams without a BI specialist: you connect data, ask for the analysis in plain language, and can still review the logic and source data behind an output before you share it.
Before you migrate anything, take an honest inventory of what you have: which seats are truly Creators versus readers, which parts of the reporting workflow you can't afford to lose, and which burden pushed you to start looking. For most small teams the answer turns out narrower than a full switch — a seat audit, a cheaper BI tool, or handing the tool-building itself to a workspace where you ask in plain language and can still check the numbers. If that last one is the workflow you need to keep alive, it's what we built Anomaly to do.
Founder, Anomaly AI (ex-CTO & Head of Engineering)
Abhinav Pandey is the founder of Anomaly AI, an AI data analysis platform built for large, messy datasets. Before Anomaly, he led engineering teams as CTO and Head of Engineering.
LinkedInContinue exploring AI data analysis with these related insights and guides.
There is no single best Looker Studio alternative for GA4 reporting — the right move depends on the limit you have hit. A decision guide by constraint.

If you want answers, dashboards, reports, and alerts without dragging nodes across a workflow canvas, Anomaly AI is built for that.

If you need business analysis, dashboards, scheduled reporting, and alerts without building a full ML platform, Anomaly AI is built for that.