
AI Data Analysis
13 min
Best AI Report Generators for Excel and CSV Data in 2026
AI report generators for Excel and CSV data have converged — most now build a finished report. Compare ChatGPT, Julius, Powerdrill, Copilot and Anomaly AI.
Read More
AI Data Analysis — Buyer’s guide · 2026
Few AI tools actually carry Excel data into a real PowerPoint. Compare ChatGPT, Microsoft 365 Copilot, Plus AI, Gamma, Formula Bot and Anomaly AI in 2026.

14 min read
Quick answer — best AI tools for turning Excel data into PowerPoint in 2026
There's no single best tool, because these products do three different jobs. ChatGPT analyzes a workbook with the Python on show and can now build a PowerPoint from source material — a spreadsheet included — through its desktop presentations workflow or its in-PowerPoint add-in. Microsoft 365 Copilot builds native decks, but its file-to-deck flow reads Word or PDF, not Excel; its newer Copilot Chat agents can reference spreadsheet data, though the documented output is a report, not a slide deck. Plus AI and Gamma design polished decks fast — but you supply or pre-compute the numbers; neither analyzes a workbook. Formula Bot takes an Excel analysis to a downloadable .pptx, with charts landing as images. And Anomaly AI is built for the case where the numbers on the slide have to be traceable — it analyzes the workbook with SQL you can inspect and turns the result into a PowerPoint you can defend. Match the tool to whether your bottleneck is analysis, design, or trust.
You have the data in Excel, and you owe someone a PowerPoint. That is a specific job, and "AI presentation tool" is a crowded, confusing label for it — because the tools wearing that label are not competing for the same work. One analyzes your spreadsheet. Another designs beautiful slides from text you already wrote. A third is a native Office feature that assumes the numbers are already where they need to be. Only a few take a raw workbook all the way through analysis into an actual, downloadable .pptx.
This guide compares six tools on the complete Excel-to-deck workflow, not on whether they can make a chart or an outline in isolation. Every capability, limit, and price below was checked against each vendor's current primary documentation in August 2026, and the load-bearing claims link to the source; where a live figure couldn't be confirmed from an official page, it's described qualitatively rather than guessed. If what you actually need is broad spreadsheet analysis rather than a slide deck, our guide to AI Excel data-analysis tools is the better starting point.
Almost every tool here can put a chart on a slide. That's not the hard part. The hard part is the full trip: read a workbook, work out what it says, build the right charts and tables, lay them out as a coherent deck, and hand you a file you can open, edit, and stand behind. Where each tool breaks that chain is what separates them. These five questions do the real work of matching a tool to the deck you owe:
Can you point it at an .xlsx or .csv and have it analyze the data — or does it only accept text, or expect you to paste numbers into a prompt? A tool that can't read the workbook can't turn it into anything.
Do you get an actual PowerPoint file, or an outline, a web-only presentation, a PDF, or a Google Slides deck? "It made slides" and "it made a PowerPoint you can send" are not the same claim.
Are the charts on the slides built from your numbers, and are they still editable in PowerPoint afterward — native chart objects, or flattened images you can't touch without regenerating?
Before the deck goes to a client or an exec, can you see how a figure was derived — the code, the query, the source rows? Most presentation tools skip this entirely, and it's the one that costs you when a number is questioned.
When the next workbook arrives, how much of this do you redo? Be honest that an uploaded file is a snapshot — none of these tools live-links a static spreadsheet to a deck that refreshes itself.
Group the six tools by where they sit on that chain and the picture gets simpler. ChatGPT, Formula Bot, and Anomaly AI actually analyze the workbook. Plus AI and Gamma are designers — they turn content you supply into a good-looking deck. Microsoft 365 Copilot is the native-Office option, strong on both sides but with a gap between them. Read each for the distinction that matters, not a scorecard.
| Tool | Best for | Excel data → real .pptx? | Check the numbers? | Price (from) |
|---|---|---|---|---|
| ChatGPT | Analyzing a workbook and shaping the story | Yes — desktop @Presentations or the PowerPoint add-in build a .pptx from source, a spreadsheet included | Yes — reads the Python it ran | Plus $20/mo |
| Microsoft 365 Copilot | Teams already living in Office | Native .pptx, but the file-to-deck flow takes Word/PDF, not Excel; agents reference Excel data mainly for reports | Partial — formulas and source links, no full trail | Business $18/user/mo (first-yr promo, annual) |
| Plus AI | Polished decks from content you supply | Real .pptx and Google Slides — but no Excel intake; you paste the data in | No provenance layer | Pro $20/user/mo (annual; chart workflow) |
| Gamma | Best-looking deck from a prompt | Exports .pptx, but imports text only; you pre-compute the figures elsewhere | No | Free; Plus $9/seat/mo ($108/yr) |
| Formula Bot | The closest to true Excel → .pptx | Yes — analyze, then Summarize → Slides; charts as images | Yes — shows the Python, SQL, or R | Starter $18/mo ($13/mo billed yearly) |
| Anomaly AI | Decks whose numbers must stay traceable | Yes — analyzes the workbook with SQL you can inspect, then builds the deck | Yes — queries, filters, source rows, calculations | Free; Pro $25/mo |
For reading a spreadsheet, ChatGPT is genuinely good. Upload an .xlsx or .csv and its data-analysis feature runs Python in a sandbox, returns charts and tables, and — this is the part that matters for a deck you'll defend — lets you read the exact code it ran. OpenAI's own guidance is to "review the generated code, outputs, and assumptions" before relying on the result.
Getting that into a PowerPoint has improved. OpenAI now documents a desktop @Presentations workflow that can "create or edit a PowerPoint file or build a new presentation from your source material," and it lists "a spreadsheet" among the valid sources. There's also a ChatGPT for PowerPoint add-in that lives inside Microsoft PowerPoint and can draft a deck from notes, documents, or spreadsheets while preserving editable slide structure. One caveat worth knowing: native PowerPoint isn't wired into the core ChatGPT Work desktop file flow the way Google Slides and Excel are, so which surface you use — the presentations workflow, the add-in, or plain data-analysis chat — changes how polished and repeatable the result is. Try it on your own file to see which fits.
Pricing is monthly-only for the individual tiers: a free plan, Plus at $20 per month, and Pro at $100 or $200 per month for heavier use; a business plan is $20 per user per month billed annually ($25 monthly). If your real need is to interrogate the data with the working on show, ChatGPT is a strong pick — just confirm the presentation surface you want is available on your plan.
You'd expect the company that makes both Excel and PowerPoint to own this workflow. Copilot is strong at each end — Copilot in Excel analyzes data, writes and explains formulas, and builds charts and PivotTables with editable source links; Copilot in PowerPoint drafts a native, editable deck with speaker notes. The gap is between them. PowerPoint's "create a presentation from a file" accepts a Word document or a PDF, and Microsoft's supported-file-formats list puts spreadsheets under data analysis, not presentation sources — Excel isn't a "create a deck from this file" input.
There is a newer path that softens the old "do it all by hand" story: the Word, Excel, and PowerPoint Agents in Copilot Chat can reference your files and "pull in information from your files." But Microsoft's one documented Excel example — "Use data from Q3_sales.xlsx to create a summary report with charts" — produces a report, not a slide deck, so an Excel-to-deck agent flow is plausible but not something Microsoft documents yet. Either way, the output is AI-generated content Microsoft tells you to "review, edit, and verify," and there's no full derivation trail behind a finished slide.
On price, Microsoft 365 Copilot is $30 per user per month for enterprise (annual), and the SMB Copilot Business add-on lists at $21, currently offered at $18 per user per month as a first-year promotion for eligible existing Microsoft 365 Business customers (annual commitment, on top of a qualifying base plan); the free Copilot Chat is included with eligible subscriptions. Copilot is the pragmatic choice when your organization already lives in Office and you accept moving the Excel numbers into a deck yourself.
Plus AI is a well-liked way to produce a good-looking deck quickly, and it's honest about being a design-and-writing tool rather than an analysis one. It works as an add-in inside PowerPoint and Google Slides and as a web app that exports a native .pptx, using its own Open XML renderer. If your content already exists, it will turn a prompt, an outline, or a document into a clean, on-brand deck.
For an Excel starting point, though, the intake is thin. The consumer upload options are PDF, Word, PowerPoint, and plain text — Excel and CSV aren't accepted, so you paste the numbers in. Plus can generate charts, but that chart feature is a Pro or Team capability, not the entry Basic plan — which is why the compared workflow starts at Pro, not the $10 tier. And there's a scoped limit worth knowing: on imported custom templates, Plus's docs say the AI won't update a chart's underlying data and native tables aren't yet supported (Enterprise unlocks those slide types); charts do generate in Plus's own templates. What Plus doesn't offer at all is a way to see how a number was reached — there's no calculation or provenance layer, and Plus's own help warns that language models can "create false data" if you don't supply exact figures, so verify the charts after they're made.
Pricing is per user with a credit allowance: Basic at $10/user/month, Pro at $20, Team at $30, and Max at $200 (all billed annually; monthly is higher). Reach for Plus AI when you have the analysis done and want the deck to look sharp fast — not when the spreadsheet is the thing that still needs figuring out.
Gamma makes some of the best-looking AI decks around, and it will export a real PowerPoint file (alongside PDF, PNG, and Google Slides). If your input is a story — a prompt, an outline, pasted text — it's hard to beat for speed and polish.
It is not a way to analyze a spreadsheet, and Gamma is refreshingly direct about that: its own guide to getting data into a deck tells you to compute the numbers in a script first and "never make Gamma do arithmetic — pass it finished figures only." Document import brings in text only, so a workbook's data and layout don't carry across; you can embed an Excel file as an object, or sync a chart from Google Sheets (not Excel), but the analysis happens elsewhere. On export, Gamma notes that some visual effects fall back to simpler styles; it doesn't document whether charts arrive as native, data-editable PowerPoint objects, so don't count on editing chart data in the exported file without checking. Worth noting for a client deck: the free plan stamps a "Made with Gamma" badge on exports, removed on paid plans.
Gamma has a free plan, with paid Plus, Pro, and Ultra tiers priced per seat, and up to 28% savings with annual billing. Current US pricing on Gamma's pricing page is Plus $9 per seat/month ($108 billed annually), Pro $18 ($216), and Ultra $90 ($1,080). Choose Gamma when the deck's job is to look great from a narrative you already have — and keep your Excel analysis somewhere else.
Formula Bot is the tool on this list that most directly does the whole job. Upload an Excel, CSV, or Google Sheet (up to 200 MB on the entry plan, more higher up), analyze it in a chat, then use Summarize → Slides to get a downloadable .pptx — one that opens in PowerPoint, Keynote, or Google Slides, with the charts placed on layouts like KPI grids and chart-with-commentary, plus speaker notes. Its docs are clear that the figures are pulled "directly from your data," and it exposes the generated Python, SQL, or R so you can check the working.
Two honest caveats. It isn't one click: you run the analysis first, then generate the deck, so the slide quality tracks how thorough that analysis was. And the charts arrive in the file as embedded images — the text and layout are editable in PowerPoint, but a chart's data isn't; changing a number means editing in Formula Bot and regenerating. Scheduling in Formula Bot refreshes the analysis, not an emailed deck, so next quarter still means re-running Summarize.
Pricing has a free tier, then Starter at $18/month ($13/month if billed annually, $151/year), Max at $29/seat/month ($20/seat/month billed $244/year), and Enterprise at $149/seat/month ($99/seat/month billed $1,188/year). If you want the shortest real path from a workbook to a slide file and you value seeing the code, Formula Bot is the pragmatic pick.
Formula Bot already shows that a single tool can take an Excel analysis to a downloadable deck with the code on view, so the useful question isn't who can make a PowerPoint — it's how much of the trail behind each figure you keep. That's where Anomaly AI is aimed: turning an Excel or CSV analysis into a PowerPoint while the important figures stay traceable to their source, which is what matters when a deck goes to a client, a board, or a finance review.
It's an AI data analyst. You upload Excel or CSV files up to 1 GB, or connect a source like Google Sheets, BigQuery, or a database, ask in plain language for what you need, and it turns the result into a reviewable dashboard, an Excel report, a PowerPoint deck, a Word document, or a PDF. What sets it apart for a stakeholder deck is the third criterion above: the analysis is meant to be reviewed, not taken on faith. You can inspect the queries, the filters, the source rows, and the calculations behind the numbers before anything is shared, and it holds onto your metric definitions and business rules so the same report stays consistent from one cycle to the next. (If your slides need to come from a warehouse rather than a workbook, that's a different route — see our take on building QBR slides from BigQuery data.)
The reviewable SQL behind the deck
Be clear about the boundaries, because a defensible tool shouldn't overpromise. An uploaded file is a snapshot — it reflects the data you uploaded until you upload a fresh copy, so think of Anomaly as turning a dataset into a repeatable, traceable deck rather than a live feed; a connected source like a database can be re-queried. Slide output is functional, not a substitute for a dedicated design tool if a beautiful narrative deck is the whole goal. And despite the name it isn't a real-time monitor, an automatic anomaly detector, a forecasting engine, or a Slack notifier. Reach for it when the binding job is a recurring, high-stakes deck whose figures — and the definitions behind them — have to survive scrutiny.
The free tier lets you try the analysis; Pro is $25 per month, the Analyst plan is $90 per month for heavier, python-style workflows, and the Team plan is $45 per seat per month with a two-seat minimum, so $90 per month, with credits pooled across the team.
You need to interrogate a workbook, with the working on show, and you'll shape the slides yourself
ChatGPT.Your team lives in Microsoft 365 and moving the Excel numbers into a deck by hand is acceptable
Microsoft 365 Copilot.The analysis is done; you want a sharp, on-brand deck fast
Plus AI or Gamma.You want the shortest real path from a spreadsheet to a .pptx, with the code on view
Formula Bot.The deck is recurring and every important figure has to stay traceable and defensible
Anomaly AI.Increasingly, yes. ChatGPT analyzes an uploaded Excel or CSV file and lets you read the Python behind it, and OpenAI now documents a desktop presentations workflow that can create or edit a PowerPoint file from source material — a spreadsheet included — plus an add-in that drafts editable slides inside Microsoft PowerPoint. Native PowerPoint still isn't part of the core ChatGPT Work desktop file flow the way Google Slides and Excel are, so confirm the presentation surface you want is available on your plan and try it on your own file.
Not through its main file-to-deck flow. Copilot in PowerPoint creates a deck from a prompt or from a Word or PDF file, and Microsoft lists Excel as a data-analysis input rather than a presentation source. The newer Copilot Chat agents can reference your files and pull in data, but Microsoft's documented Excel example produces a summary report, not a slide deck. The result is a native, editable PowerPoint that you're told to review and verify.
The analysis tools, not the designers. ChatGPT and Formula Bot show the exact code they ran, and Anomaly AI keeps the queries, filters, source rows, and calculations inspectable behind the figures. The presentation designers — Plus AI and Gamma — don't expose any derivation, and Plus even warns that AI can invent numbers if you don't supply exact data. If the deck will be scrutinized, that traceability is the feature to weigh.
No, not from a static Excel file. An uploaded workbook is a snapshot, so a new period means re-running the analysis and regenerating the deck in every tool here. Some can re-run the analysis on a schedule or from a connected data source, but none live-links a static spreadsheet to a self-updating PowerPoint. Treat a reusable template you regenerate as the realistic goal, not set and forget.
It varies, so check it for your workflow. Formula Bot embeds charts as images, so the text and layout are editable but the chart data isn't. Gamma doesn't document whether its exported charts are native, data-editable objects. Copilot and Plus AI produce native slide objects, though Plus notes that on imported custom templates its AI won't re-edit a chart's underlying data. If you need to tweak a chart's numbers inside PowerPoint later, confirm the tool emits native chart objects rather than pictures.
Turning Excel data into a PowerPoint isn't one job, so there isn't one winner. If your bottleneck is understanding the data, ChatGPT gives you an inspectable analysis and can now export the slides. If you live in Office and don't mind moving the numbers over yourself, Copilot keeps everything native. If the analysis is done and you want a polished deck fast, Plus AI or Gamma will make it look good. If you want the shortest real path from a workbook to a slide file with the code on view, Formula Bot is the pragmatic pick. And when the deck is recurring and every important figure has to stay traceable — the queries, the definitions, the numbers a client might challenge — that's the job Anomaly AI is built for: bring your Excel or CSV data, get a PowerPoint you can defend and reuse, and start free. Whatever you shortlist, run it on your own workbook before you commit.
Founder, Anomaly AI (ex-CTO & Head of Engineering)
Abhinav Pandey is the founder of Anomaly AI, an AI data analysis platform built for large, messy datasets. Before Anomaly, he led engineering teams as CTO and Head of Engineering.
LinkedInContinue exploring AI data analysis with these related insights and guides.
AI report generators for Excel and CSV data have converged — most now build a finished report. Compare ChatGPT, Julius, Powerdrill, Copilot and Anomaly AI.
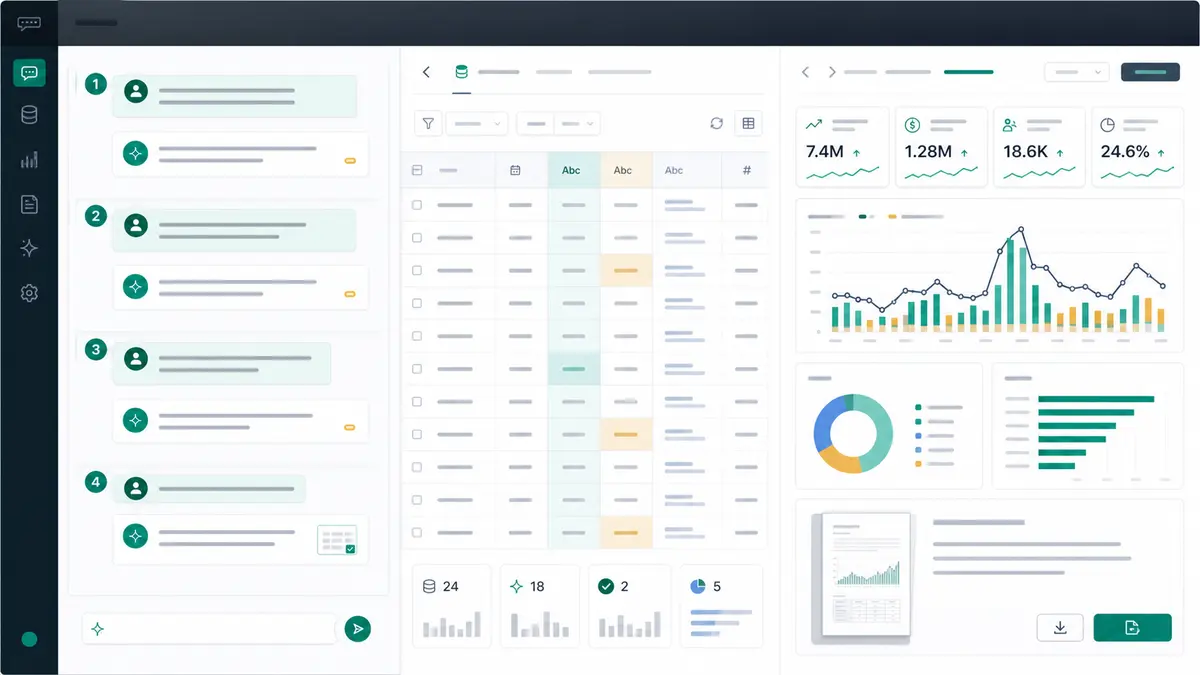
A practical first-session workflow for getting useful, verifiable insights from Anomaly: context, first read, evidence check, and output request.

A practical buying guide for choosing between fast AI dashboard generators and traceable interactive data workspaces for messy business data.