Best AI Report Generators for Excel and CSV Data in 2026
AI report generators for Excel and CSV data have converged — most now build a finished report. Compare ChatGPT, Julius, Powerdrill, Copilot and Anomaly AI.
Abhinav PandeyFounder, Anomaly AI (ex-CTO & Head of Engineering)
13 min read
ChatGPT
Julius AI
Powerdrill
Formula Bot
Microsoft 365 Copilot
Anomaly AI
Quick answer — best AI report generators for Excel and CSV data in 2026
There's no single best AI report generator for Excel and CSV data — several now do the job, and they differ more in how they build the report, how much of the working you can see, and what they cost. ChatGPT analyzes your file with the Python on show and, on its newer file-creation surface, can build a documented report. Julius AI writes a sectioned report and runs the code behind it. Powerdrill builds a report or deck in about a click and shows its analysis steps. Formula Bot generates formatted reports and slides and exposes the exact generated code. Copilot can create finished Office files if you're already in Microsoft 365. And Anomaly AI keeps the queries, filters, calculations, and your metric definitions and business rules inspectable, from connected sources as well as uploads.
There's more to "generate a report" than reading a spreadsheet. Several AI tools now take an Excel or CSV file all the way to a formatted, shareable report — so the useful differences are how much of the document each one builds for you, how much of the working behind the numbers you can see, and what the workflow costs. For someone with a workbook and a report due, that's the decision.
This guide compares six AI tools on those questions. Prices and capabilities were checked against each vendor's current documentation in August 2026; where a figure only renders behind a sign-in or a script, that's noted rather than guessed.
01What "AI report generator" should actually mean
Almost every tool here can analyze a spreadsheet and produce some form of report. That's no longer what separates them. Five questions do the real work of matching a tool to the report you owe someone:
1
Excel/CSV intake
Which file types it accepts, how it handles a multi-tab workbook, the practical size limit, and what cleanup or conversion you have to do first.
2
How much working you see
Whether you can read the code, the analysis steps, or the queries and source behind each number — and how deeply that sits next to the finished figures.
3
Finished-report capability
Whether it produces a coherent report — not just chat text or isolated charts — and which formats and layout control you actually get.
4
Editing, reuse, and delivery
How you revise the draft, export or download it, and hand it to a stakeholder — without mistaking a one-time document for a live, self-refreshing feed.
5
Operating burden and price
Setup, the skill required, plan and usage limits, and the real paid basis for the specific workflow you'd run.
How you check the numbers varies more than whether there's a report at all: some tools show the exact code they ran, some show the analysis steps, some keep the queries and definitions tied to each figure. For something a stakeholder will act on, that depth is what lets you defend a number. So settle what you need to walk away with — the finished document, the working behind it, or both — and match it.
Where the six tools land on the two questions that matter
The tools have converged: each now builds a report and shows some of its working, so most sit in the upper band. The differences are in the details — how one-click the output is, and how much of the trail stays tied to each figure. Illustrative positioning from the criteria above, not a numeric score.
02The six tools at a glance
Here's the shortlist — what each one produces, how much of the working you can see, and what it costs. Prices were checked against each vendor's current pages in August 2026.
Tool
Report output
Working you can see
Entry price (2026)
ChatGPT
Analysis with charts; its file-creation surface can build a documented report and create docs, slides, and spreadsheets
The exact Python it runs
Free tier; paid Go, Plus, Pro, and Business plans (figures render client-side)
Julius AI
Report-first: a sectioned written report; export slides, Excel/CSV, or a shareable link
Runs code; Notebooks show the steps, numbers trace to source
Free; Plus $20/mo ($16 billed annually); Pro $45/mo
Powerdrill
Report-first: one-click report → Word, PDF, Markdown, or PPT
Documented analysis steps — code planning, generation, and execution
Free; Pro $16.58/mo billed annually ($199/yr)
Formula Bot
Formatted reports and slides (.docx/.pptx), inline charts, plus Excel/CSV/PDF export; Brand Kits
The exact generated Python, SQL, or R
Free (5MB, 10 msgs/mo); Starter $18/mo; Max $29/seat/mo
Microsoft 365 Copilot
Word, Excel, and PowerPoint Agents in Copilot Chat can create finished Office files from a prompt
Cites sources; native Excel formulas and charts
Business add-on $18/user/mo, or Enterprise $30/user/mo (both yearly, + a paid Microsoft 365 plan)
Anomaly AI
Analysis → reviewable dashboard and exported report (Excel, PowerPoint, Word, PDF)
Queries, filters, calculations, source rows, plus metric definitions and business rules
Free to try; Pro $25/mo; Team $45/seat/mo (2-seat min, $90/mo)
Prices and capabilities checked against each vendor's current documentation, August 2026. ChatGPT's exact prices render client-side and aren't asserted here.
03The general-purpose default: ChatGPT
ChatGPT is most people's first stop, and it does more here than it used to. Its data-analysis mode runs Python on your uploaded Excel or CSV, answers with charts and tables, and lets you expand and read the exact code it ran — so the working is genuinely on show. Beyond that, OpenAI now documents a file-creation workflow: on its newer surfaces ChatGPT can take a dataset through analysis and produce a stakeholder-ready report with charts and caveats, and create documents, slides, and spreadsheets. Which of those you get depends on the surface and plan you're on, so confirm the file-creation feature is available to you before you rely on it. Pricing runs from a free tier through paid Go, Plus, Pro, and per-seat Business plans; OpenAI's exact figures render client-side, so they aren't asserted here.
What to weigh is consistency and control. The analysis is excellent and inspectable, but how polished and repeatable the finished document is still depends on your prompts and the surface you use, so try it on your own file and workflow. When you want a report built for you with layout you control by default, the report-first tools below do more of that up front. (If your real question is which tool best analyzes a spreadsheet rather than reports on it, that's a different comparison — see AI tools to analyze CSV files and AI for analyzing Excel files.)
04Report-first, with traceable numbers: Julius AI
Julius AI is built around the analysis, and it treats the written report as a first-class output. Point it at a workbook — CSV, Excel, multi-tab files you reference tab by tab — and it runs real analysis code, then composes a sectioned report with an executive summary, findings, and recommendations, the charts and figures drawn from your data. Because it runs code first and writes second, the numbers trace back to the source, and its Notebooks let you read the steps it took. You can publish the report to a link or download it, export slide decks and charts, and send results back out to Excel or CSV. Free access covers CSV and Excel; paid plans start at $20 per month ($16 billed annually) for Plus and $45 for Pro, mostly buying more monthly credits and memory for bigger files.
The caveat to check before you commit is the exact export format for your deliverable: Julius's published exports lean toward its own report link, slides, HTML, and spreadsheet data rather than a formatted Word or PDF corporate document, so if your stakeholder expects a branded PDF, confirm that path fits your workflow. For a report where the reasoning and the numbers matter as much as the layout, it's one of the strongest picks here.
05One-click reports and decks: Powerdrill
If what you want is a finished report or deck with the least effort, Powerdrill is the most one-click tool in this group. Upload an Excel or CSV file — up to ten at once — and its report generator builds a structured data report around a set of predefined questions you can customize, each with AI insights and visualizations, then lets you download it as Word, PDF, or Markdown, convert it to PowerPoint in a click, or open it in Notion or Google Docs. Its free tier runs on a daily credit allowance; the Pro tier is $16.58 per month billed annually — about $199 a year.
It's quicker than the code-first tools, and more transparent than "one click" might suggest: Powerdrill's documented Data Analysis steps show the code it plans, generates, and runs, so you can follow the analysis path behind a figure. Where it asks for a little more trust than an analyst tool is in how closely that path sits next to each number in the finished report, which is worth checking against how much scrutiny your report will get. For a good report fast, with a traceable path, it's a strong pick.
06Visible code plus formatted output: Formula Bot
Formula Bot began as a spreadsheet-formula assistant and is now a fuller data-analysis and reporting tool. Upload Excel, CSV, or other formats, ask in plain language, and it returns results and charts — and, notably, shows the exact Python, SQL, or R it generated for each request, so the working is on view. It also generates formatted reports and slide decks, with .docx and .pptx export, inline charts, and Excel/CSV/PDF exports, and adds Brand Kits and report and dashboard workflows for on-brand, repeatable output. Paid plans start at $18 per month (Starter) and $29 per seat (Max); the free tier is usable for small files but capped at 5 MB and ten messages a month.
That combination — visible generated code alongside formatted, branded report output — puts Formula Bot closer to the report-first tools than its lightweight origins suggest. The free tier's limits make it a try-before-you-buy for anything beyond a small file, but on capability it belongs in the same conversation as the others here.
07If you already live in Microsoft 365: Copilot
Copilot is the natural pick if your team already runs on Microsoft 365, and it does more than assist inside a single app. Copilot in Excel analyzes the workbook you have open — generating formulas, insights, and charts — and works most reliably when your data is an Excel Table rather than a loose range. And Microsoft now documents Word, Excel, and PowerPoint Agents in Copilot Chat that can create finished Office files from a prompt and the content you reference, so building the report is less of a manual, app-by-app job than it used to be. How cleanly it turns raw spreadsheet data into the exact report you want still varies, so try it on your file. On price, read the two paths carefully: for eligible existing Microsoft 365 Business customers there's an $18-per-user-per-month add-on (annual, through September 2026), and an Enterprise add-on at $30 per user per month — both on top of a paid Microsoft 365 subscription.
Its strengths are familiarity and staying inside the tools your team already uses, and its output lands as native Office files you can inspect and edit. If your data lives in Excel and your stakeholders expect Word or PowerPoint, it fits well; if you're starting from a raw CSV, try the Excel-to-report path on your own data first. The same is true of spreadsheet-native assistants like Rows AI and Gemini in Google Sheets: they're strong at co-authoring and in-grid analysis, but they produce a living spreadsheet, not a finished exported report.
08When the numbers have to stay inspectable: Anomaly AI
Several of the tools above now show their working — the code, the steps, or the analysis path — which is a real shift. Where Anomaly AI aims to go further is keeping the whole chain open and consistent: not just the code behind one answer, but the queries, filters, assumptions, calculations, metric definitions, and business rules behind a report you'll run again — and doing it from connected sources, not only uploads.
Anomaly is an AI data analyst. You upload Excel or CSV files up to 1GB, or connect a source like Google Sheets, BigQuery, or a database, ask in plain language for what you need, and it turns the result into a reviewable dashboard, an Excel report or export, a PowerPoint deck, a Word document, or a PDF — there's a step-by-step guide to turning an upload into a reviewed, client-ready PDF. What distinguishes it for a recurring stakeholder report is that the working stays open and reusable: you can inspect the queries, filters, assumptions, and calculations before it goes out, and it preserves your metric definitions and business rules so the same report stays consistent next time. An uploaded file is a snapshot — it reflects the data you uploaded until you upload a fresh copy — so think of Anomaly as turning a dataset into a defensible, repeatable report rather than a live feed. The free tier lets you try it, Pro is $25 per month, and the Team plan is $45 per seat per month with a two-seat minimum, so $90 per month.
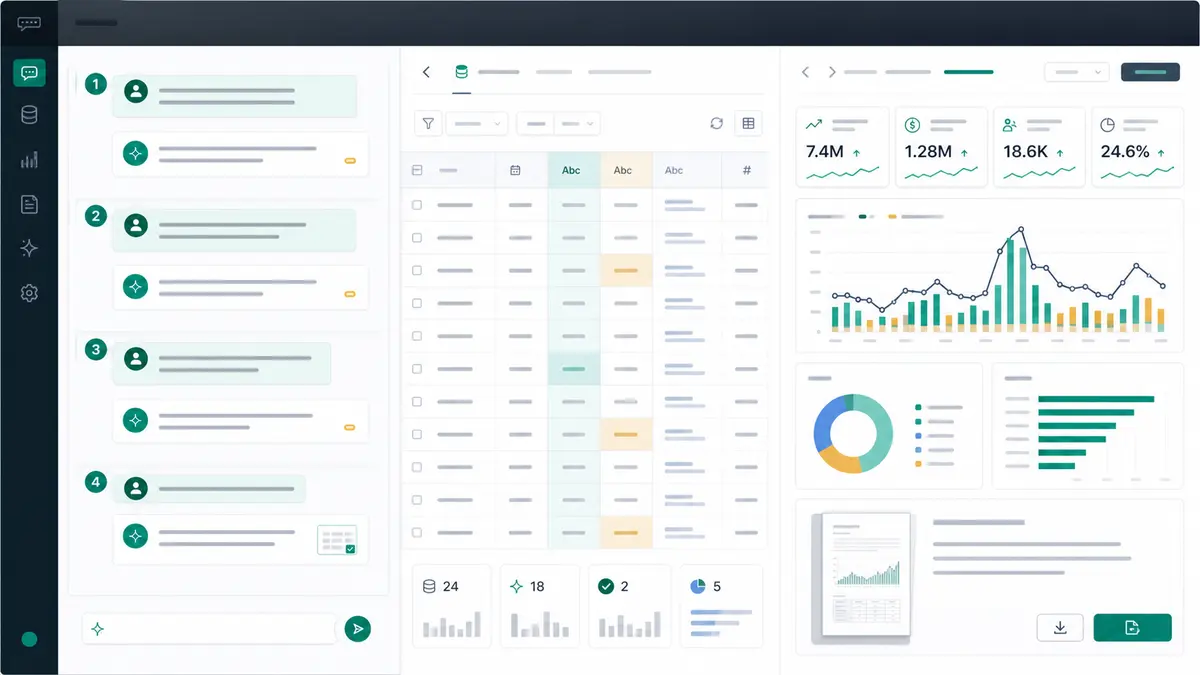
A dashboard Anomaly built from an uploaded CSV
First-party Anomaly AI product screenshot; figures are illustrative sample data. Uploading a marketing CSV and asking for a dashboard produced these KPI cards, a sessions-by-channel bar chart, and a revenue-share donut — each figure traceable to the source file. Anomaly AI.
What "reviewable" actually looks like
Illustrative. Several of these tools show their working in some form; Anomaly keeps the query, filters, and source rows tied to each figure — and preserves your definitions and business rules — so a recurring report stays checkable. Anomaly AI.
Be clear about where Anomaly isn't the fit. It isn't a spreadsheet you co-author cell by cell, an office suite, or a design-first document tool; it isn't a real-time or streaming system, an automatic anomaly detector, or a forecasting engine; and despite the name it doesn't hunt for anomalies on its own or promise a root cause. If you need native spreadsheet editing, a beautifully designed one-off document, or a full BI deployment, look elsewhere. Reach for it when the binding job is a recurring report whose figures — and the definitions behind them — have to stay inspectable.
09Match the tool to your output
A strong, inspectable analysis you shape into the report
ChatGPT.
A sectioned written report with the code behind it
Julius AI.
A polished report or deck fast, with a traceable path
Powerdrill.
Formatted reports with the generated code on view
Formula Bot.
Finished Office files, inside Microsoft 365
Microsoft 365 Copilot.
A recurring report whose definitions and numbers stay inspectable
Anomaly AI.
Before you pick, be honest about the deliverable and the scrutiny it'll get. If it's an internal analysis, a general-purpose tool or a quick exporter is plenty. If it's a document a stakeholder will act on, weigh how much of the report you want built for you against how much of the working you need on show — and check both on your own file, since the tools have converged and the differences are now in the details. If you're really after a live dashboard or a recurring, self-updating report rather than a one-time document, that's a different job — see automated reporting tools for small teams and AI tools to generate dashboards from Excel.
FAQFrequently asked questions
What's the best AI tool to turn an Excel or CSV file into a report?
It depends on the report you owe someone and the scrutiny it'll get. For a strong, inspectable analysis you shape into a report, ChatGPT. For a sectioned written report with the code behind it, Julius AI. For a polished report or deck fast with a traceable path, Powerdrill. For formatted reports with the generated code on view, Formula Bot. If you already work in Microsoft 365, Copilot can create finished Office files. And for a recurring report whose queries, definitions, and figures stay inspectable, an AI data analyst like Anomaly AI.
Can ChatGPT create a finished report from a spreadsheet?
Yes, more than it used to. ChatGPT analyzes an uploaded Excel or CSV file and lets you read the exact Python it ran, and OpenAI now documents a file-creation workflow that can produce a stakeholder-ready report and create documents, slides, and spreadsheets. Availability depends on your surface and plan, and how polished and repeatable the document is still depends on your prompts — so confirm the feature is available to you and try it on your own file.
Which AI report generators let me check the numbers before I send?
More of them than you might expect. ChatGPT and Julius show the exact code behind the analysis; Formula Bot shows the generated Python, SQL, or R; and Powerdrill documents its analysis steps. They differ mainly in how closely that working sits next to each figure in the finished report. Anomaly AI keeps the queries, filters, calculations, and your metric definitions inspectable across a report you run again. If the report will be scrutinized, weigh how much of the trail each one keeps open.
Is a free AI report generator good enough?
For a small file and an internal audience, often yes. ChatGPT, Julius, Formula Bot, and Powerdrill all have free tiers. The catch is limits: free plans cap file size (Formula Bot at 5 MB), messages, or daily credits, so a large workbook or a long report will usually push you to a paid plan. Try the free tier on your actual file before you decide.
Does it matter whether my data is in Excel or CSV?
Most of these tools accept both, so the format matters less than the shape. Watch three things: how the tool handles a multi-tab workbook (some want you to reference tabs by name), the practical size limit for your file, and any prep it expects — Microsoft 365 Copilot, for instance, works most reliably when your data is a proper Excel Table rather than a loose range. A clean single table exports more predictably than a sprawling, merged-cell workbook.
—The bottom line
The best AI report generator for Excel and CSV data is the one that fits the report you owe someone and the scrutiny it'll get. For a fast internal analysis, ChatGPT or Formula Bot; for a written report with the code behind it, Julius; for a polished report or deck quickly, Powerdrill; inside Microsoft 365, Copilot. And when the report is recurring and every figure has to stay inspectable — the queries, the definitions, the business rules — that's the job Anomaly AI is built for: bring your Excel or CSV data, get a report you can trace and reuse, and start free.
Founder, Anomaly AI (ex-CTO & Head of Engineering)
Abhinav Pandey is the founder of Anomaly AI, an AI data analysis platform built for large, messy datasets. Before Anomaly, he led engineering teams as CTO and Head of Engineering.