
Tools & Comparisons
18 min
ChatGPT vs Claude vs Gemini for Data Analysis
Choose an AI app for a spreadsheet analysis you can check, reproduce and hand over. Compare the calculations and the file you actually receive.
Read More
Tools & Comparisons — Comparison · 2026
Compare eight AgencyAnalytics alternatives on client portals, white-label delivery, current roster cost, migration work, and the reporting job each one actually fits.
 17 min read
Which AgencyAnalytics alternative fits your agency?
A cheaper subscription can still mean an expensive switch: rebuilding reports, reconnecting sources and moving client access. Compare that work alongside the features you need. For the wider category, see our client reporting tools comparison.
Testing coverage varies. Anomaly, our product, completed the historical synthetic-file task; Klipfolio did not complete its native cross-source calculation; Whatagraph's test was not completed. Other products have partial runs or documentation-only coverage. Incomplete or unperformed tests do not show that a product lacks a capability or performs poorly.
The shared task uses synthetic data and a predefined answer key visible to the tester. Matching it demonstrates that result for that dataset and task, not universal accuracy, production reliability or every reporting scenario. File uploads do not verify live connectors; creating a report does not verify sharing, scheduling or delivery.
Historical scoring combined observed behaviour and documented capabilities. Because point allocations are not fully reconciled, overall scores are withheld. Evidence labels below describe coverage, not standardized, independently verified rankings.
Monthly equivalents model 10, 25 or 50 clients, each with GA4, Google Ads and Search Console. Plans, account/dashboard limits, sources, branding, destinations, billing and enterprise quotes affect costs. Calculated estimates are not guaranteed quotes; unpublished configurations and conflicting tariffs require confirmation. License-only figures exclude operating costs. Anomaly's credit estimate does not establish a connected reporting workflow.
AgencyAnalytics is the baseline; alternatives follow alphabetically.
Scroll sideways to see every column.
| Criterion | AgencyAnalytics (baseline) | Anomaly | DashThis | Databox | Klipfolio | Looker Studio | Supermetrics | Swydo | Whatagraph |
|---|---|---|---|---|---|---|---|---|---|
| Client delivery | White-label portal, custom domain, scheduled reports | Share link, PDF, scheduled email; no white-label portal | White-label dashboards, custom domain and sender, scheduled email | Shared dashboards; branding is an add-on | Published links, scheduled PDF; white-labeling included in agency Pro/Premier | Share link and scheduled PDF; no native agency portal | Depends on the destination; no standalone client portal in this comparison | White-label reports, portal, custom domain, scheduled delivery | White-label reports and automated PDF email |
| Price basis | Core: $20/client/month annually; 25+ discounts unpublished | Not directly comparable: Pro $20/month annually; illustrative 50 ten-card dashboards, 20 workbooks and 100 insights ≈715 credits | Professional $139/month annually: 10 dashboards, 40 sources | Agency from $79/month annually, plus packs/branding; custom quote required | Pro $440/month annually: 30 clients and 30 dashboards; source capacity unverified | Standard: $0 license only; not directly comparable | Official annual tariffs conflict: Starter $39/$44, Growth $159/$177; custom quote required | Calculated $143.10/month annually for 30 sources/10 clients, USD | Max from €699/month annually: 50-credit minimum; custom domain excluded |
| Migration burden | None if you stay | Rebuild analysis and delivery; client portal changes | Reconnect sources and rebuild or template dashboards | Reconnect accounts and rebuild dashboards and metrics | Rebuild models, dashboards, sharing, and branding | Manual rebuild, permissions, and connector maintenance | Rebuild the destination report as well as data transfers | Reconnect each account and map templates to new reports | Reconnect sources, rebuild blends and templates, move client access |
| Best fit | Turnkey agency reporting across many sources | Reports from exports whose calculations need review | Branded dashboards with one report per client | Cross-client KPI monitoring with a separate branding budget | Teams wanting detailed control over custom dashboards | Google-centered teams able to own the reporting layer | Agencies keeping their reporting layer and changing data plumbing | Many clients with a small, consistent source count | Larger teams consolidating many marketing sources |
| Evidence coverage | Partially verified: September matched; report incomplete; delivery documented only | Partially verified: historical file task completed; live refresh and scheduled delivery unverified | Partially verified: manual calculation matched; Search Console and delivery untested | Partially verified: CSV-text report; live dashboard untested | Partially verified: imported summary displayed; native calculation incomplete | Partially verified: September/August matched; wider report and delivery incomplete | Partially verified: Ads import only; destination report incomplete | Documentation-based: trial gated; no data entered | Documentation-based: test not completed |
Apply these six checks before comparing prices.
Client B contains 90 days of synthetic Google Analytics 4 (GA4) channels, Google Ads campaigns and Search Console queries, supplied as CSV files. GA4 key events are configured important actions; this task uses Paid Search events.
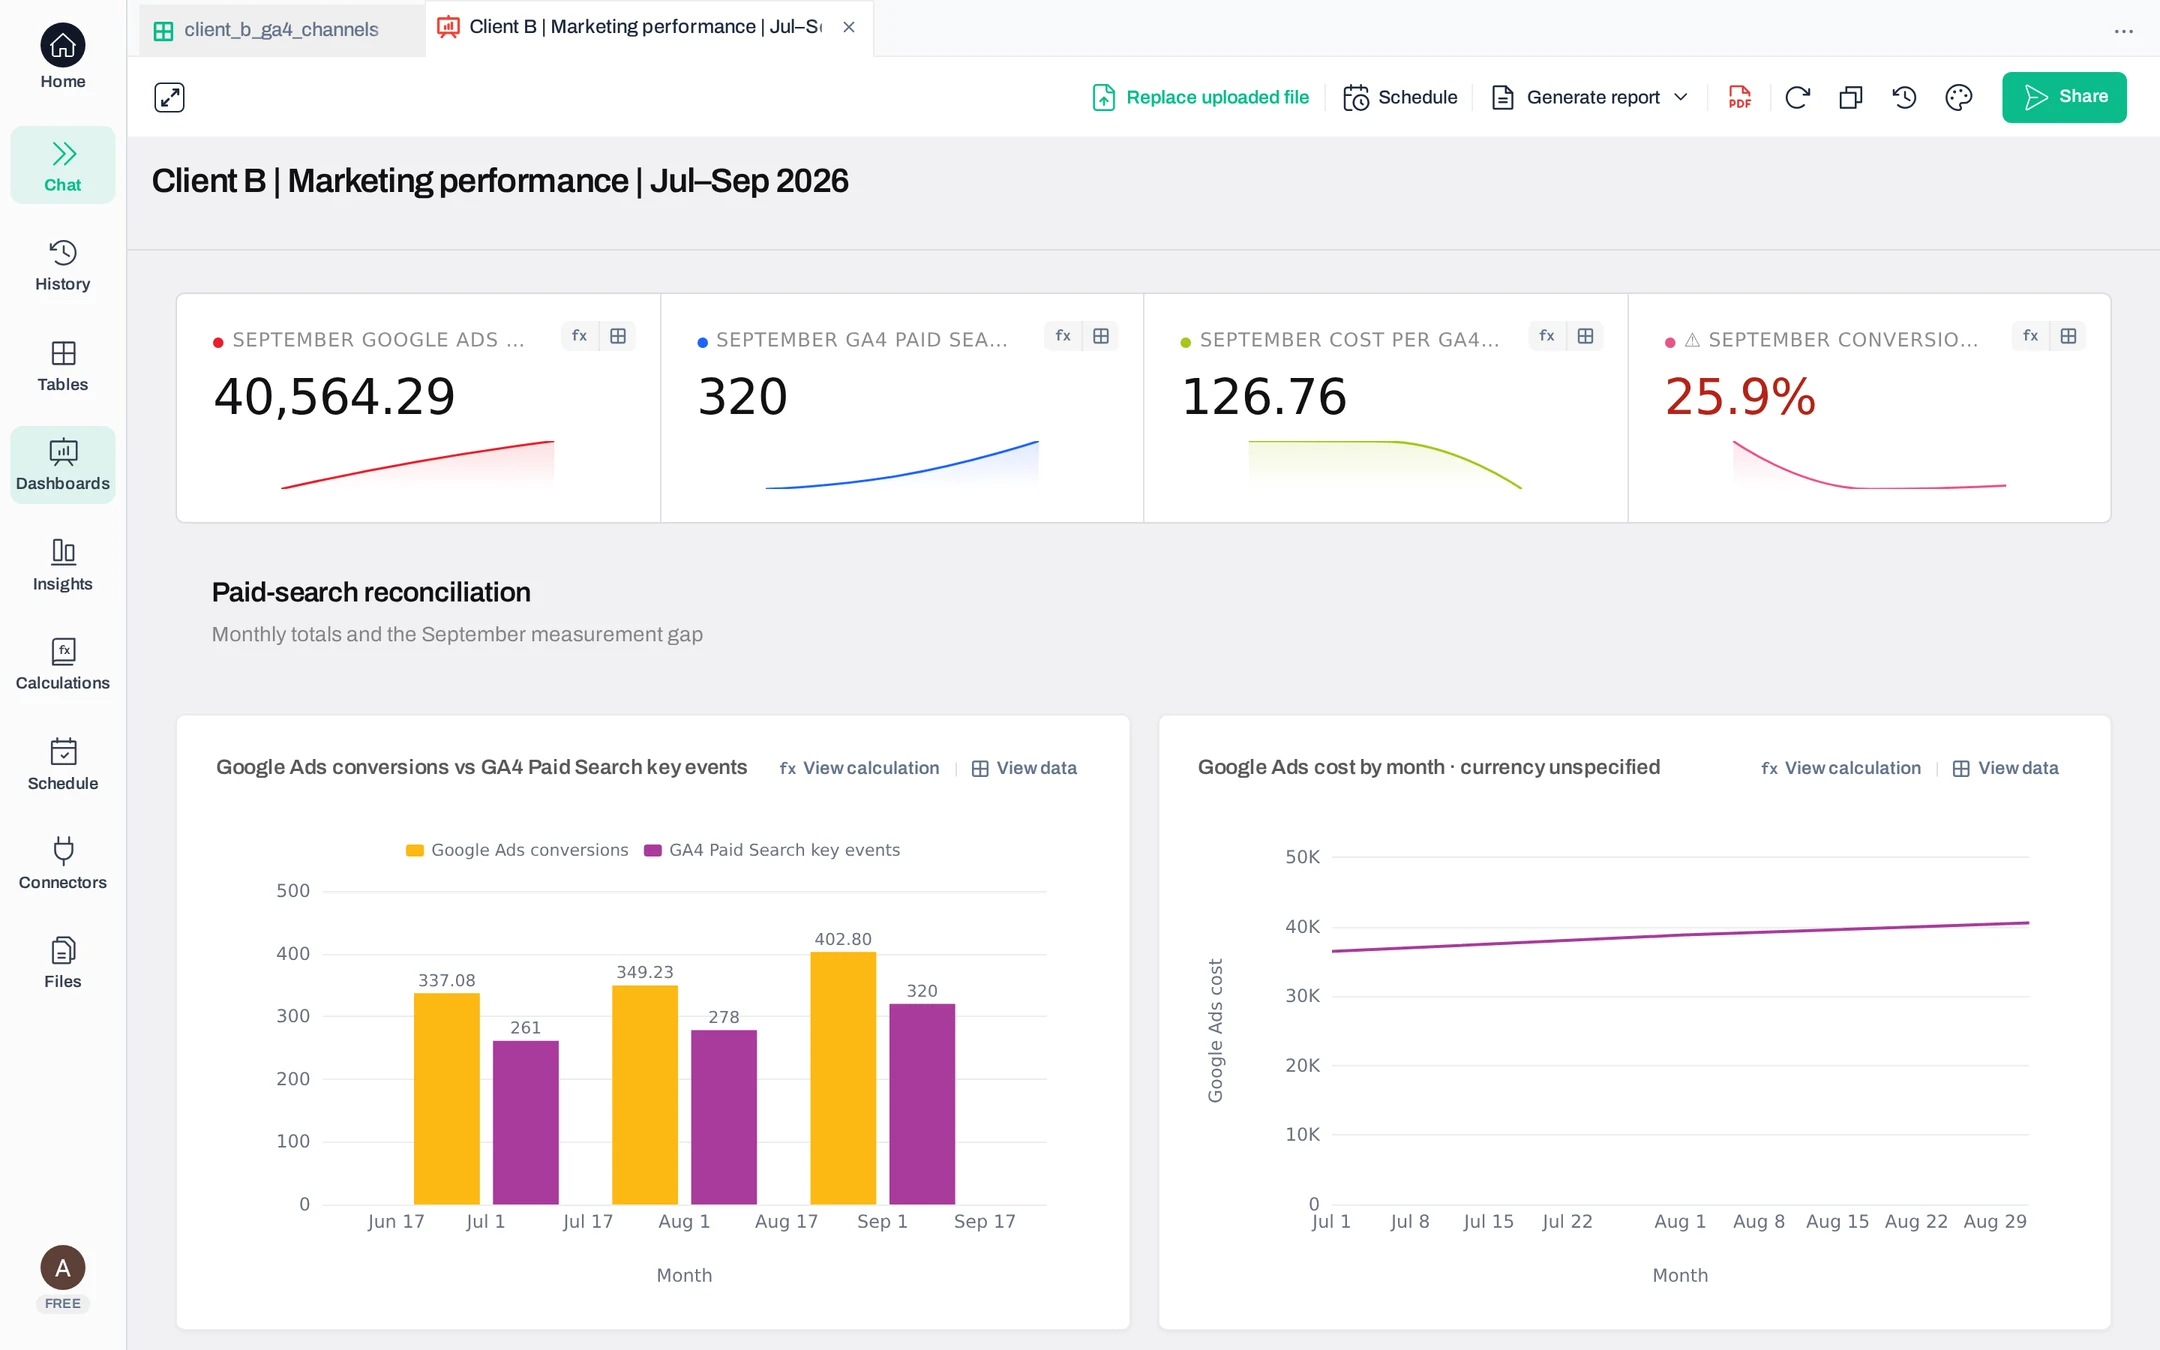
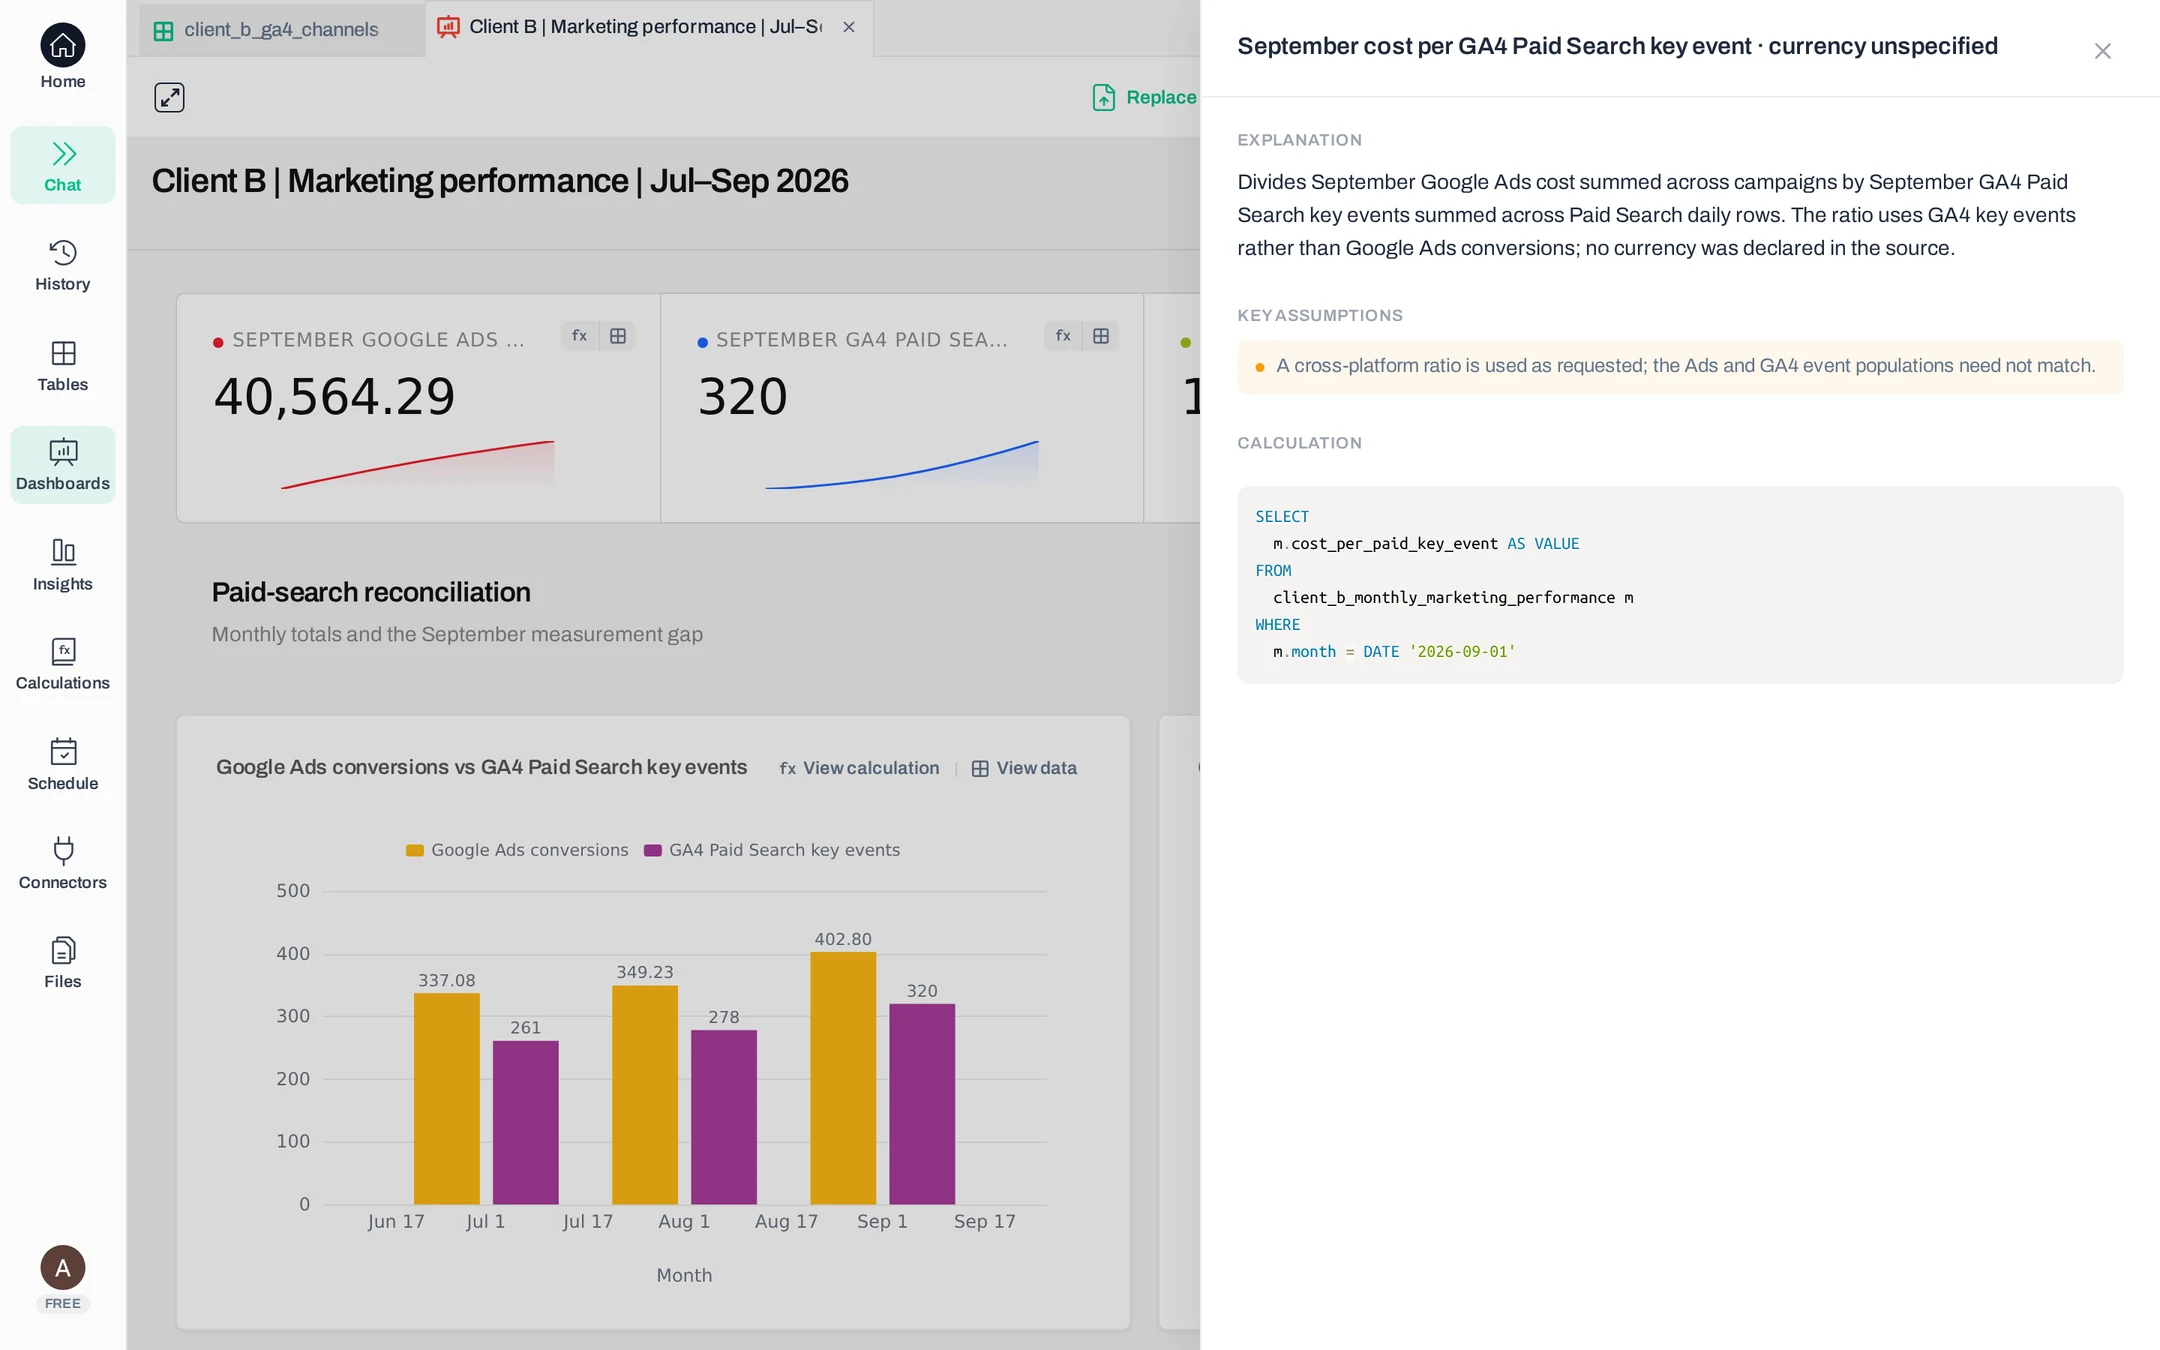
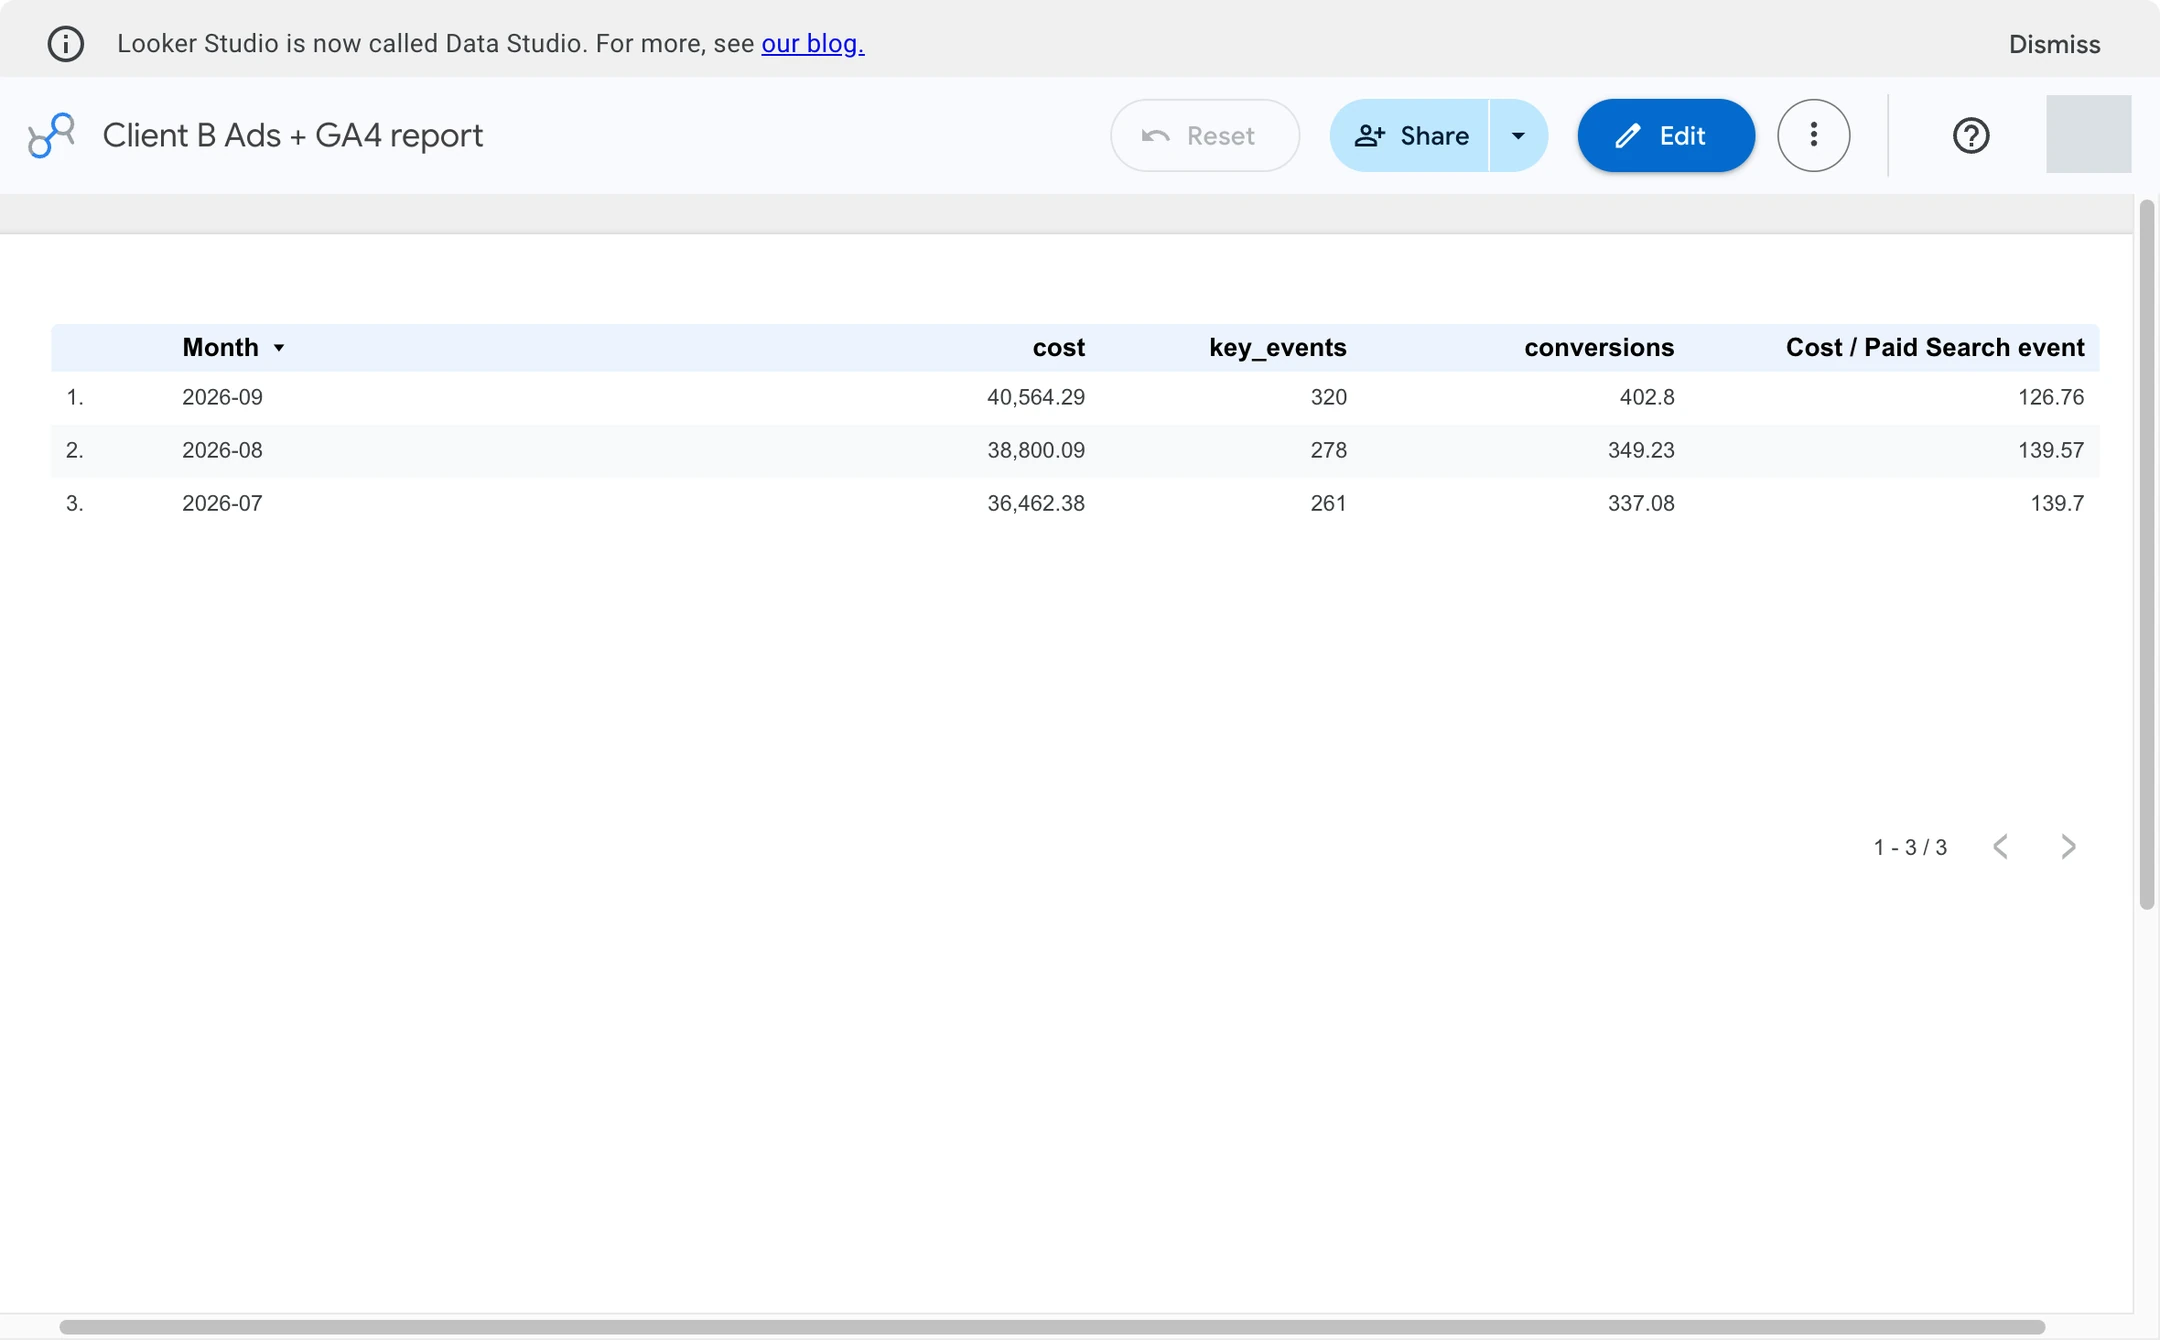
The requested ratio is Ads spending ÷ GA4 Paid Search key events: September 40,564.29 ÷ 320 = 126.76; August 139.57. Other requirements: source breakdowns, delivery and identifying the planted 25.9% difference between conversion counts. Four historical runs matched September; wider coverage differed. The difference alone does not establish a tracking error or its cause.
The historical rubric assigned 0–5 points per category using these anchors:
The records do not consistently reconcile with those anchors. AgencyAnalytics received 3 for setup without a defined 3-point rule; it and DashThis received 5 for delivery from pricing pages, not completed sends. Anomaly created a schedule without verifying delivery; Looker Studio's scheduled email was not built. These records cannot support comparable overall totals. The linked run records preserve the original allocations for review.
Anomaly, AgencyAnalytics and DashThis used trials; Looker Studio used the free service and manual construction. Later captures are unscored; vendor illustrations are labelled.
AgencyAnalytics' Core plan is USD $20/client/month billed annually, including unlimited sources, reports, dashboards, staff/client users, a white-label portal, custom domain/email, scheduling, bulk operations and version history. Multiplying by 10/25/50 gives $200/$500/$1,000 monthly equivalents. The latter two are undiscounted list-price estimates: 25+ volume discounts are unpublished.
Stay when clients use their portals, staff rely on bulk operations and connected sources justify the price. Alternatives may charge separately for accounts, branding and a reporting destination.
AgencyAnalytics' AgencyAI assistant returned 126.76 from three uploaded files and showed the formula and equivalent queries. It missed August, left channel/campaign tables unfinished and used a Search Console placeholder. That is one synthetic run, not a verdict on connected reporting. Read the exact AgencyAnalytics run record.
In our unblinded file test, Anomaly built Client B's dashboard from three exports in about 2.3 minutes, matched the requested values, identified the 25.9% difference in conversion counts and exposed the formula and query. The Trial workspace produced a PDF and share link; a weekly schedule was created, then deleted, without verifying scheduled delivery. Read the exact Anomaly run record.
The fresh Free-account development captures verify tables, values and calculation explanations; they do not repeat the historical timing, score or delivery test.
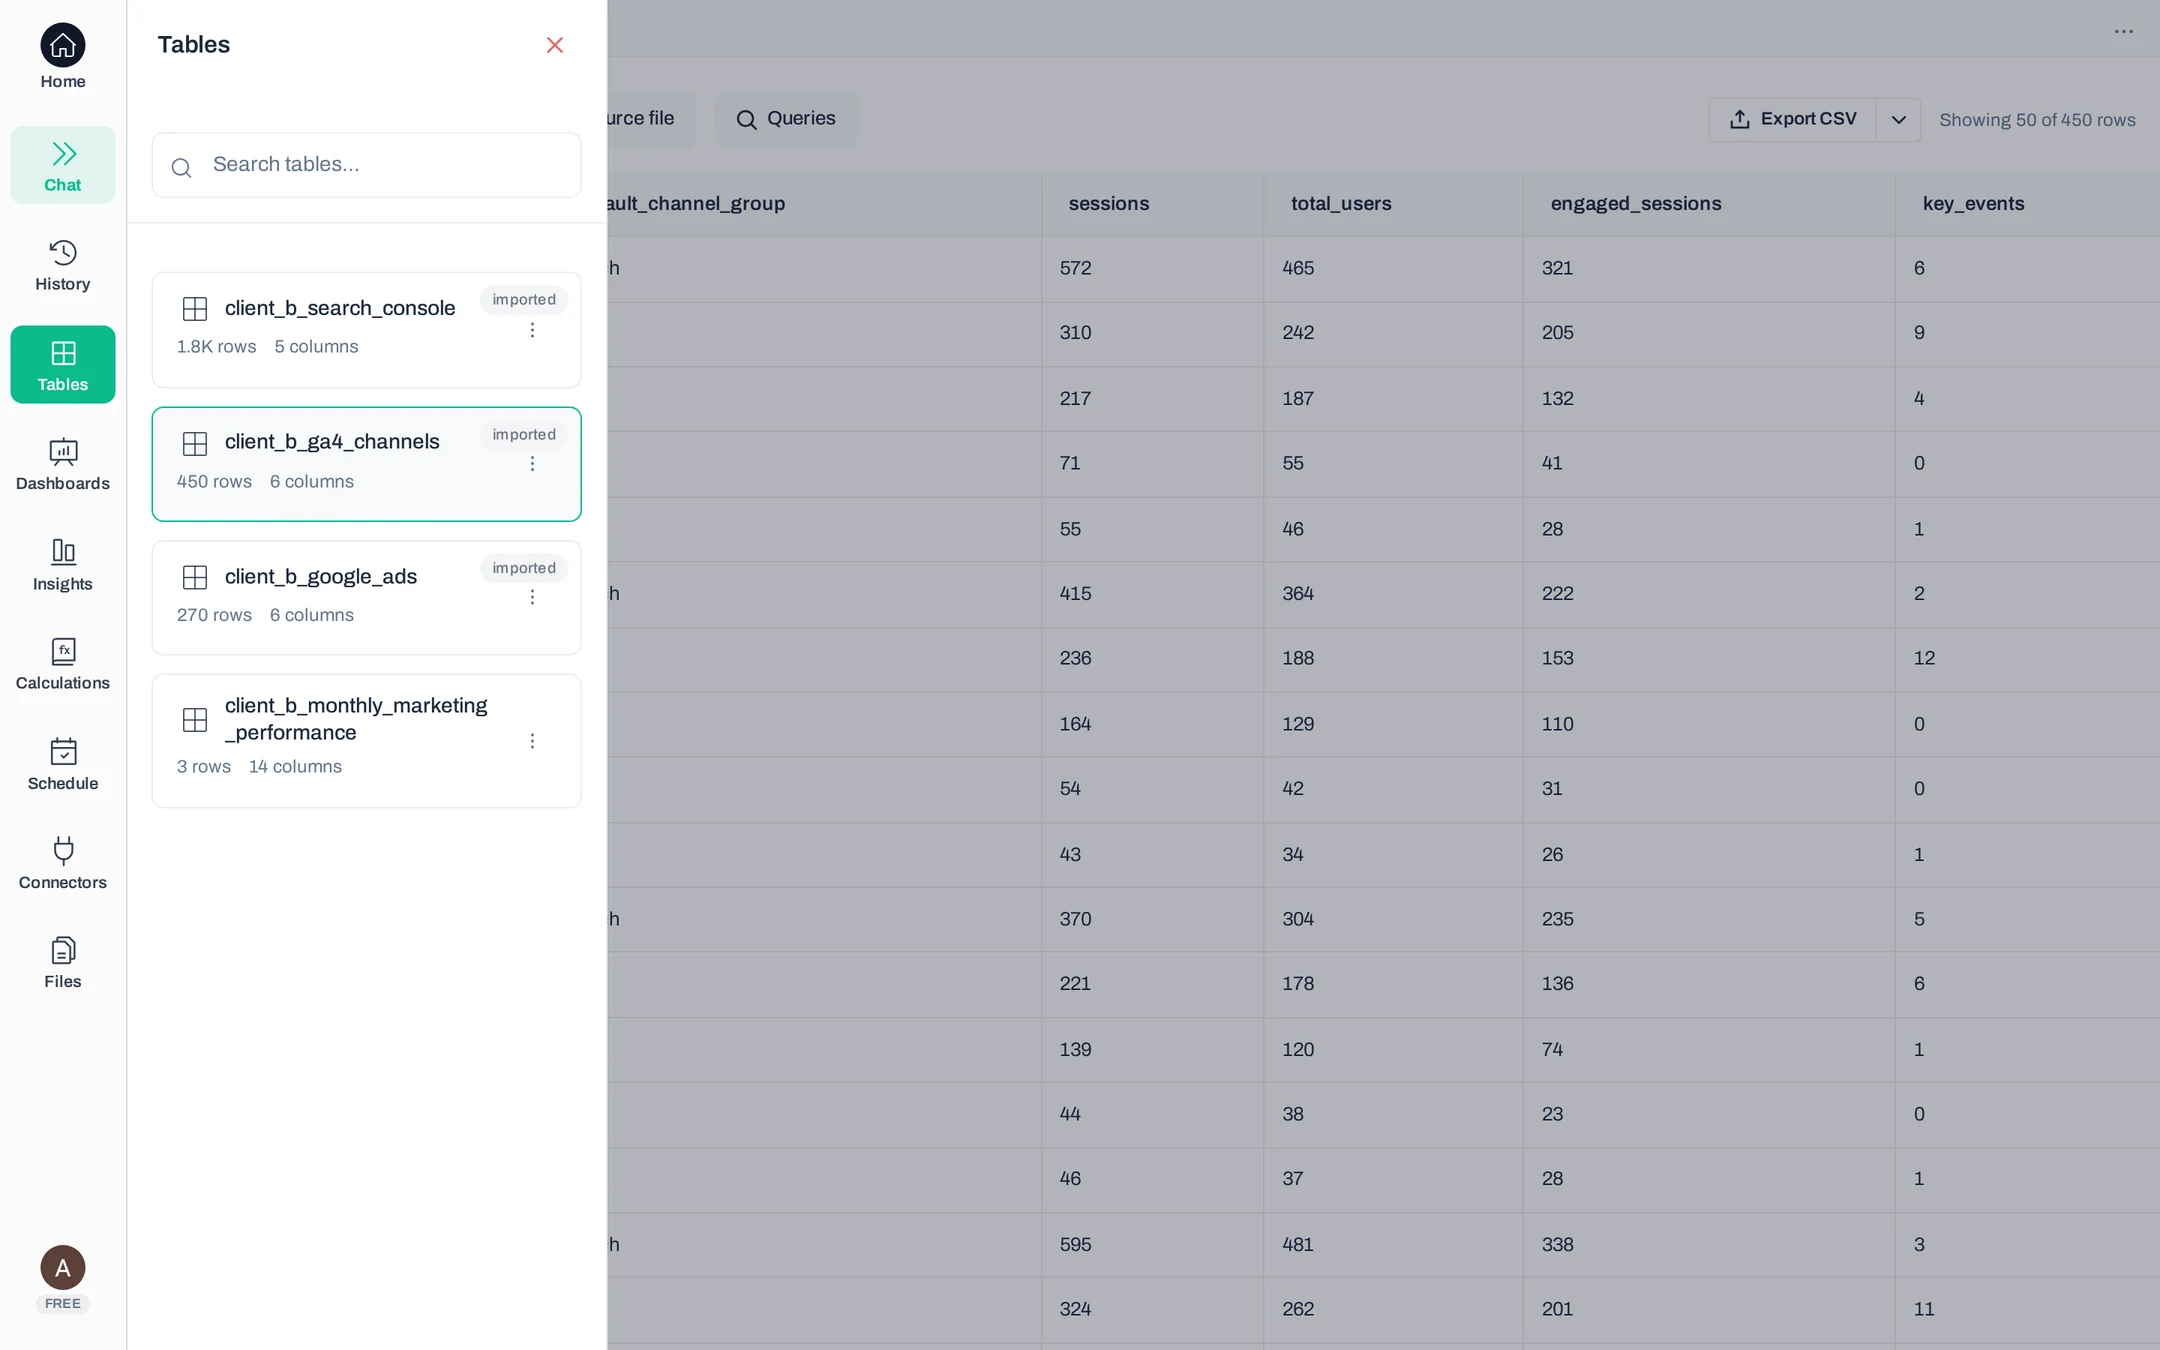
Fresh Anomaly development preview test screenshots · 27 October 2026 · synthetic Client B data
Imported Client B source tables
September result and difference in conversion counts
Calculation explanation and query
Ask Anomaly for dashboards, workbooks, slides, PDFs or insights, then refine them through conversation. Branded client logins and an agency portal need a separate solution.
Pro is $25 monthly or $20/month billed annually ($240 upfront). Annual Pro grants 12,000 credits upfront, equivalent to 1,000/month. Our illustrative file-work mix is 50 ten-card dashboards, 20 Excel workbooks and 100 chart-based insights: 50×7.5 + 20×7 + 100×2 = 715 credits, leaving 285. These per-task estimates vary; extra questions, revisions, checks and scheduled runs consume credits too.
These estimates aren't task limits. You can use your entire credit allowance for any supported task, in whatever mix you need.
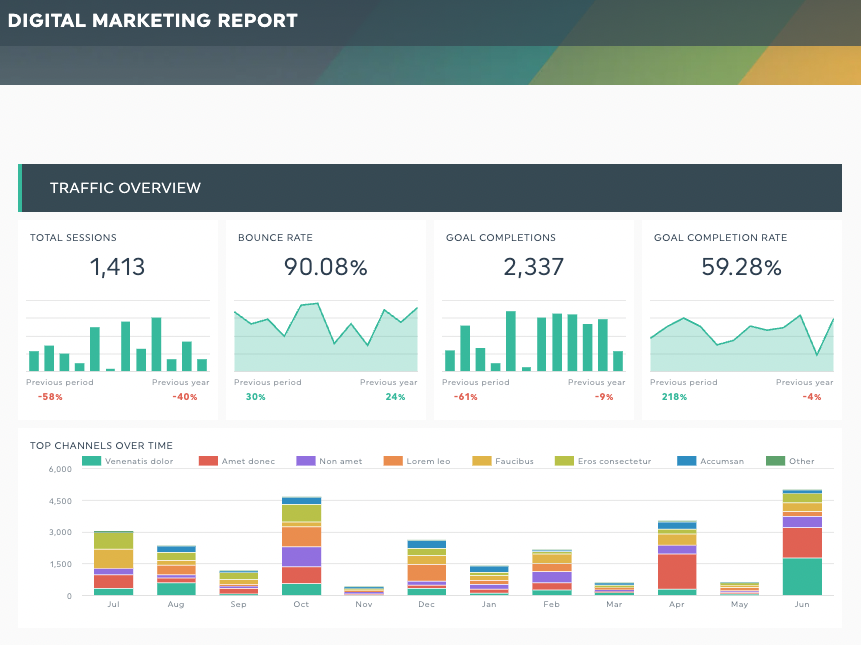
DashThis returned 126.76 after roughly 60 manual entries and clicks on its 14-day trial. We uploaded Ads and GA4 files and built a calculated widget from their totals. Search Console was not loaded; source rows needed another table. Delivery was not tested. Read the exact DashThis run record.
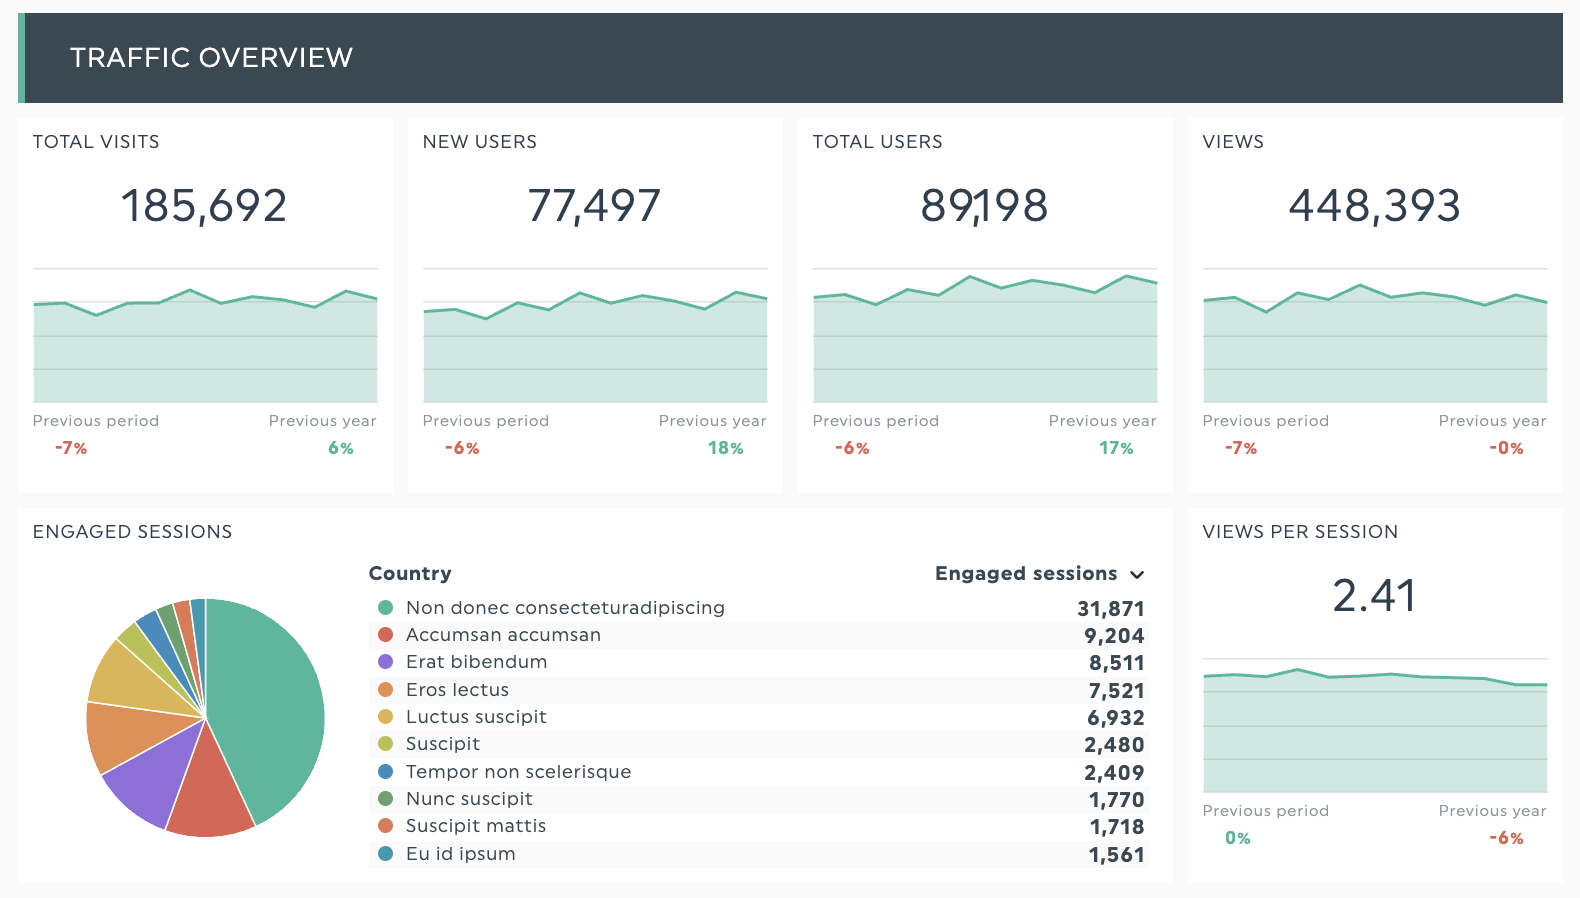
Official DashThis product images · retrieved 30 October 2026 · vendor examples, not our test
GA4 traffic overview
Digital marketing report
Branded dashboard example
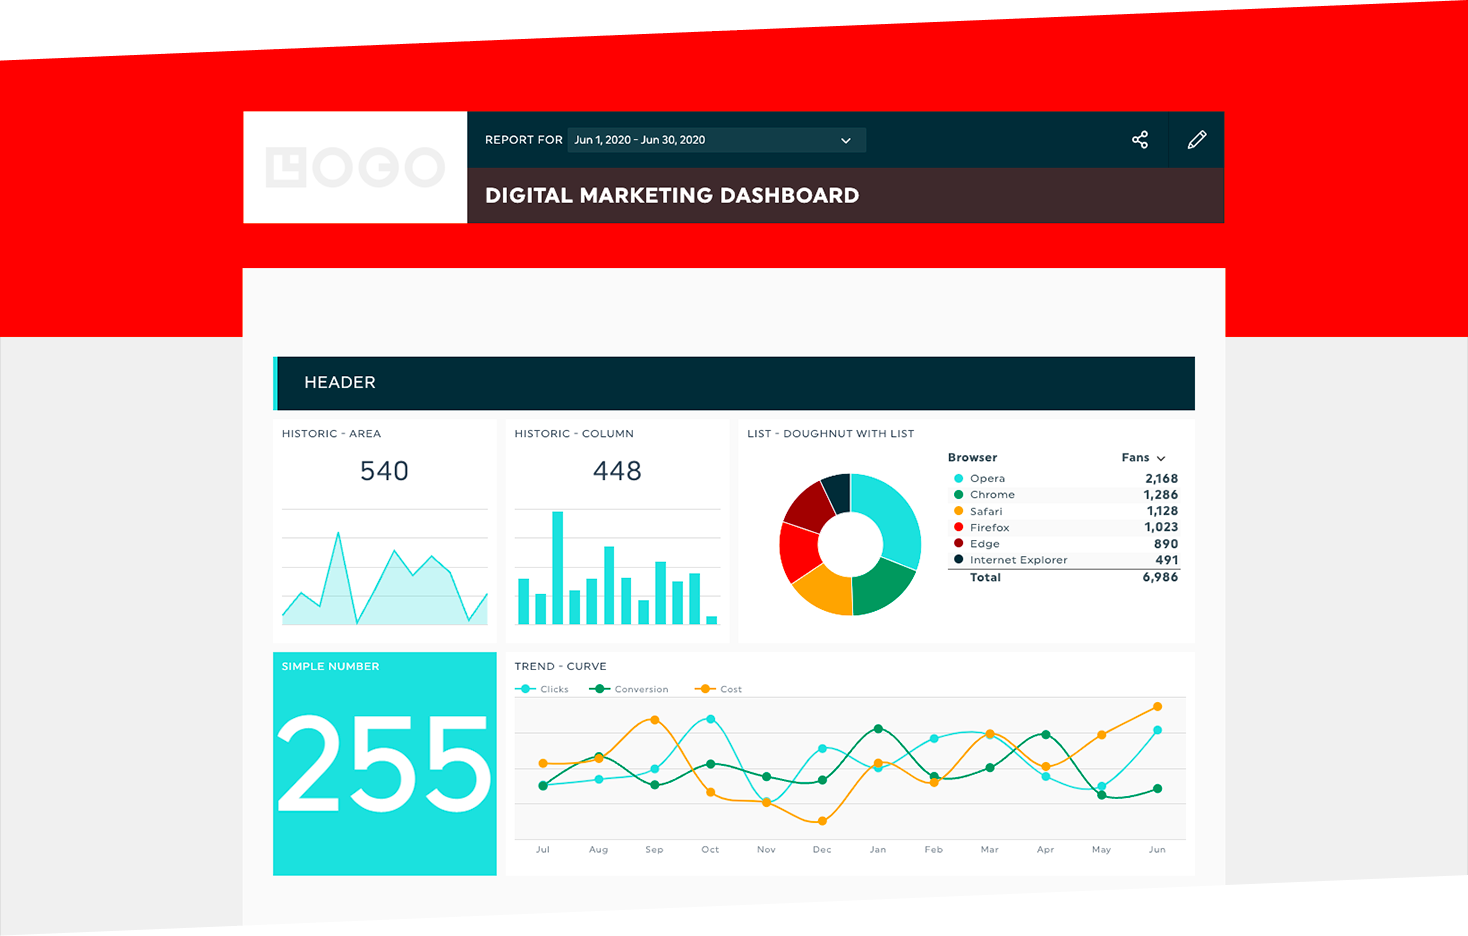
DashThis publishes white-label dashboards, custom domains and sender email, scheduled emails, PDFs and reusable templates. We built Client B manually; template reuse remains untested.
DashThis annual plans: Professional $139/month (10 dashboards/40 sources), Business $279 (25/100), Standard $429 (50/200). One dashboard/client needs 30/75/150 sources, within those allowances; branding and scheduled email are included. The $44 Individual plan has only three dashboards. Optional AI Insights Pro is excluded.
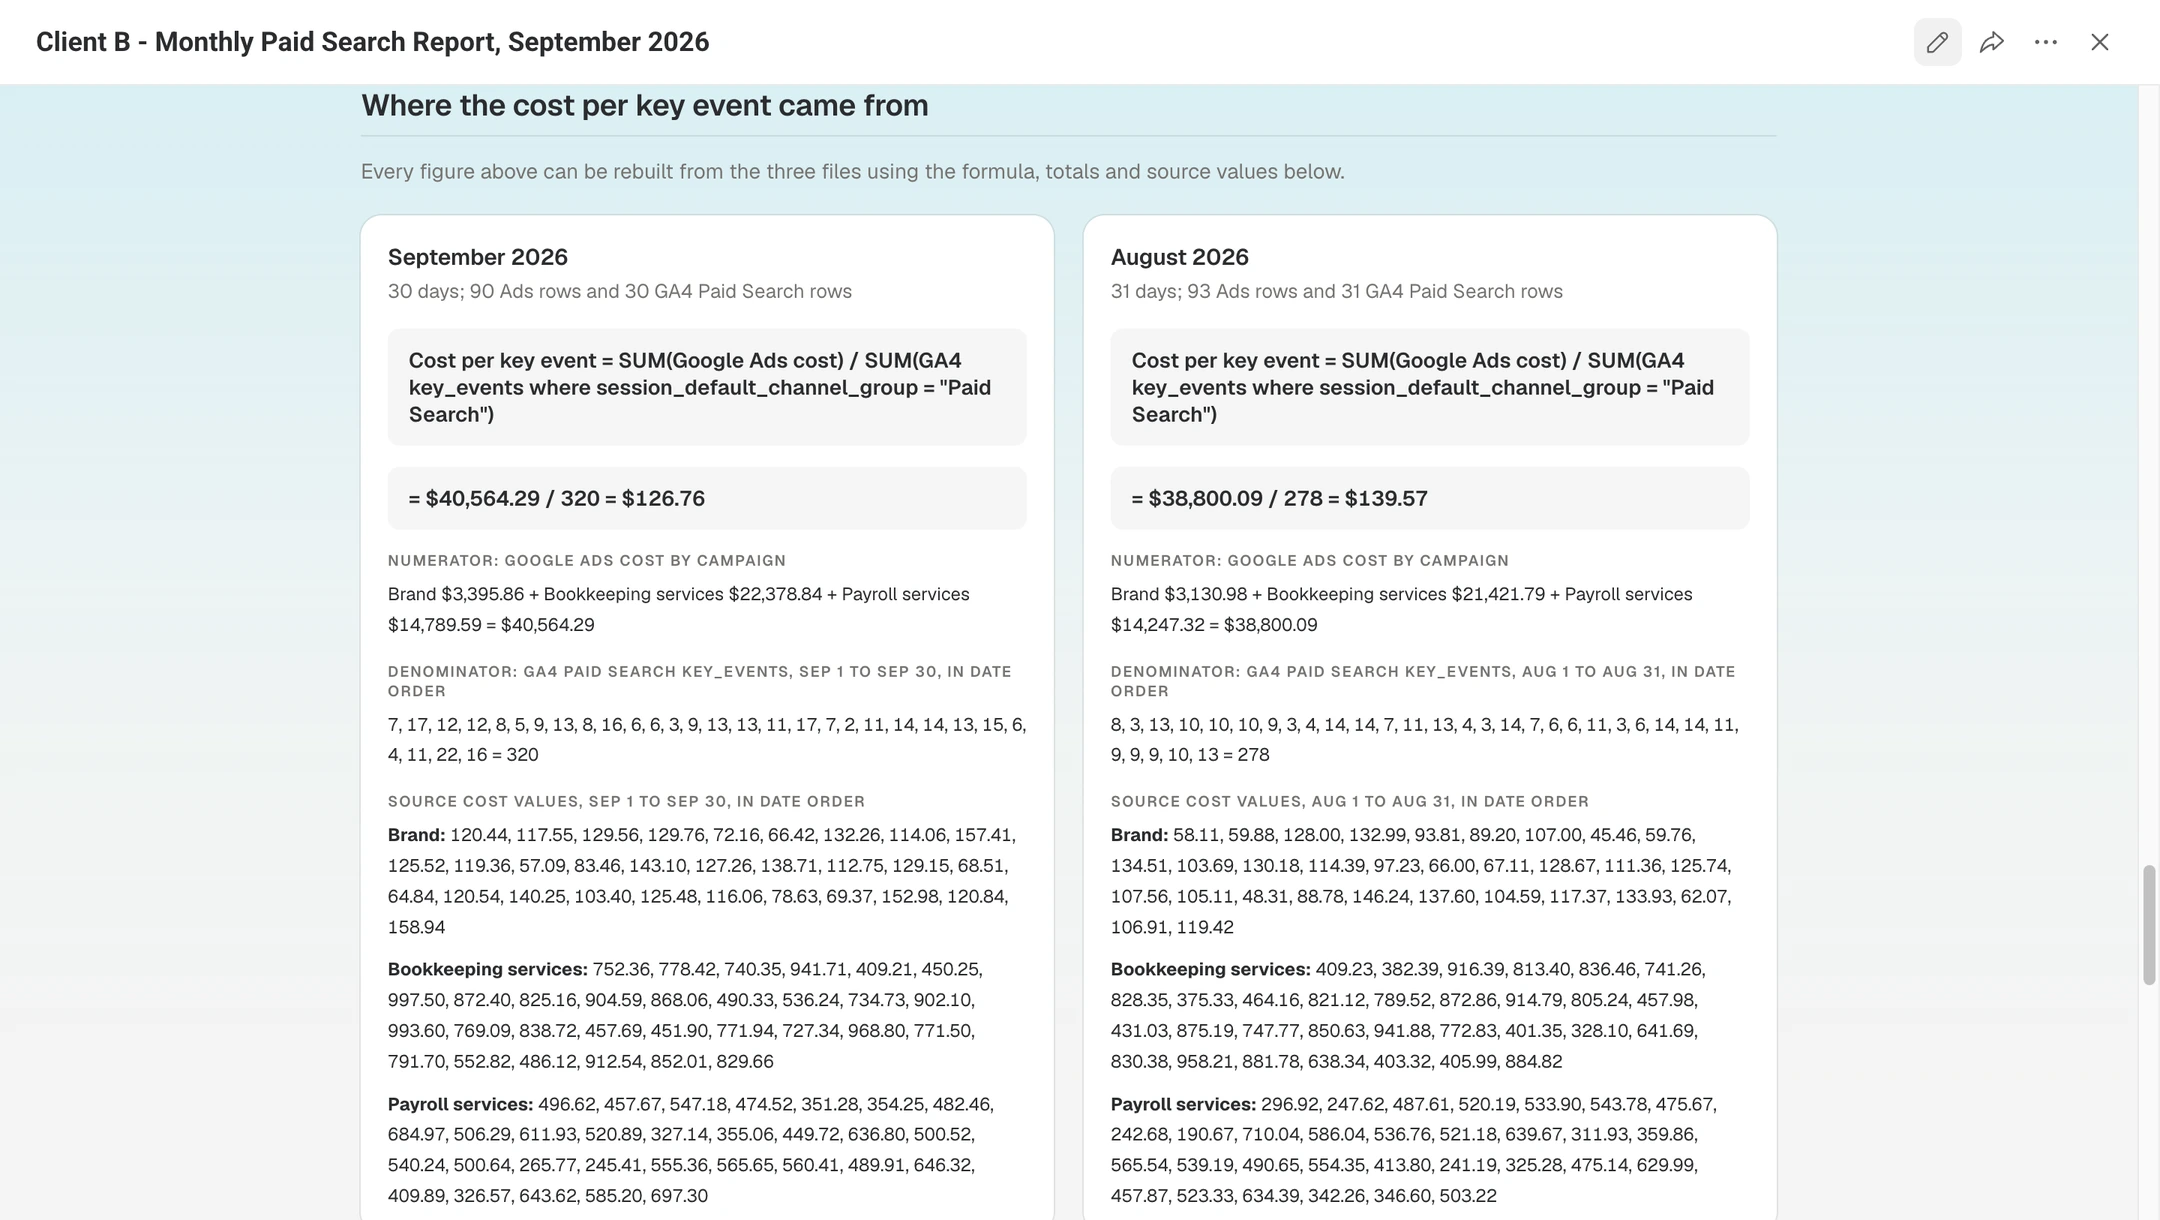
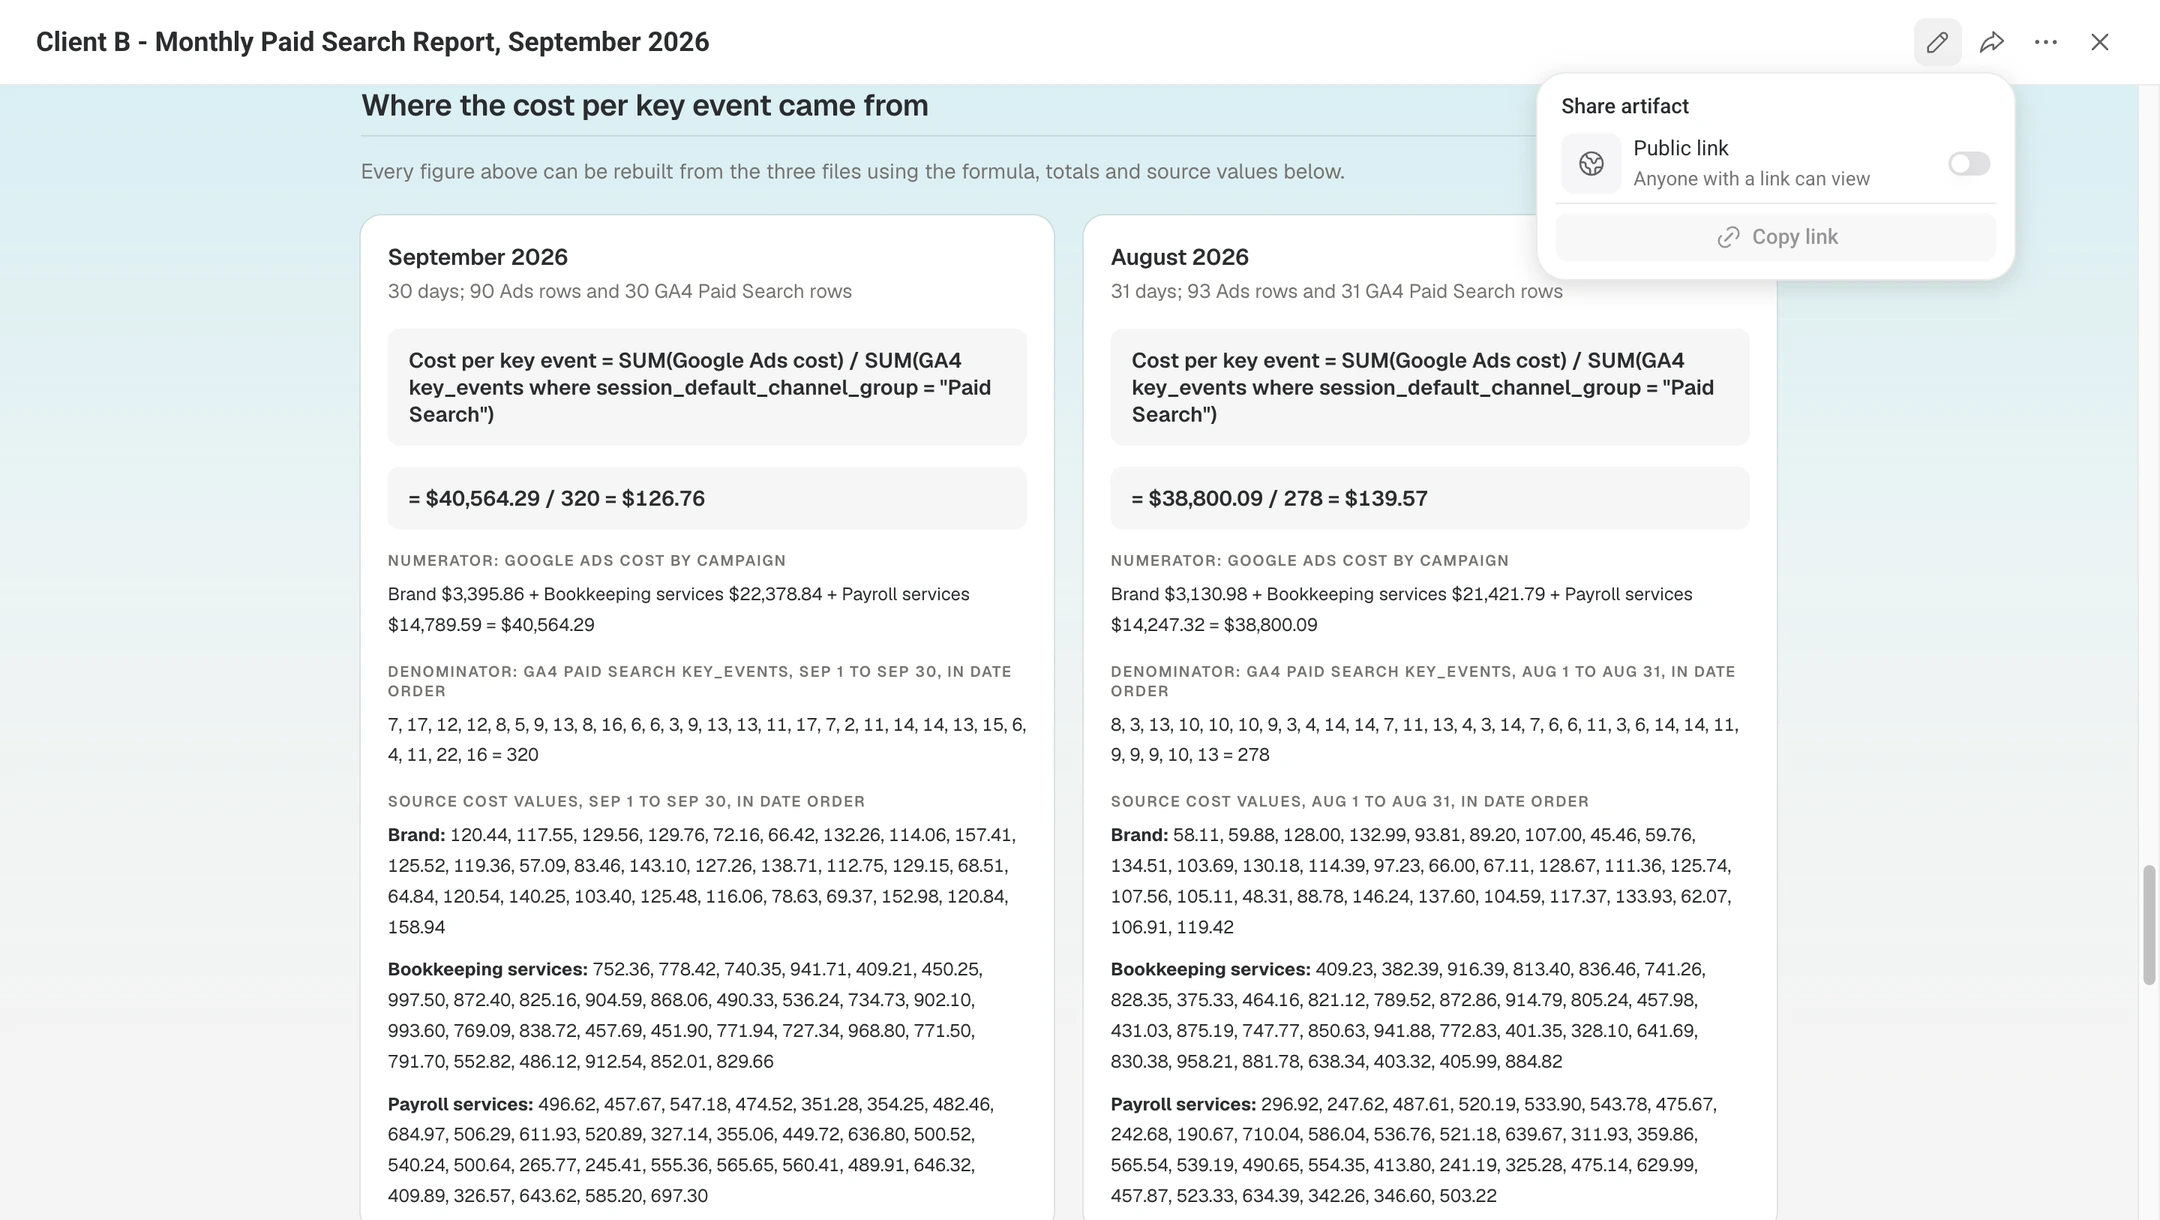
Databox remains unscored. The original CSV/Sheets run did not complete; the shared picker failure does not establish a product defect. Read the original Databox run record. In a separate 29 October continuation, we pasted all 2,520 raw CSV rows in 34 chat messages. Genie saved an HTML report with September 126.76, August 139.57 and the 25.9% difference in conversion counts, using calculator tools. This did not create connected data sources or a refreshable dashboard.
Databox Genie CSV-text report — separate, unscored continuation · 29 October 2026 · synthetic Client B data
Saved report and input scope
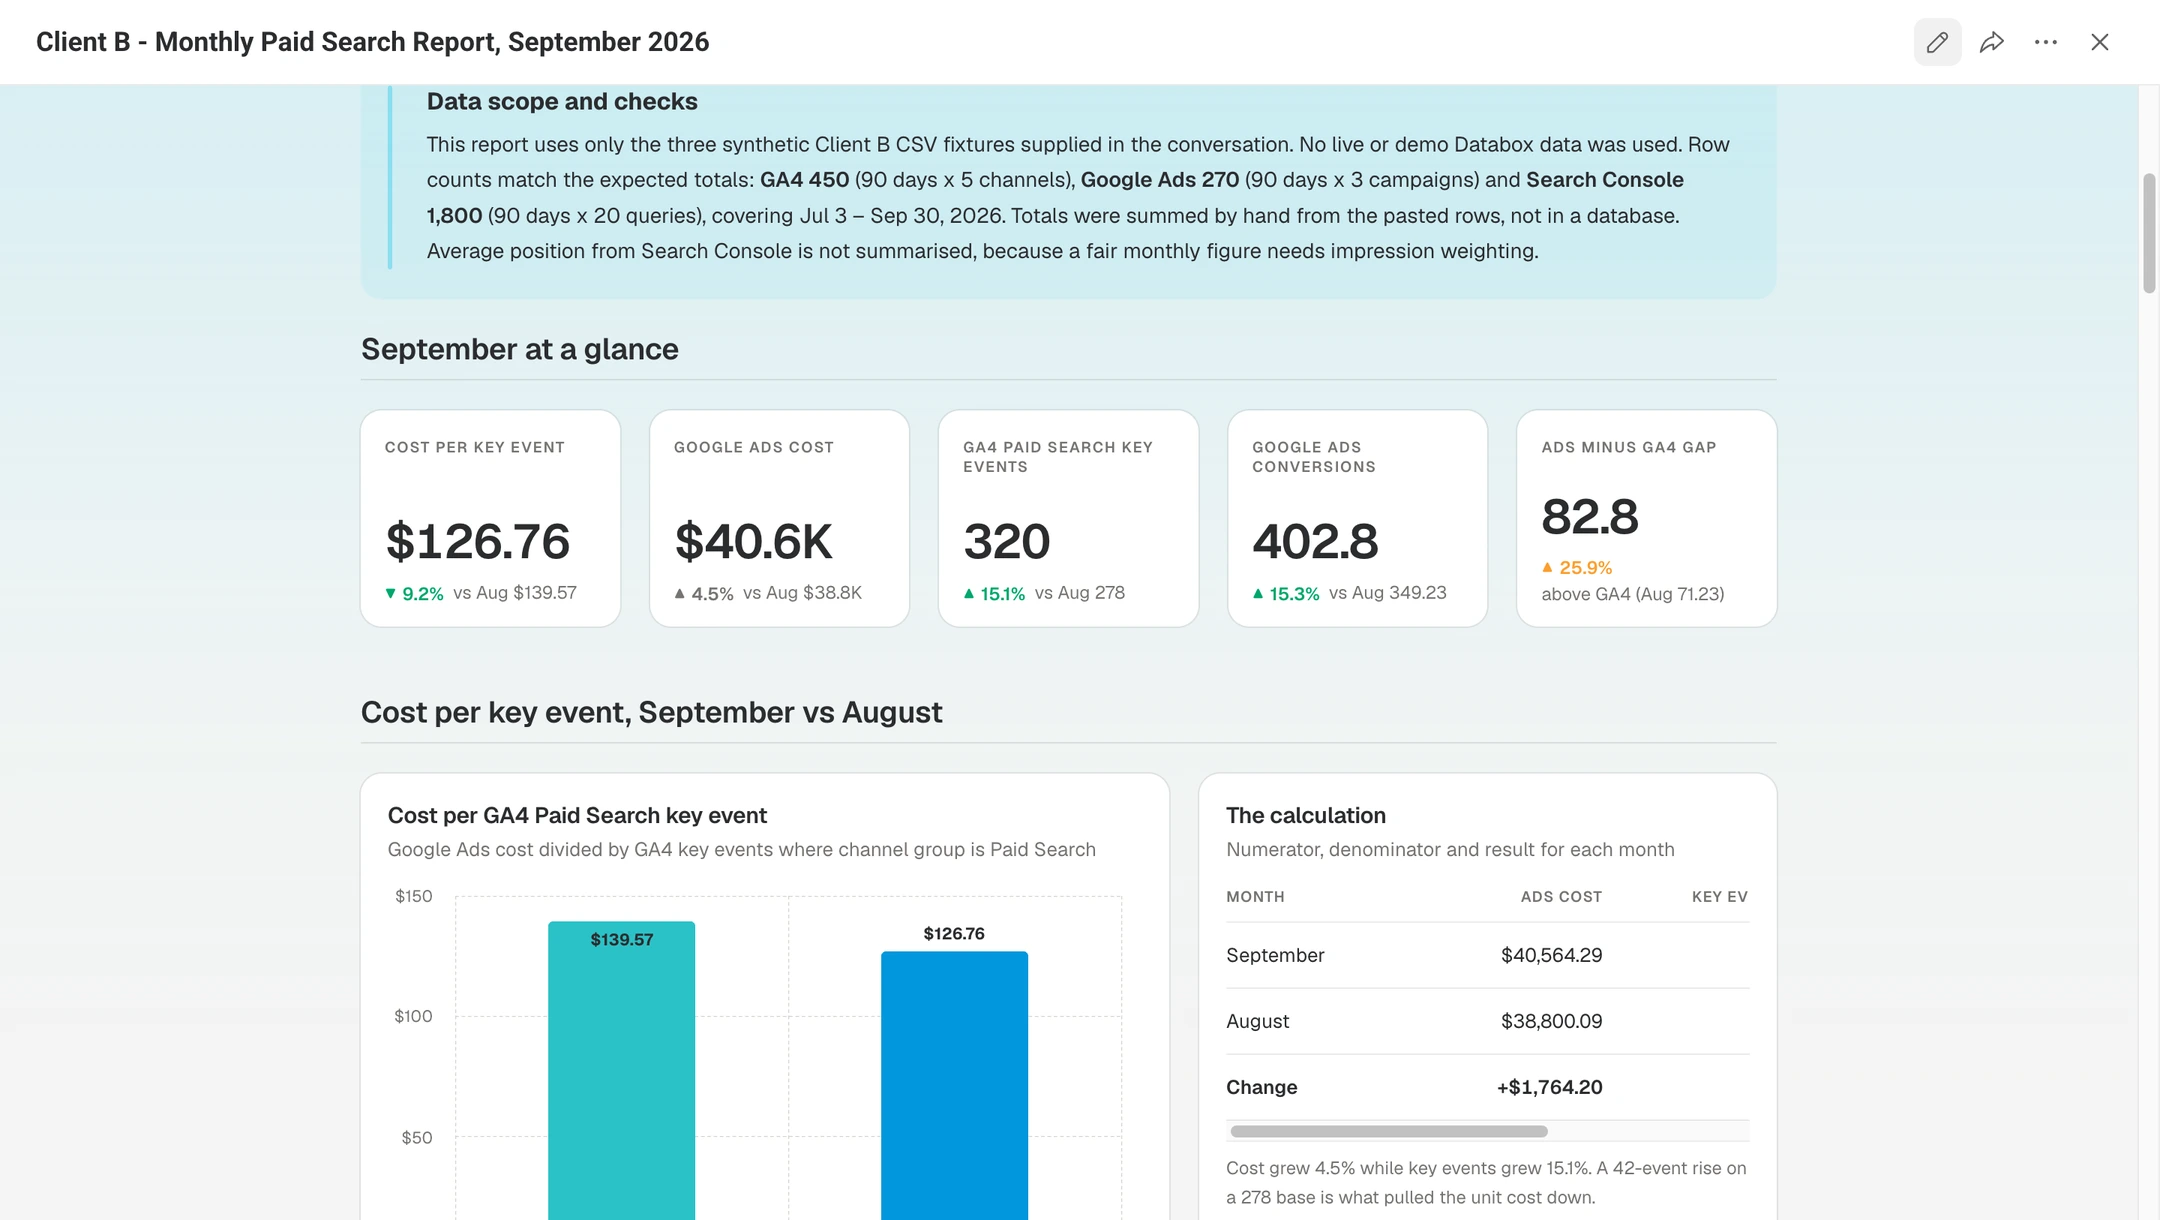
Monthly formula and source values
Artifact sharing remains off
Annual Agency starts at $79/month: four accounts, 20 sources, unlimited agency users. Each $20 pack adds one account/five sources. Assuming all four included accounts serve clients, 6/21/46 packs provide 10/25/50 accounts and 50/125/250 sources. Branding lists $200/month with annual billing selected. However, enabling client-account users starts a Team Core trial. Confirm ongoing client subscriptions and organization-wide branding charges; complete costs require a quote.
The fresh report's headline values match the fixture, but it adds an unspecified dollar currency. Its public-link switch stayed off; PDF and scheduled delivery remain untested.
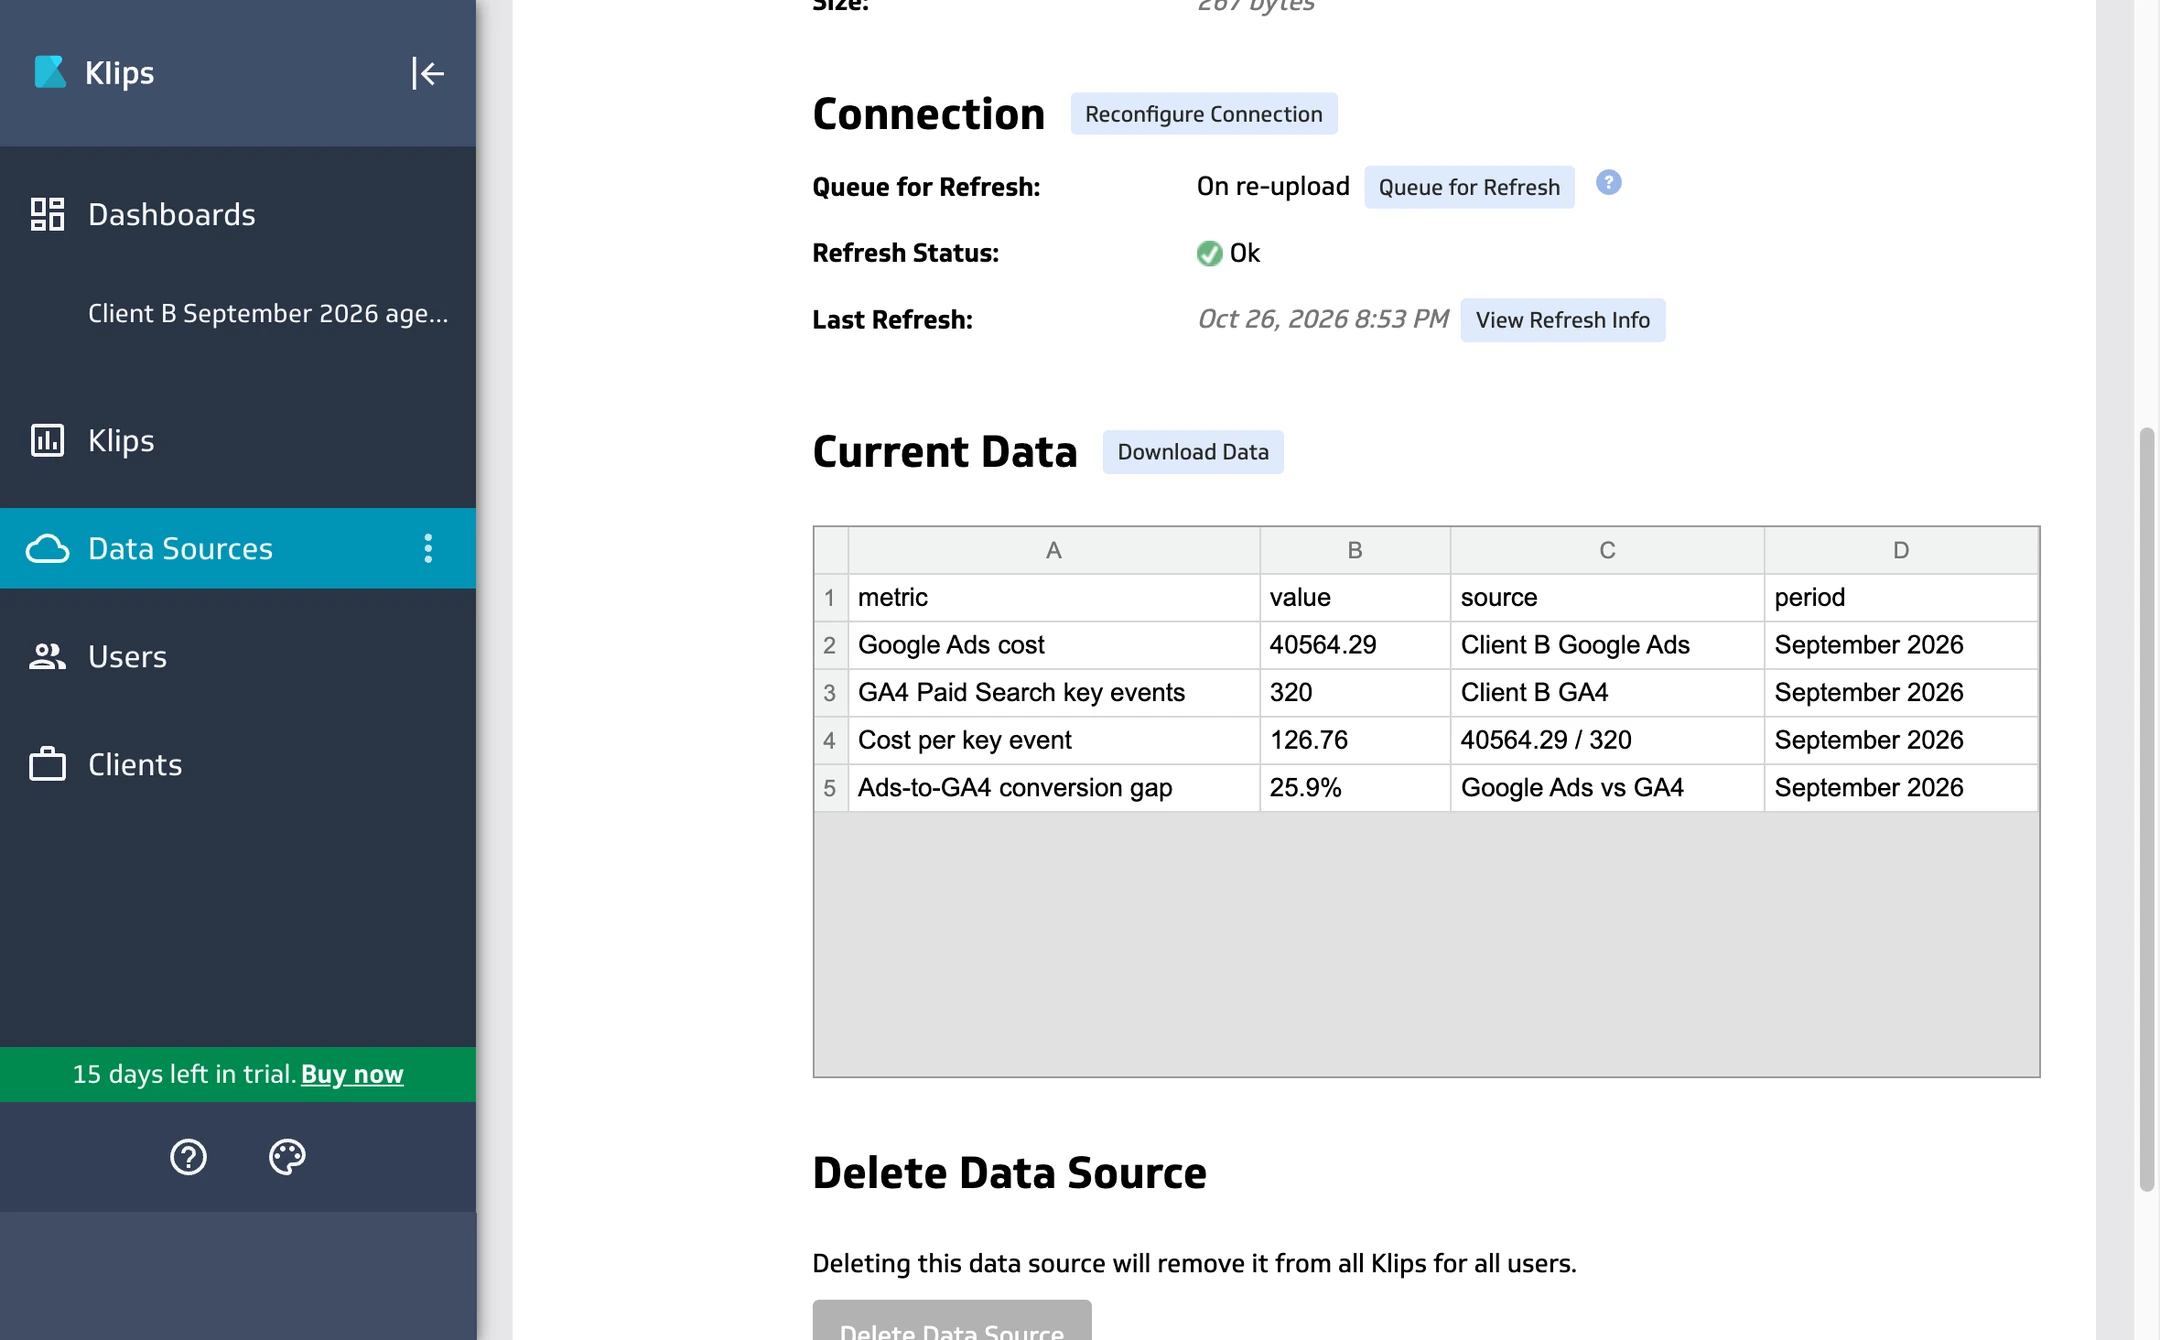
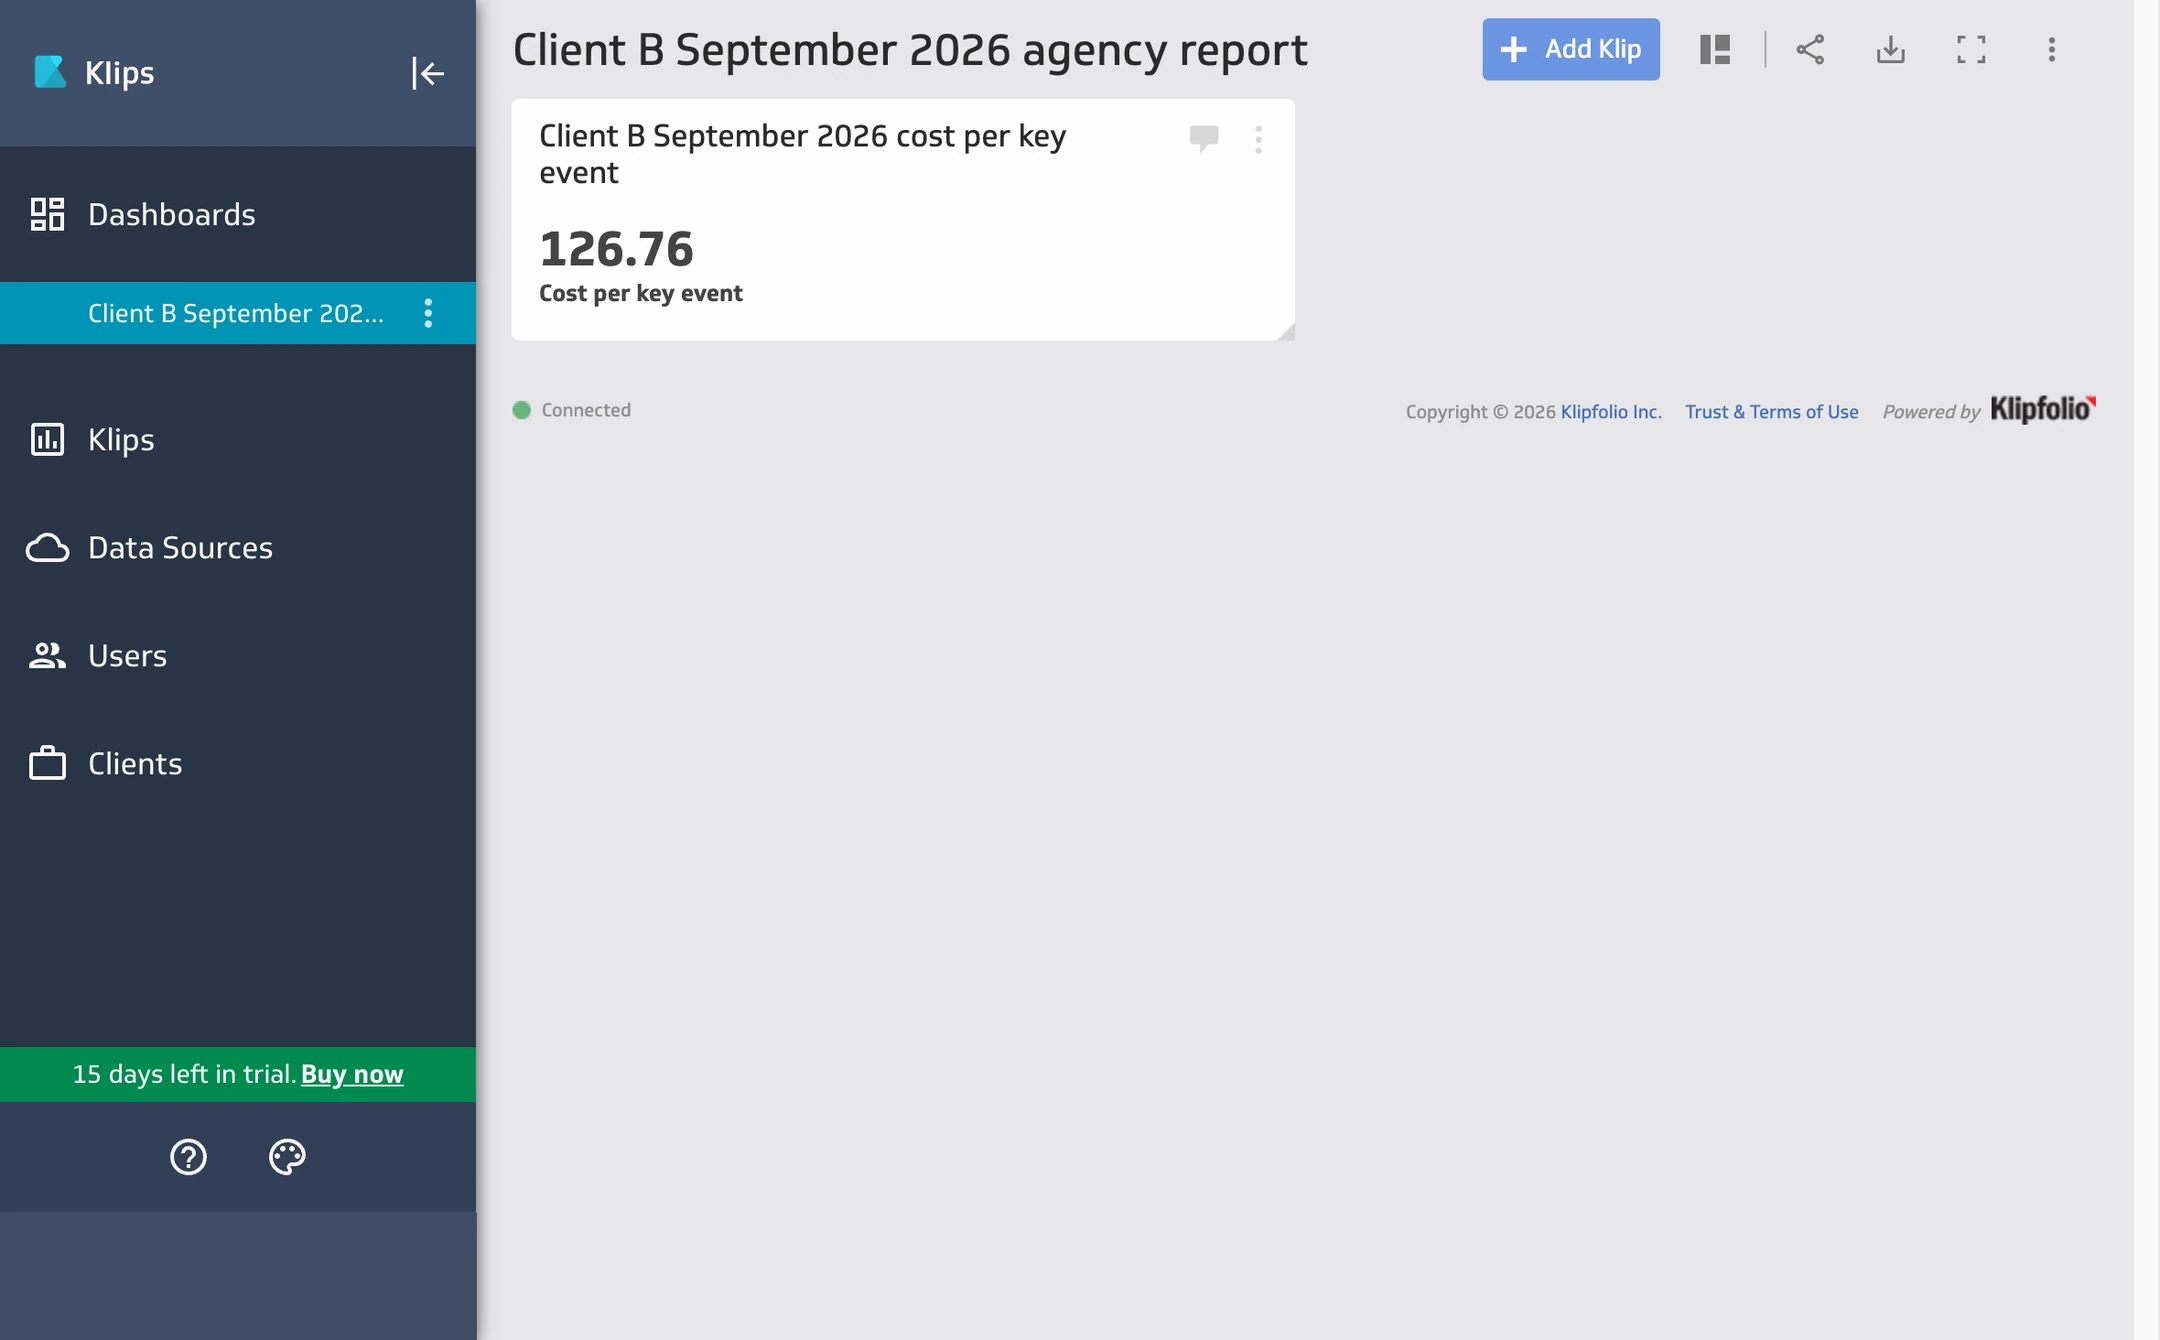
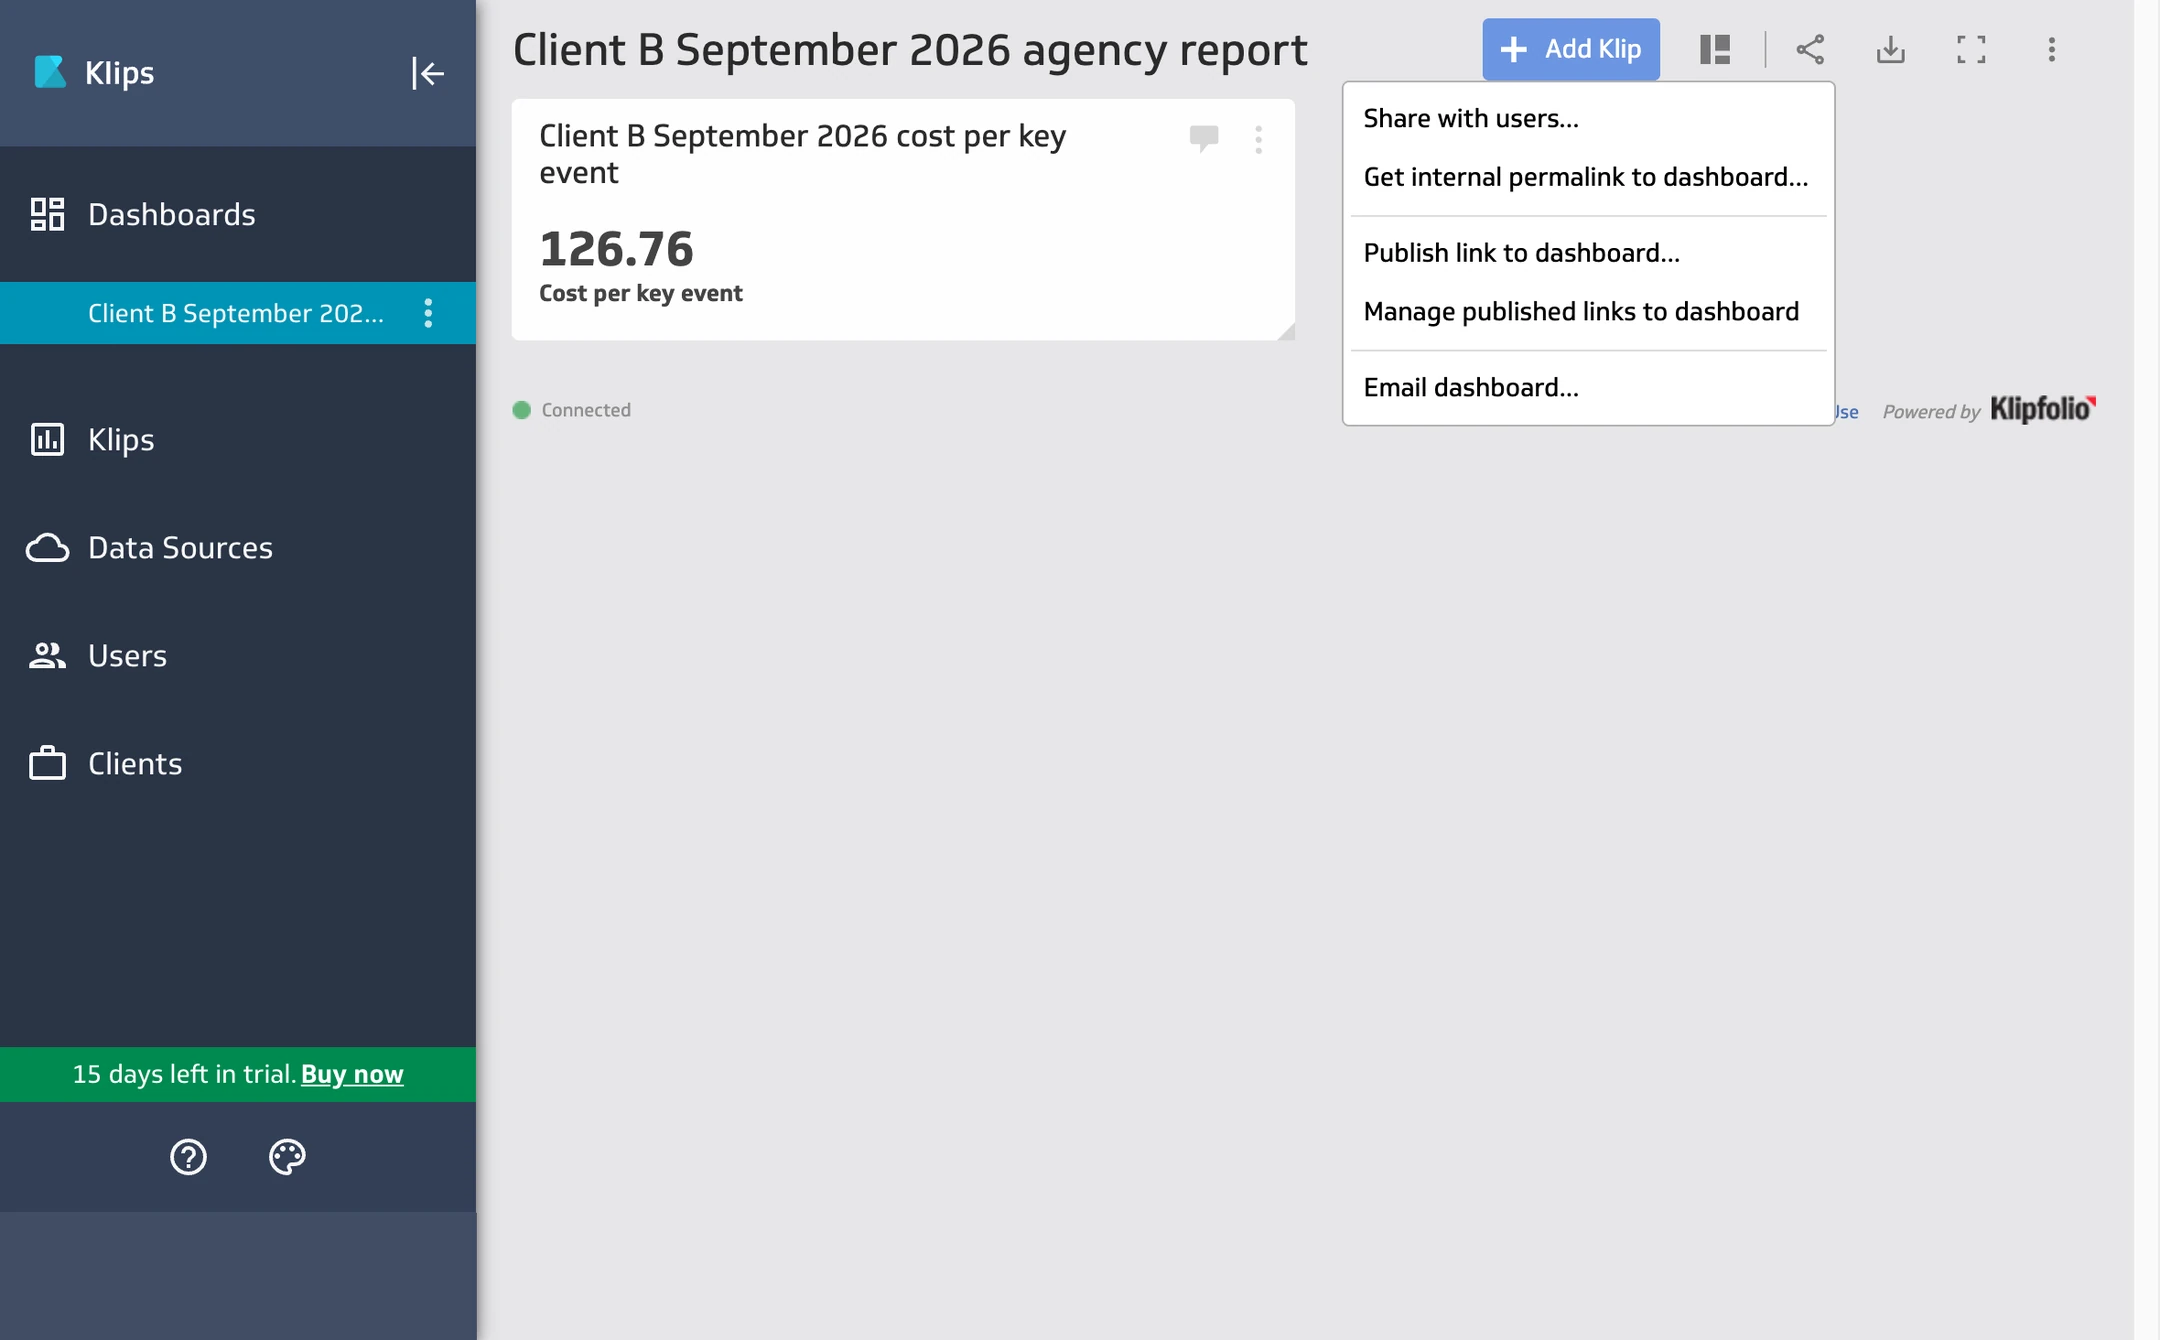
Klipfolio remains unscored. On 26 October we connected raw GA4 and Ads CSVs separately, but did not complete the native cross-source calculation. We imported an independently calculated summary; the dashboard displayed its 126.76. The 27 October recaptures show that saved summary, dashboard and Share controls. No email or public link was sent. This is display evidence, not a comparable calculation result.
Fresh Klipfolio Klips trial test screenshots · 27 October 2026 · synthetic Client B data
Imported September summary preview
Saved Client B dashboard
Sharing and delivery controls
Partner Pro is $440/month annually for 30 clients and 30 dashboards; Premier is $900 for 80 each. Both include unlimited users, white-labeling, custom domain/theme, published links and scheduled PDF/image reports.
Those client/dashboard allowances fit our rosters. The 130+ integration catalogue does not establish 30/75/150 simultaneous connections. Source/resource limits and connector fees remain unverified; complete configurations need a quote.
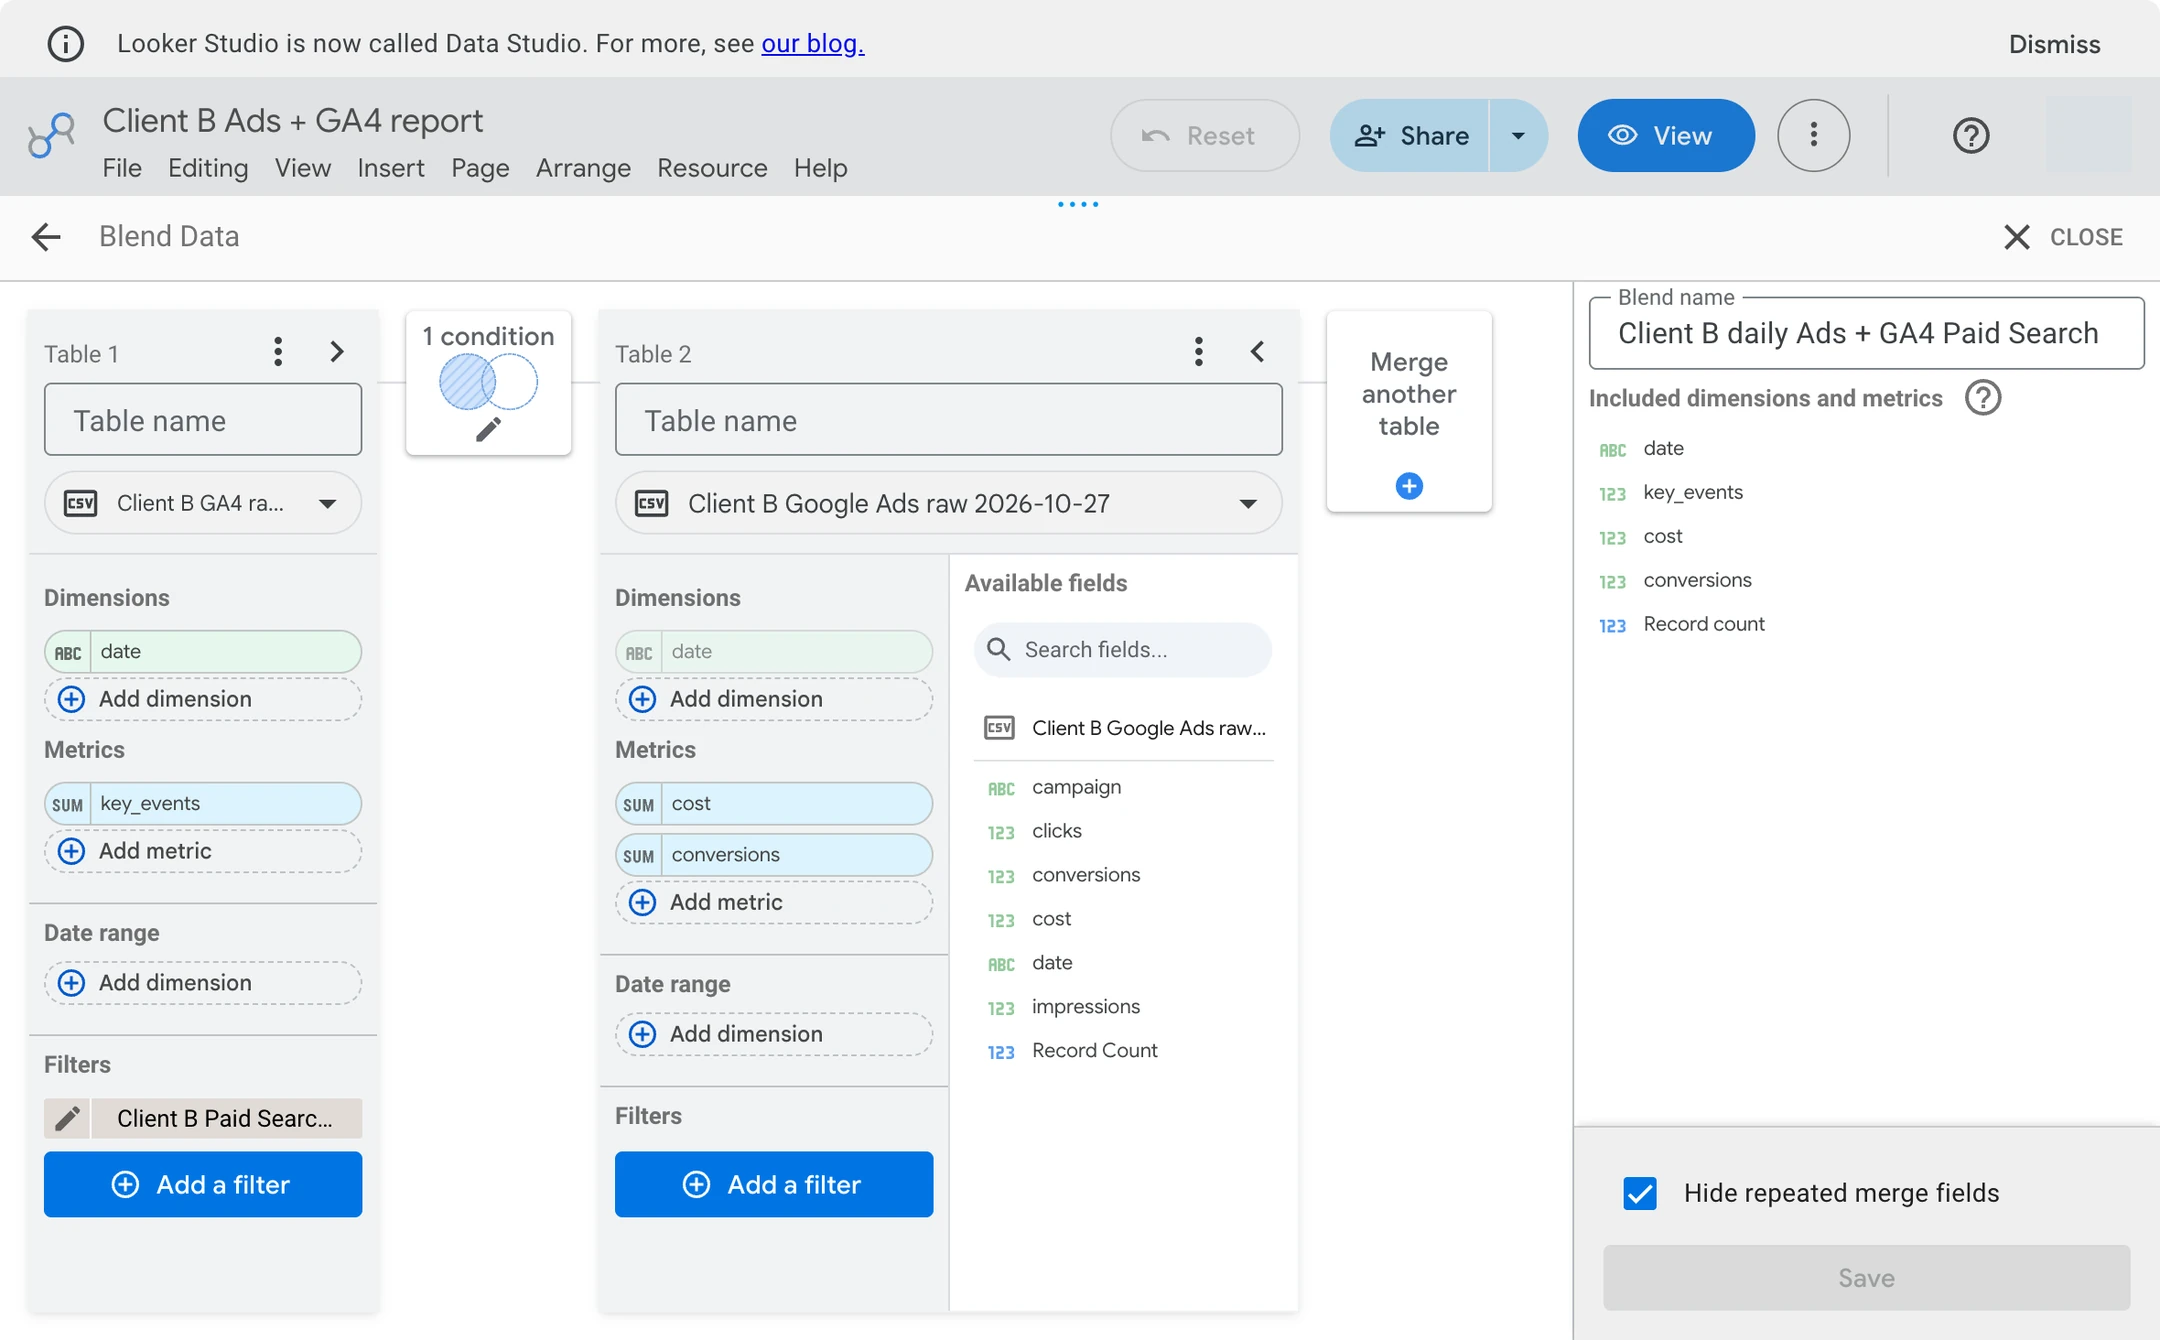
Looker Studio, now called Data Studio, matched September and August in the original manual file test: about 15 intake actions and 40 report actions. The conversion-difference calculation, Search Console top-ten table and scheduled email were not built. Read the exact Looker Studio run record.
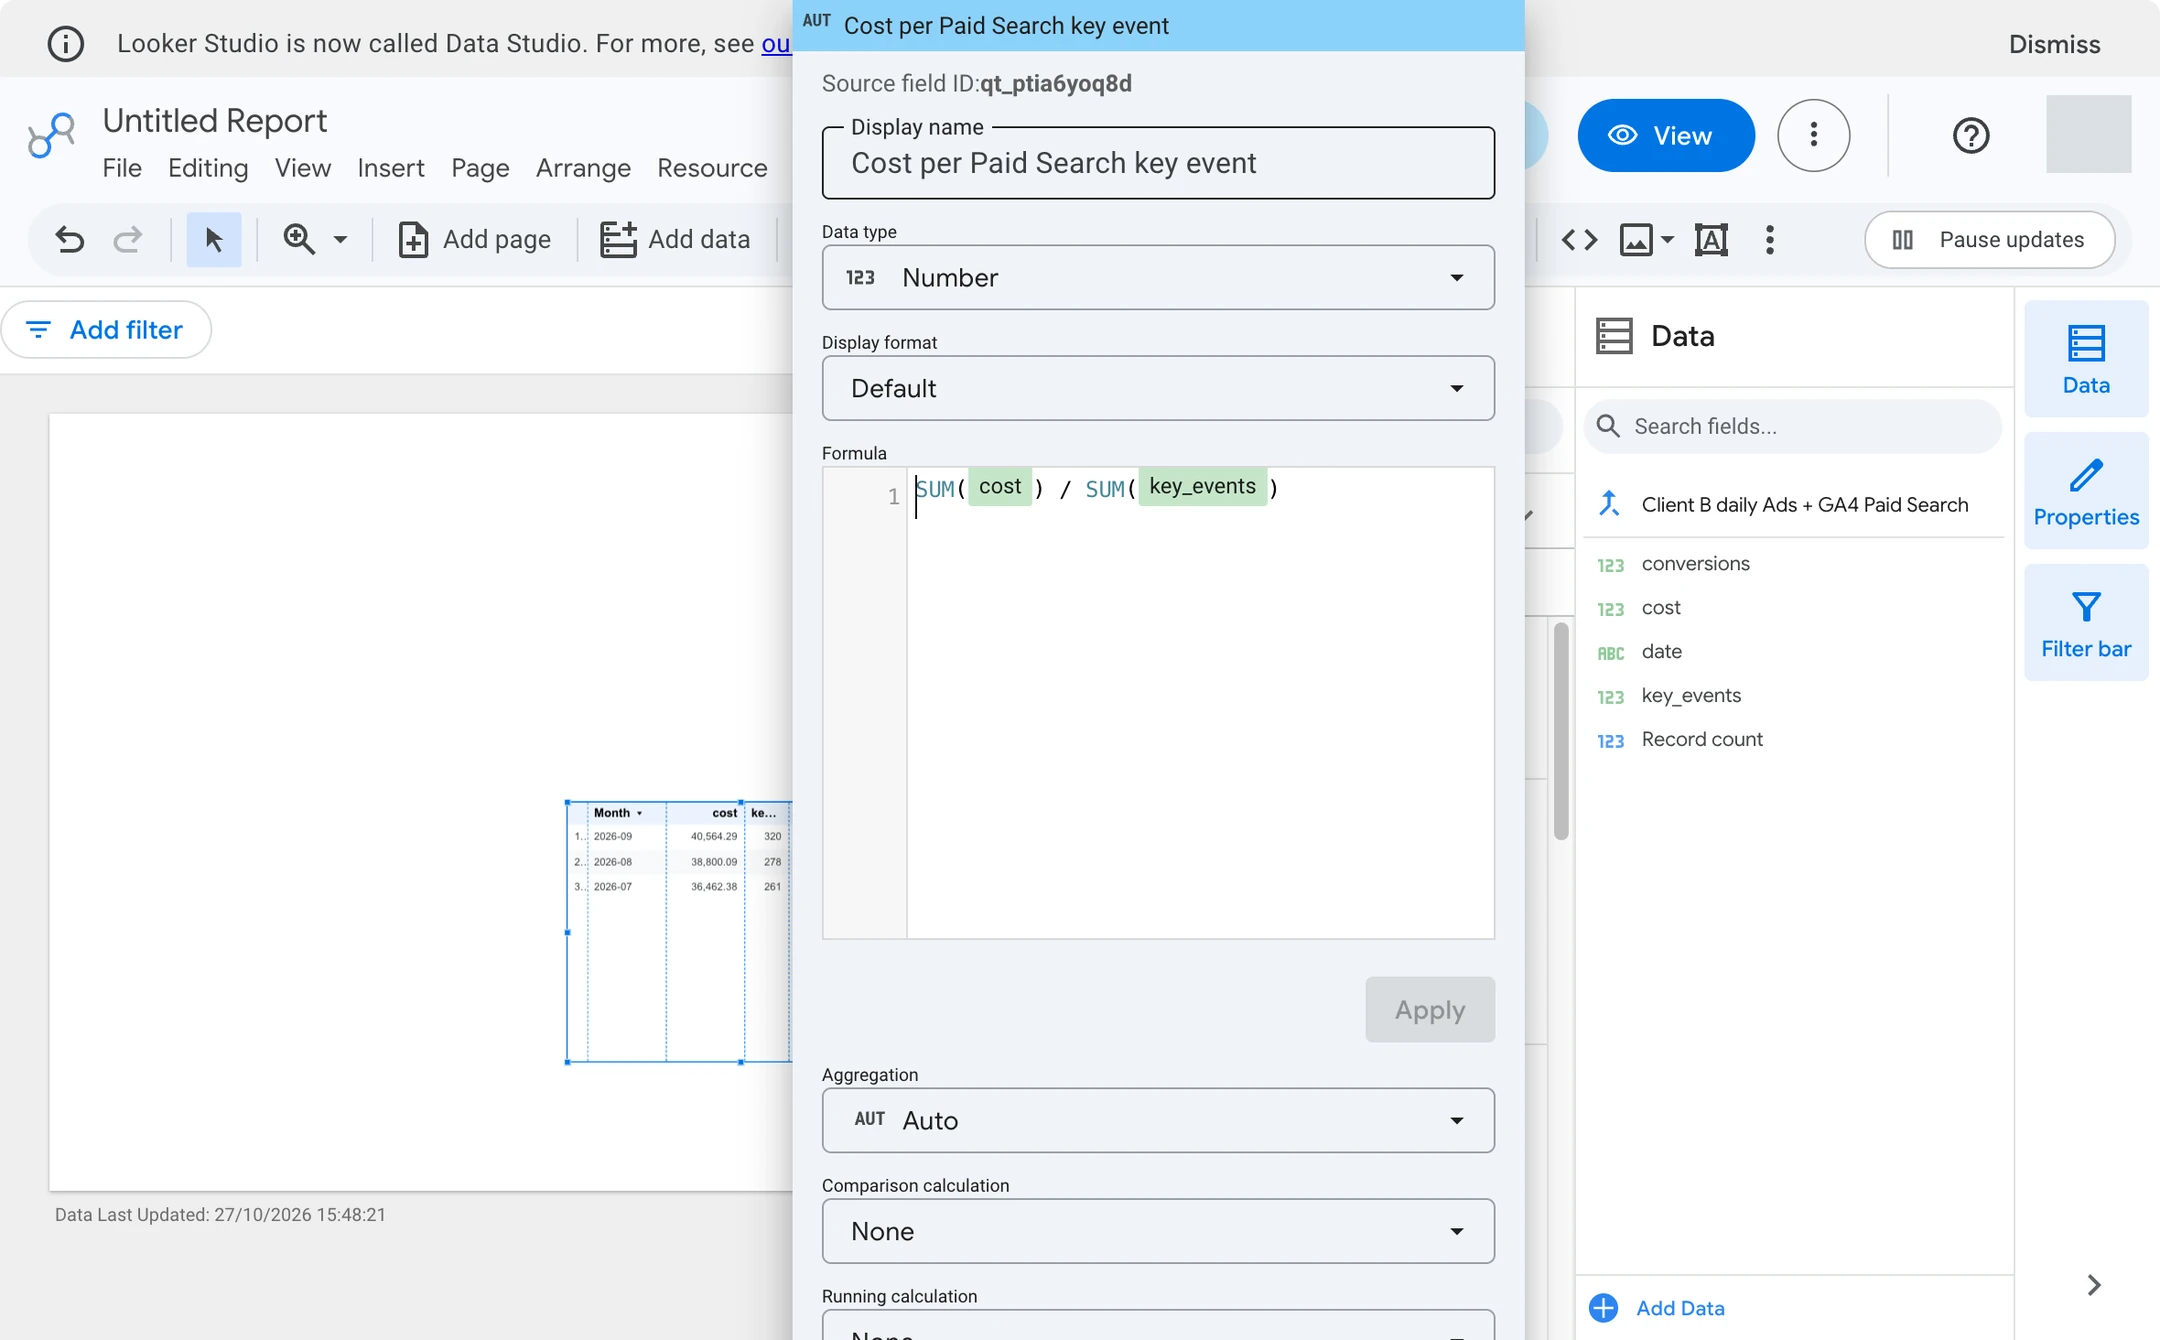
On 27 October we rebuilt the native ratio from the original Ads/GA4 files. September again returned 126.76 and August 139.57. This unscored continuation omitted Search Console, breakdowns, the conversion-count comparison and delivery checks; it did not repeat the earlier prompt or action count.
Fresh Data Studio signed-in report test screenshots · 27 October 2026 · synthetic Client B data
Daily GA4 and Ads blend
Native monthly calculation result
Native calculated-field formula
Google's standard Data Studio license is $0; native connectors cover these three Google sources. Pro is separate. Staff, implementation and maintenance still cost money. Sharing/PDF email does not reproduce a white-label portal; $0 is not total reporting cost.
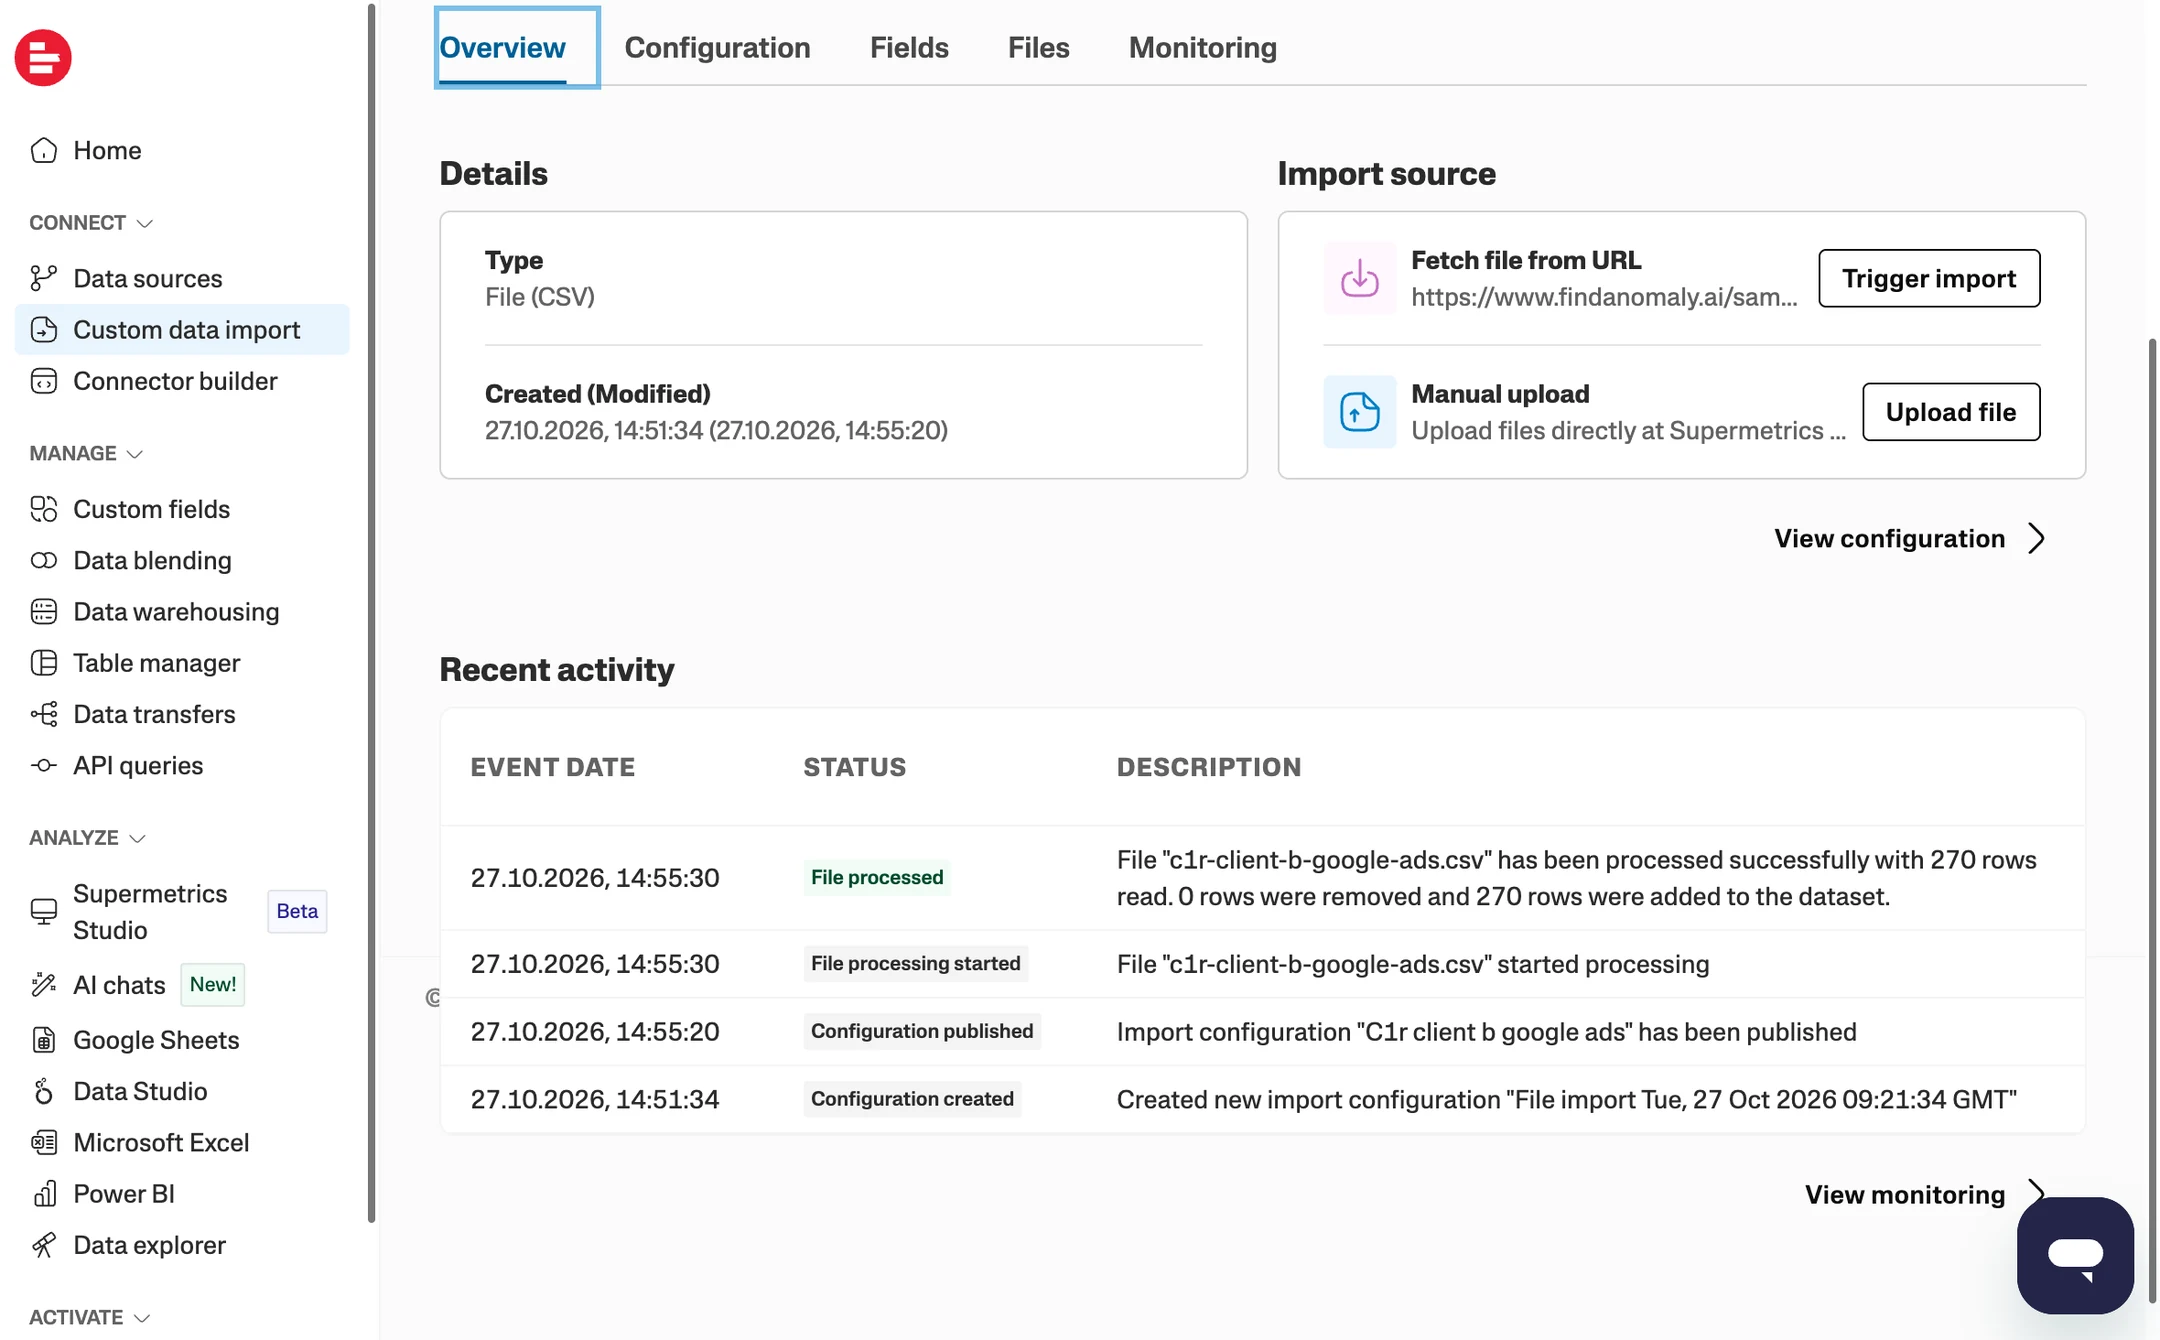
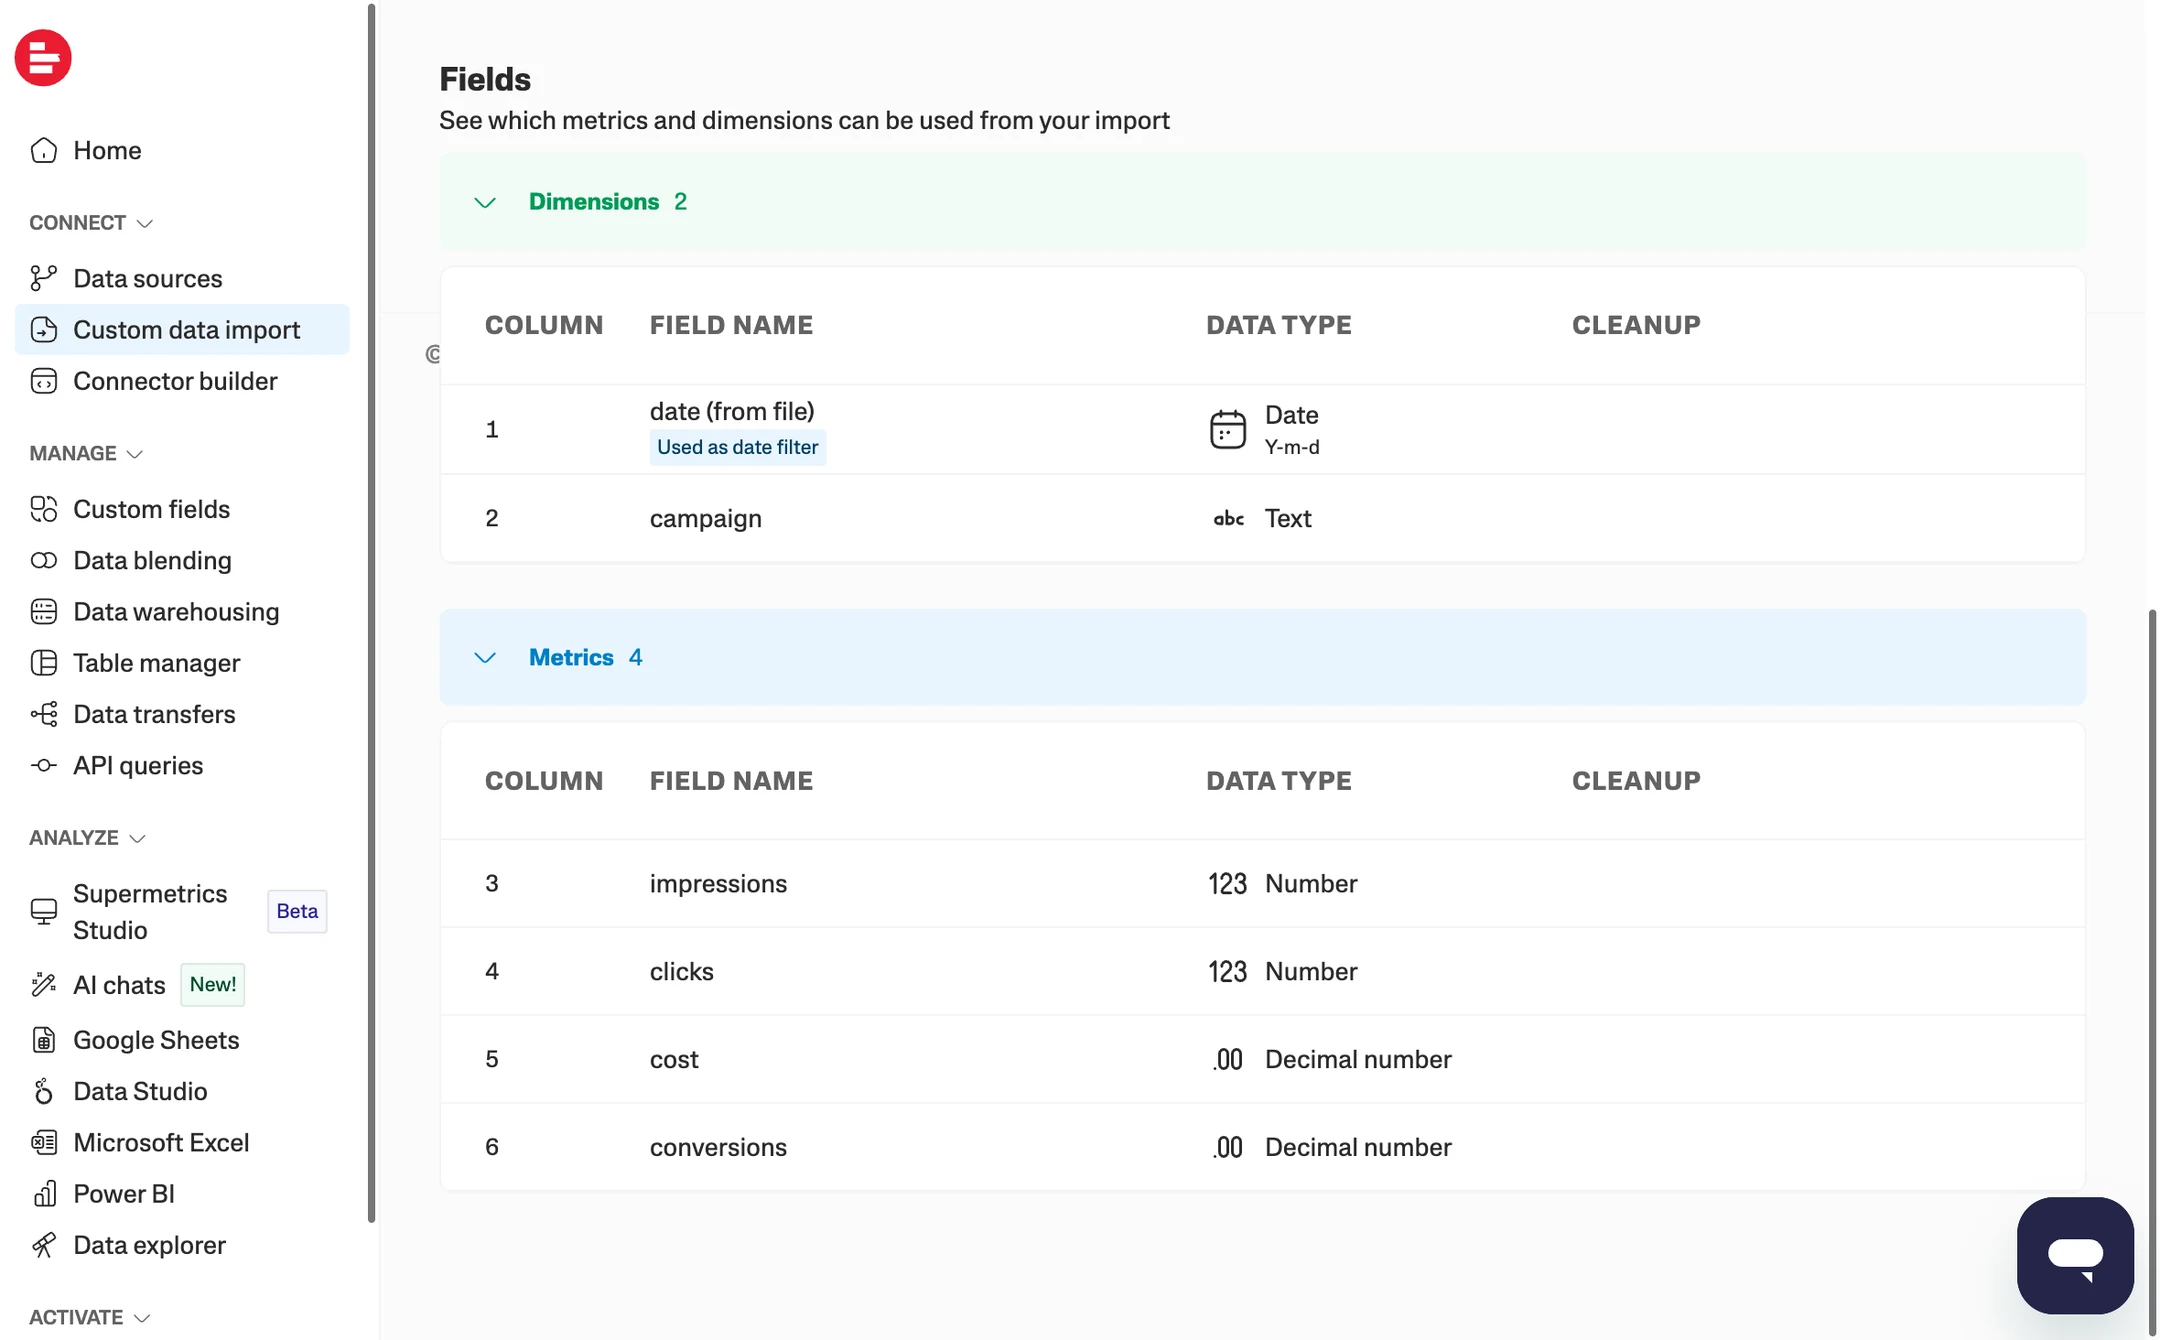
Supermetrics remains unscored. The fresh continuation processed the 270-row Ads file, but did not complete GA4/Search Console intake or a destination report. Its source-refresh schedule is not client delivery. The product moves data into destinations such as Looker Studio, Sheets, Excel, Power BI or Supermetrics Studio; the client experience depends on that destination.
Supermetrics import setup only — client report incomplete · 27 October 2026 · synthetic Client B data
Ads CSV source and refresh configuration
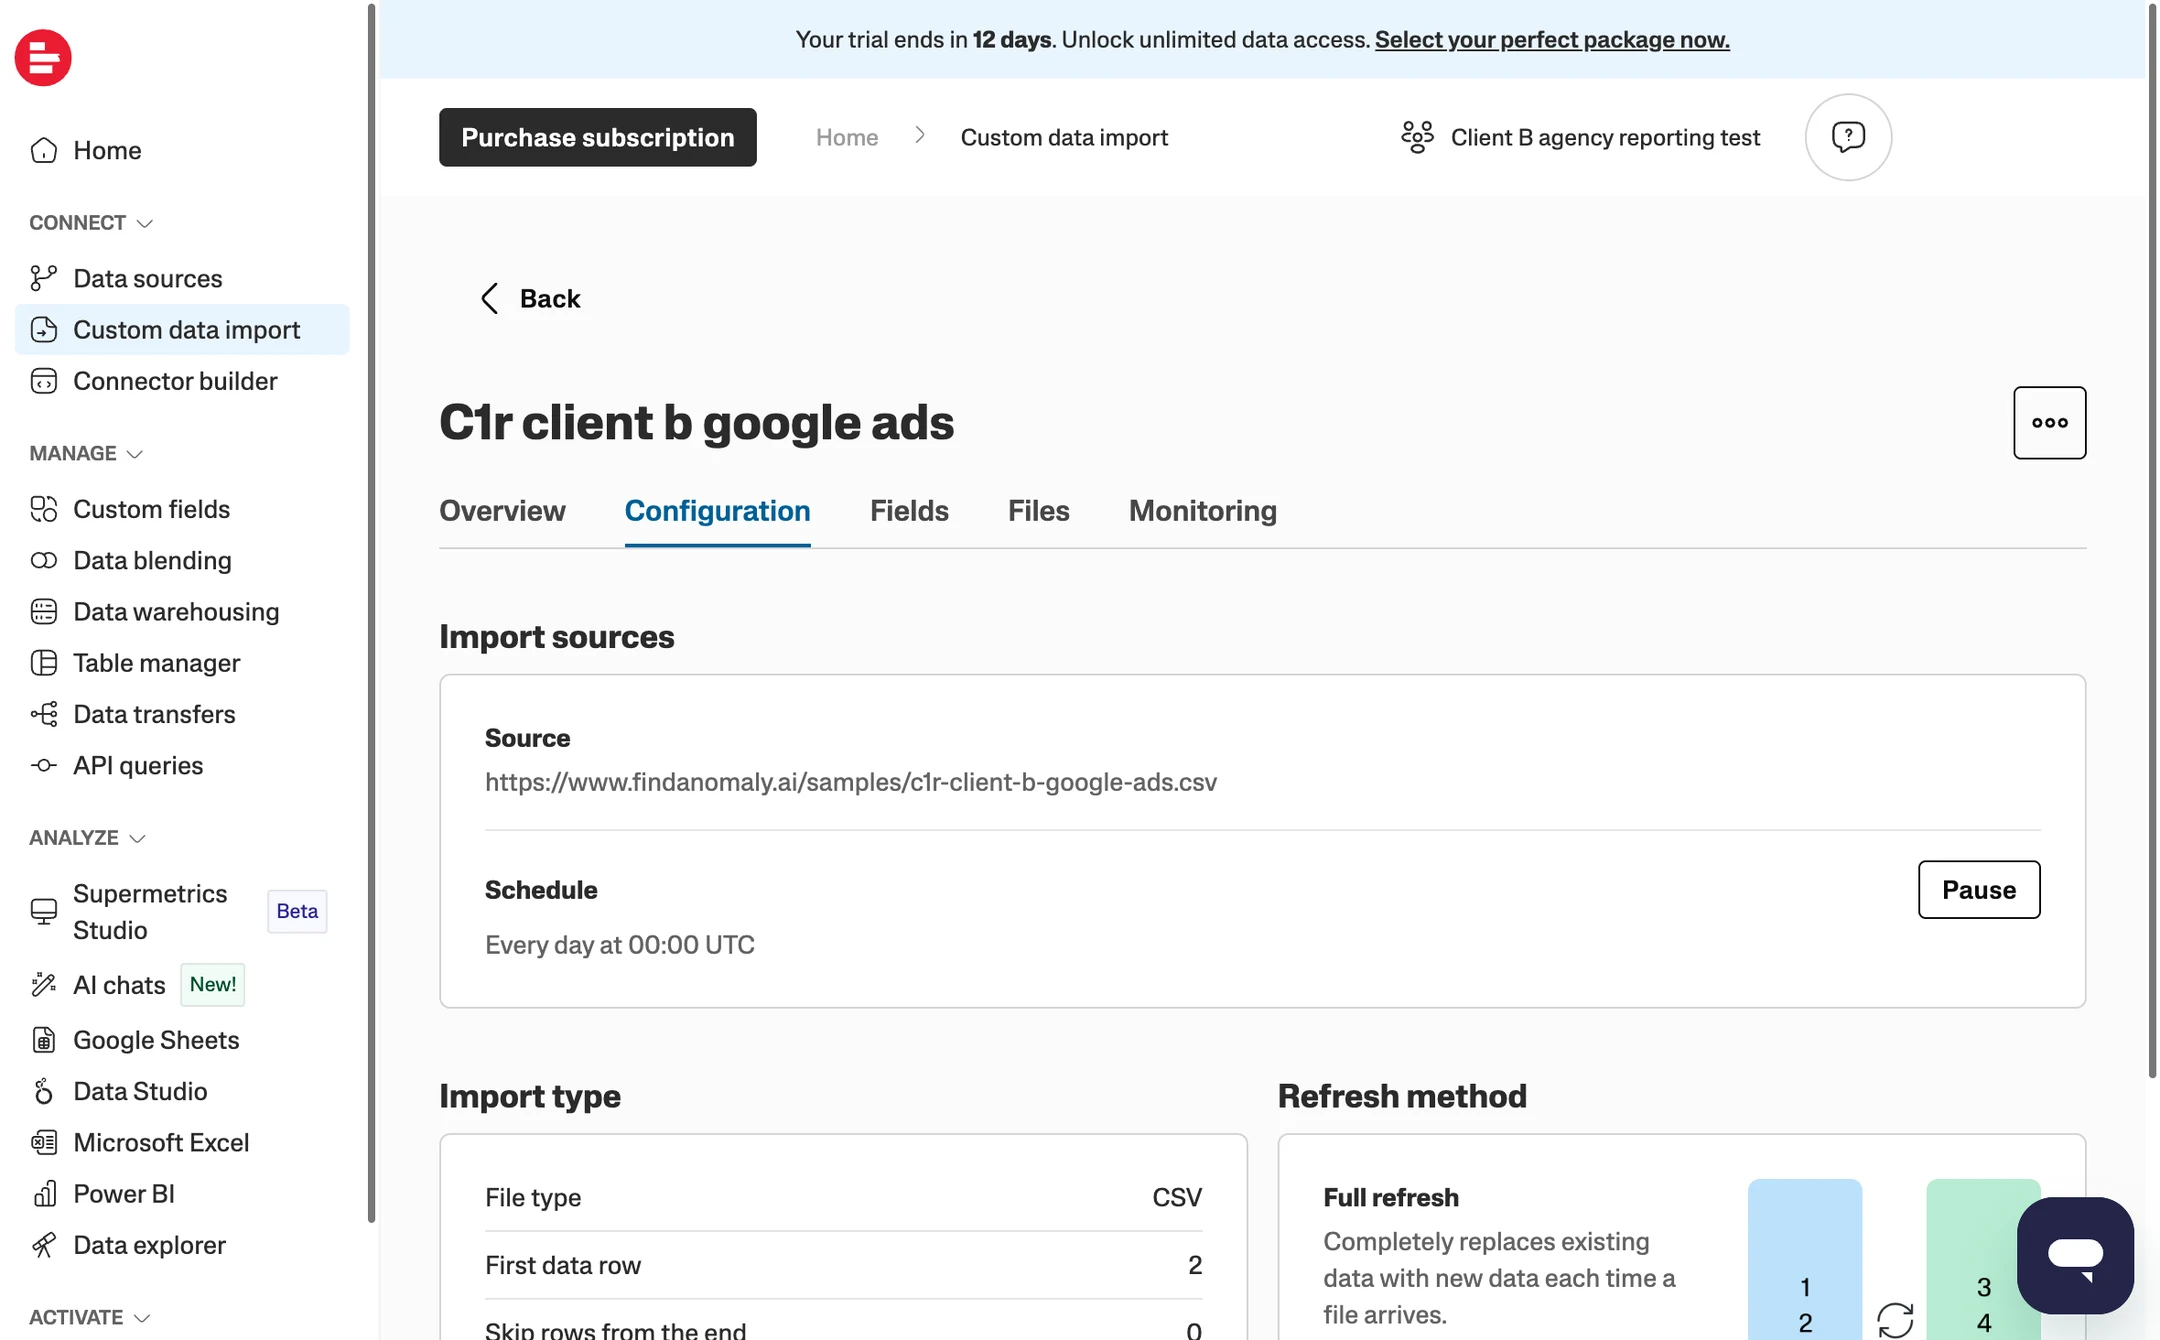
The 270-row Ads import processed
Imported Ads dimensions and metrics
Official annual pricing views conflict: Starter shows $39 or $44/month; Growth $159 or $177. Starter includes two or three source types/accounts per type; Growth includes seven or six types, with seven accounts per type. Starter has one user, Growth two; both include one core destination. Growth extra accounts show $10 up to 20 total or $11 up to 15. The quota applies per source type. The previous $210 estimate is withdrawn; every roster needs a confirmed quote. Standard Data Studio adds $0 destination license; setup, delivery and portal costs remain separate.
Swydo remains unscored. On 27 October it authenticated but required contacting support to start a trial; no files entered the product. This access gate says nothing about report quality. Read the original Swydo access record.
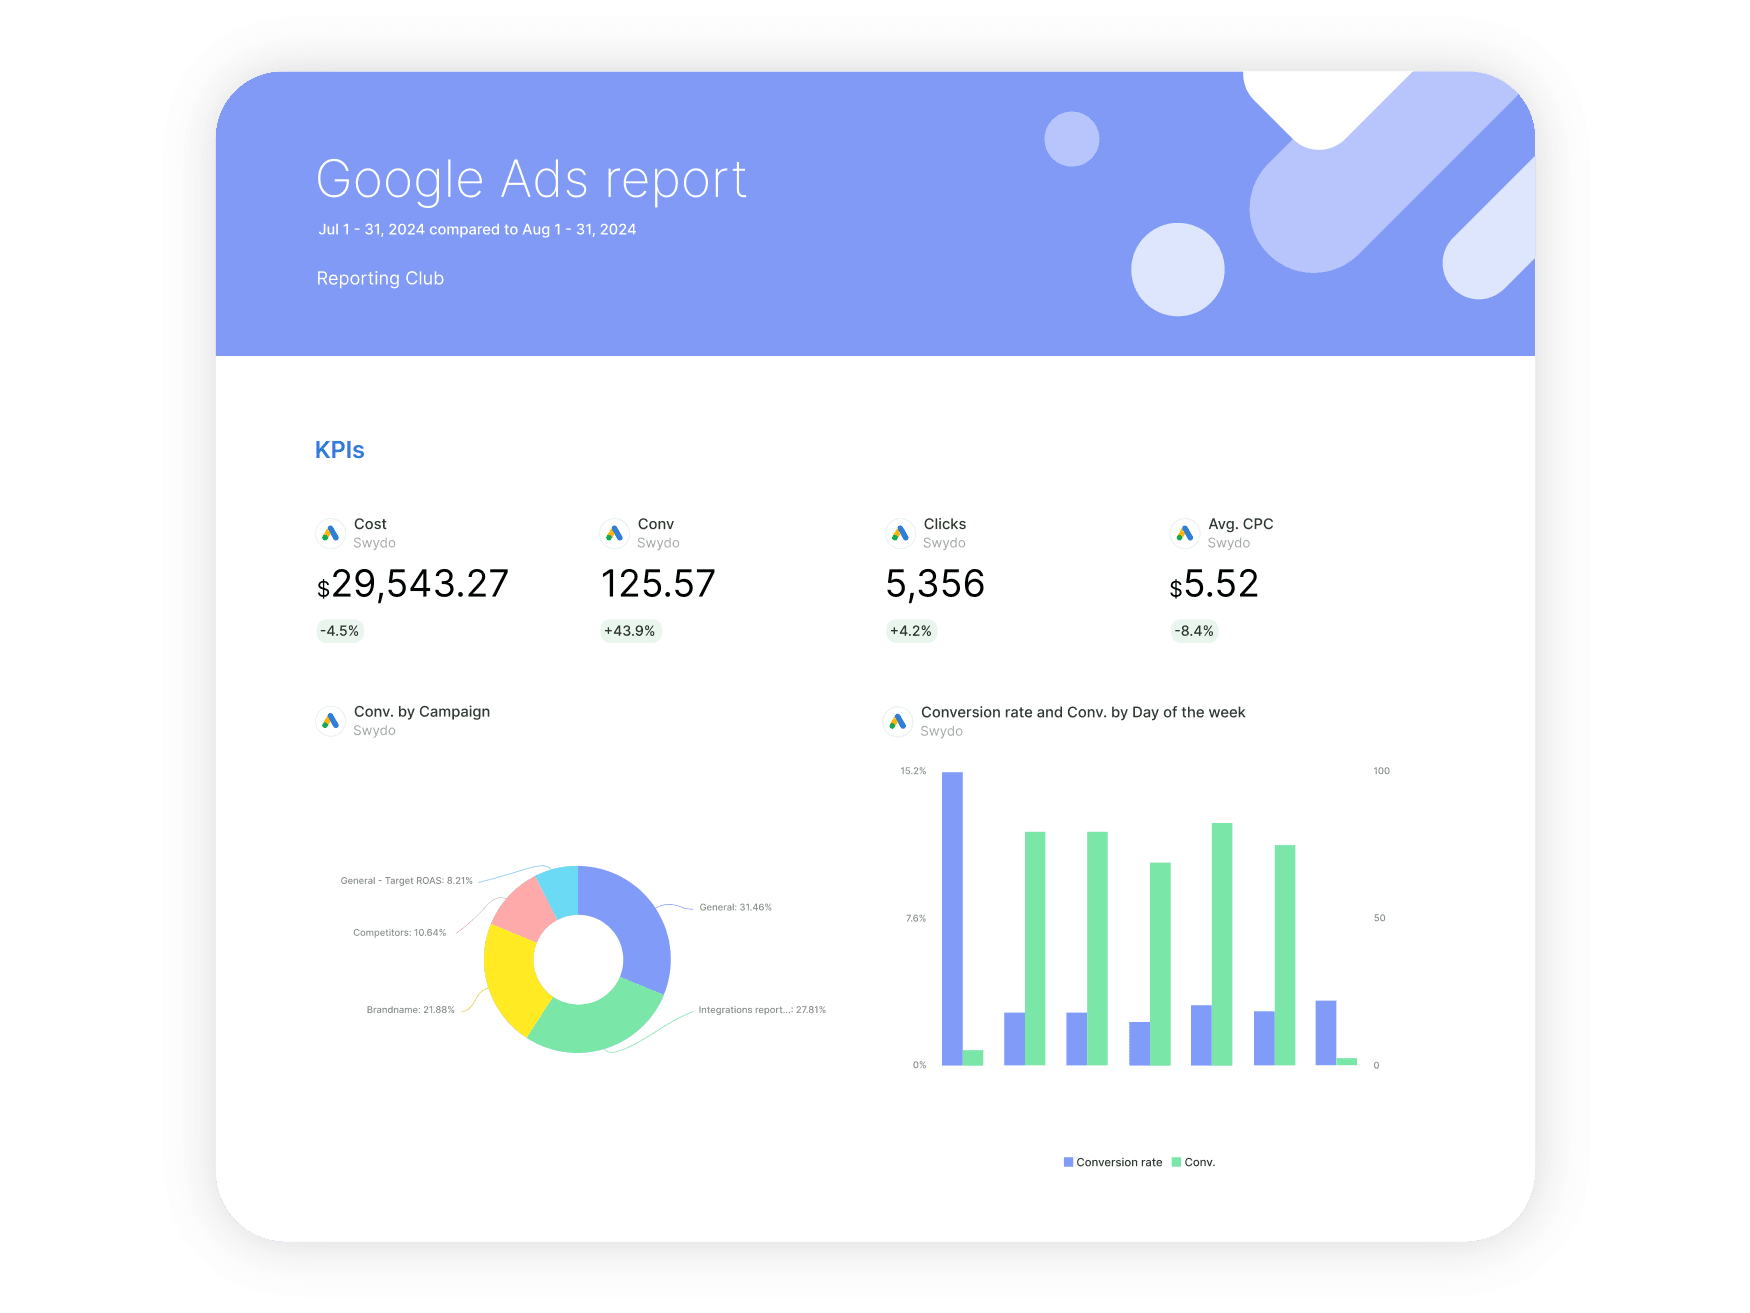
Official Swydo product images · retrieved 30 October 2026 · vendor examples, not our test
Google Ads report
Managing multiple clients
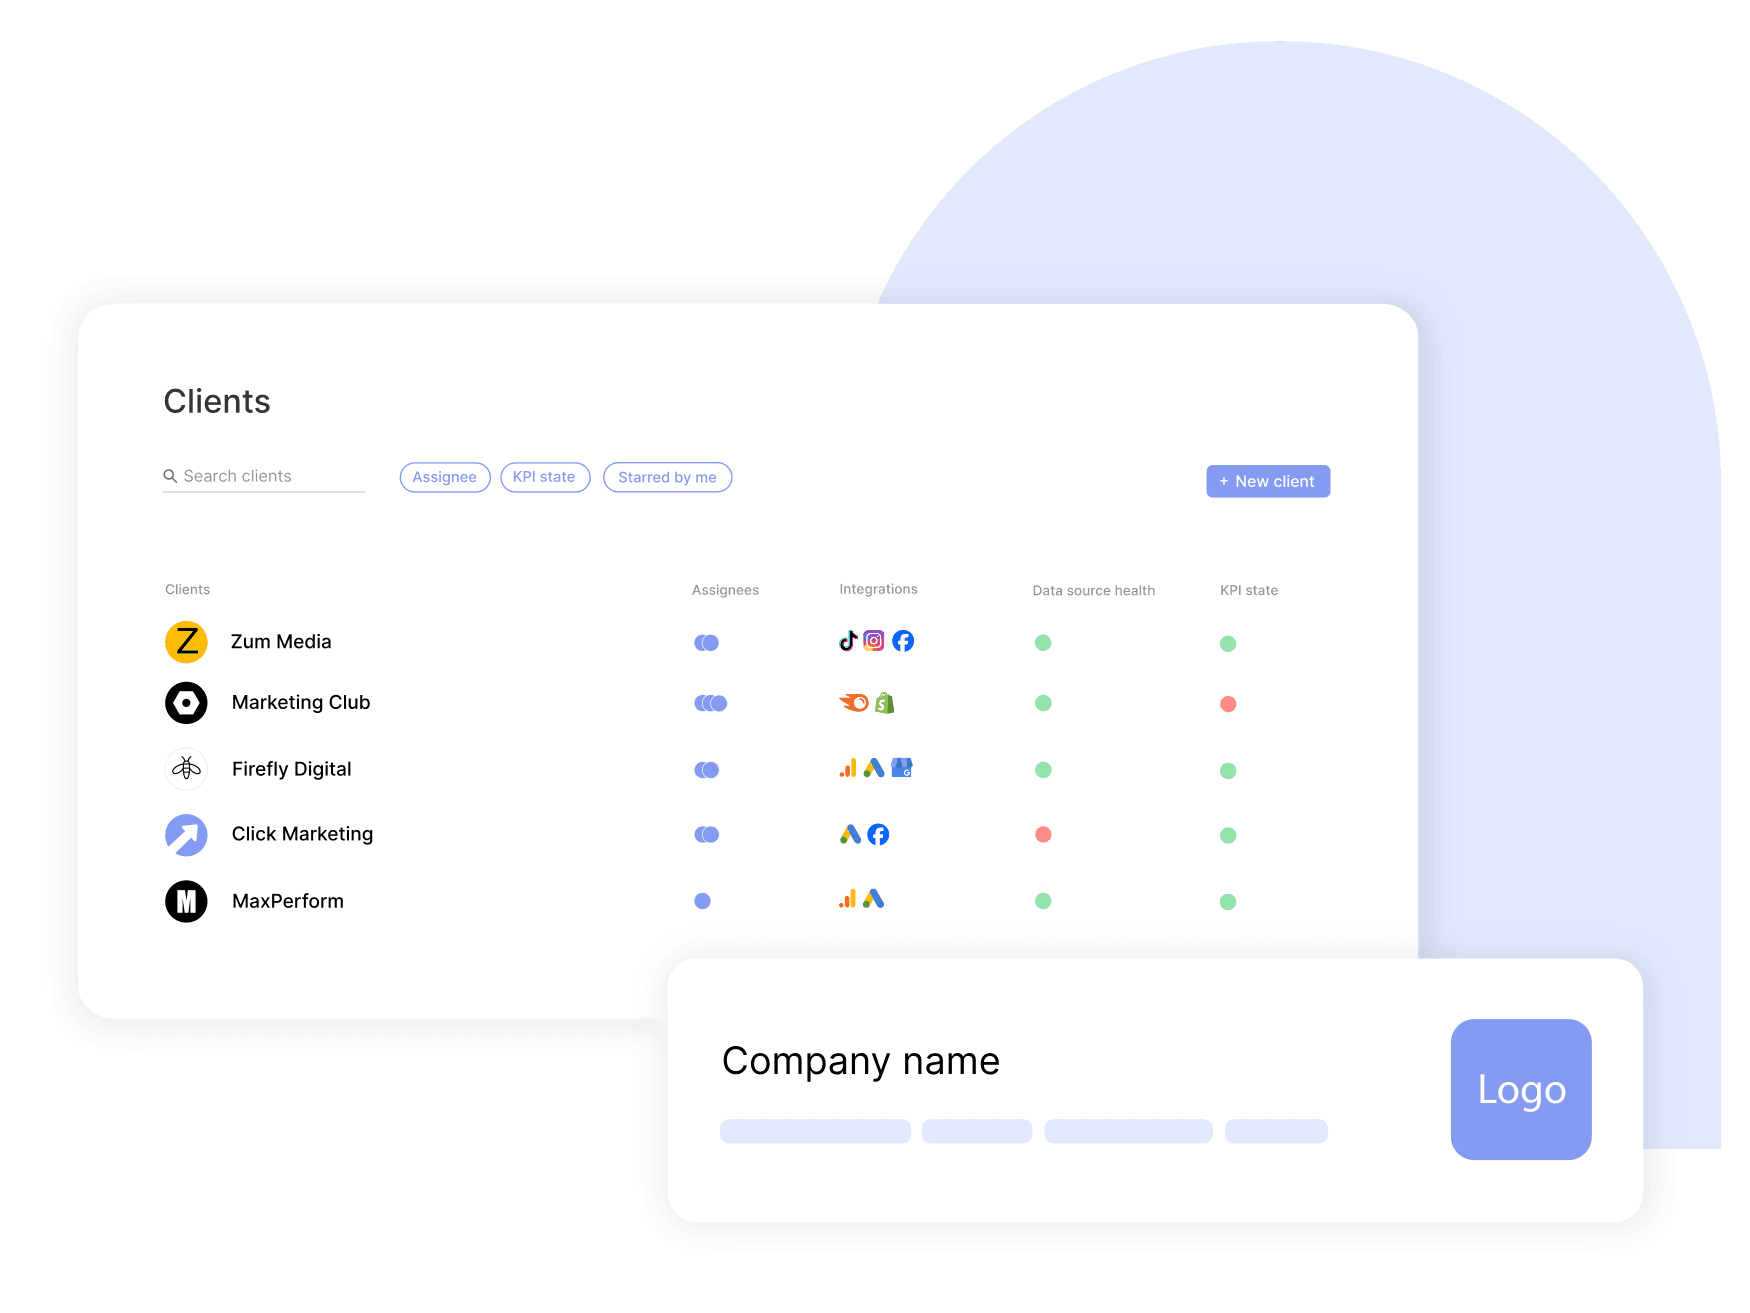
Scheduling a report
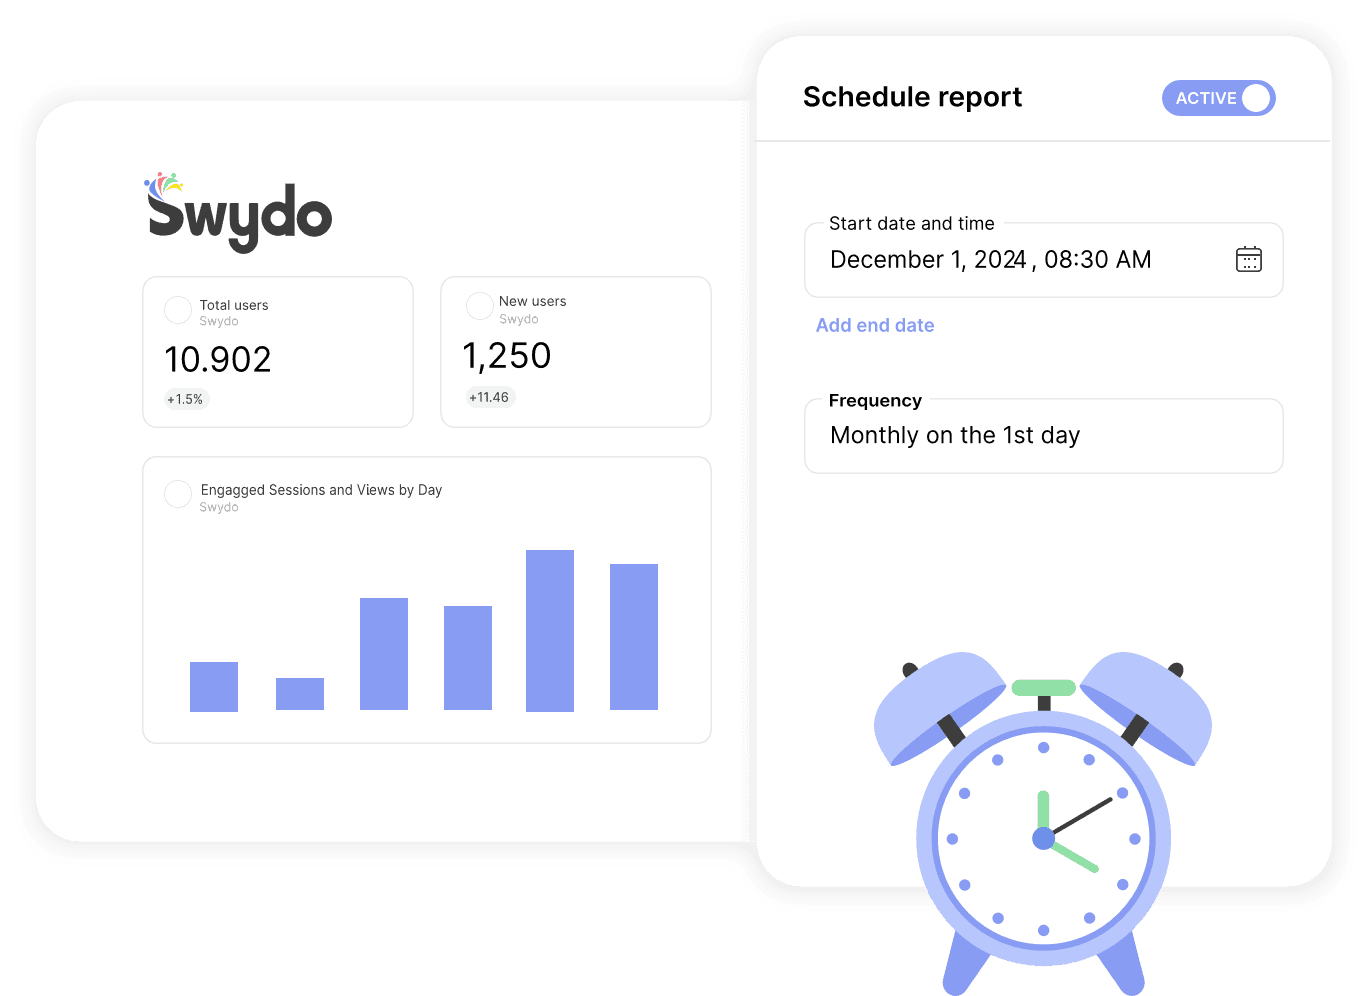
Swydo's pricing page lists unlimited clients, users, dashboards and reports, dynamic templates, white-label branding, a portal, custom domains, PDFs and scheduled delivery.
The USD base is $69/month for 10 active sources, not clients. Sources 11–100 add $4.50 each; 101–500 add $3. Annual billing discounts the full total by 10%: 30 sources = (69+20×4.50)×0.9 = $143.10/month; 75 = (69+65×4.50)×0.9 = $325.35; 150 = (69+90×4.50+50×3)×0.9 = $561.60. These assume fixed, nonduplicated sources. EU prices use EUR; this comparison uses USD.
Whatagraph remains unscored; the fixture was not completed and no hands-on result is claimed. Its official pricing page asks buyers to book a demo. Max starts at €699 a month billed annually with at least 50 source credits, unlimited users and reports, white-label reports, emailed PDFs, linked templates, version history, data groups and blends. Prime is custom priced.
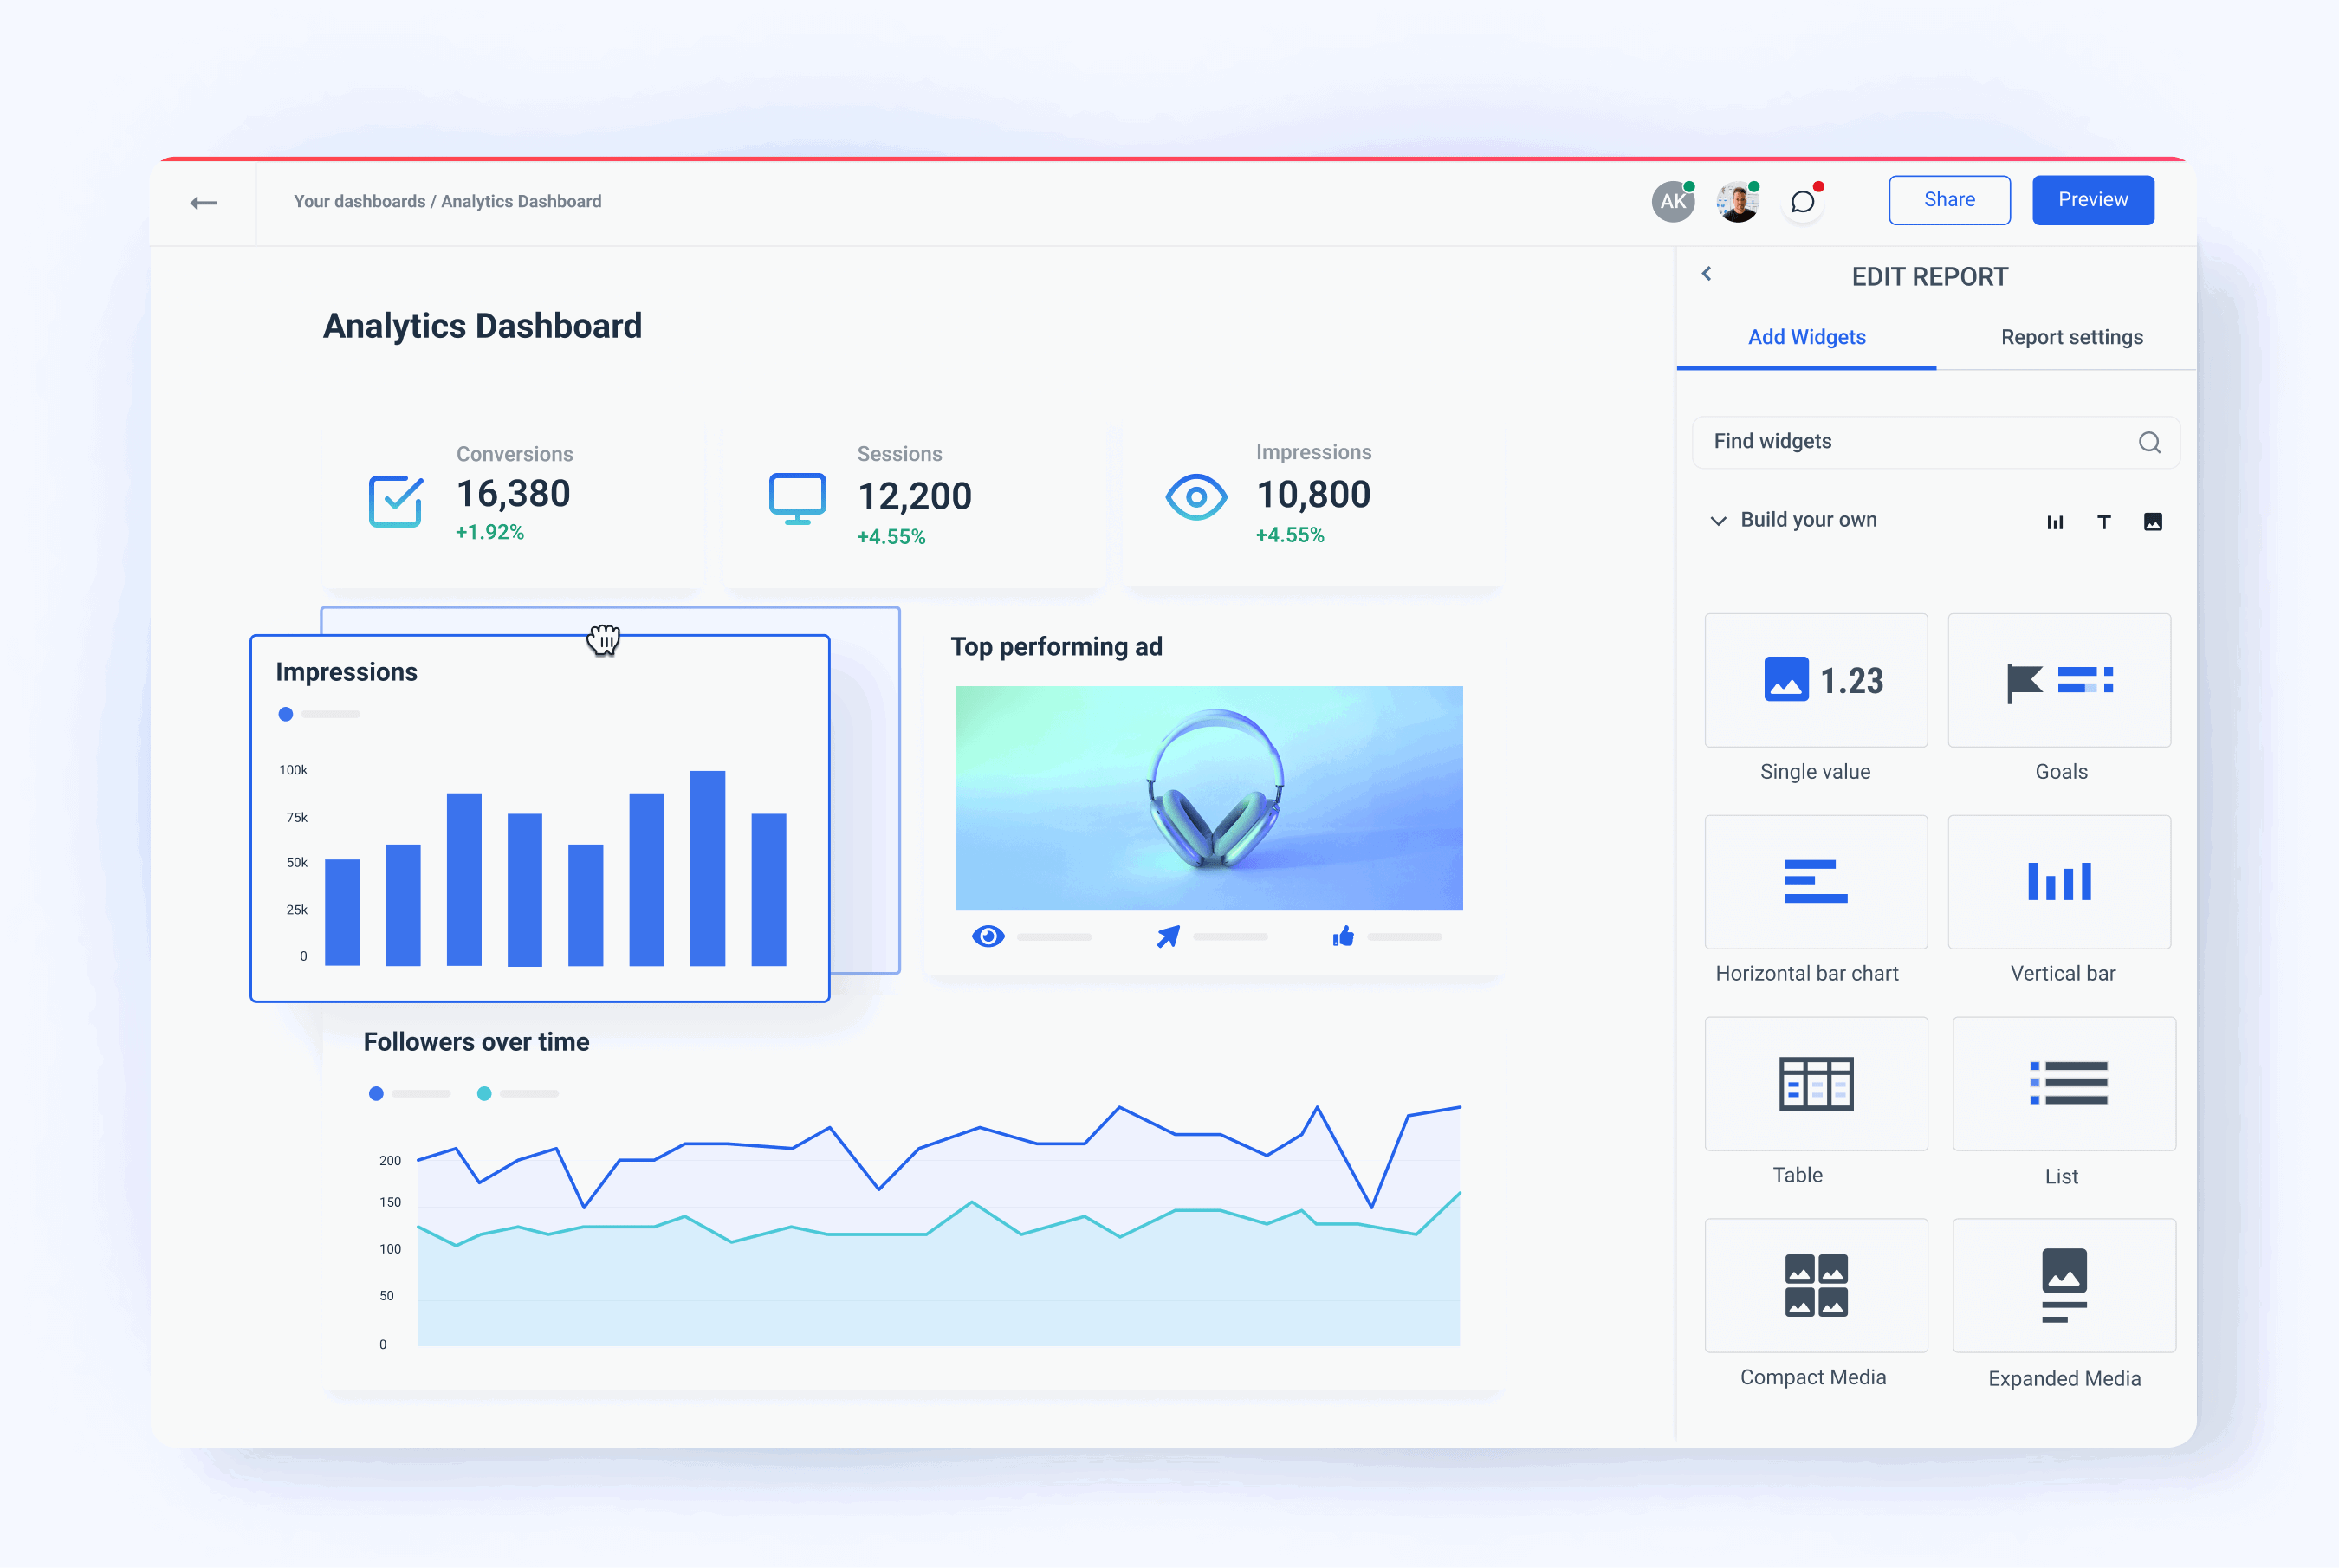
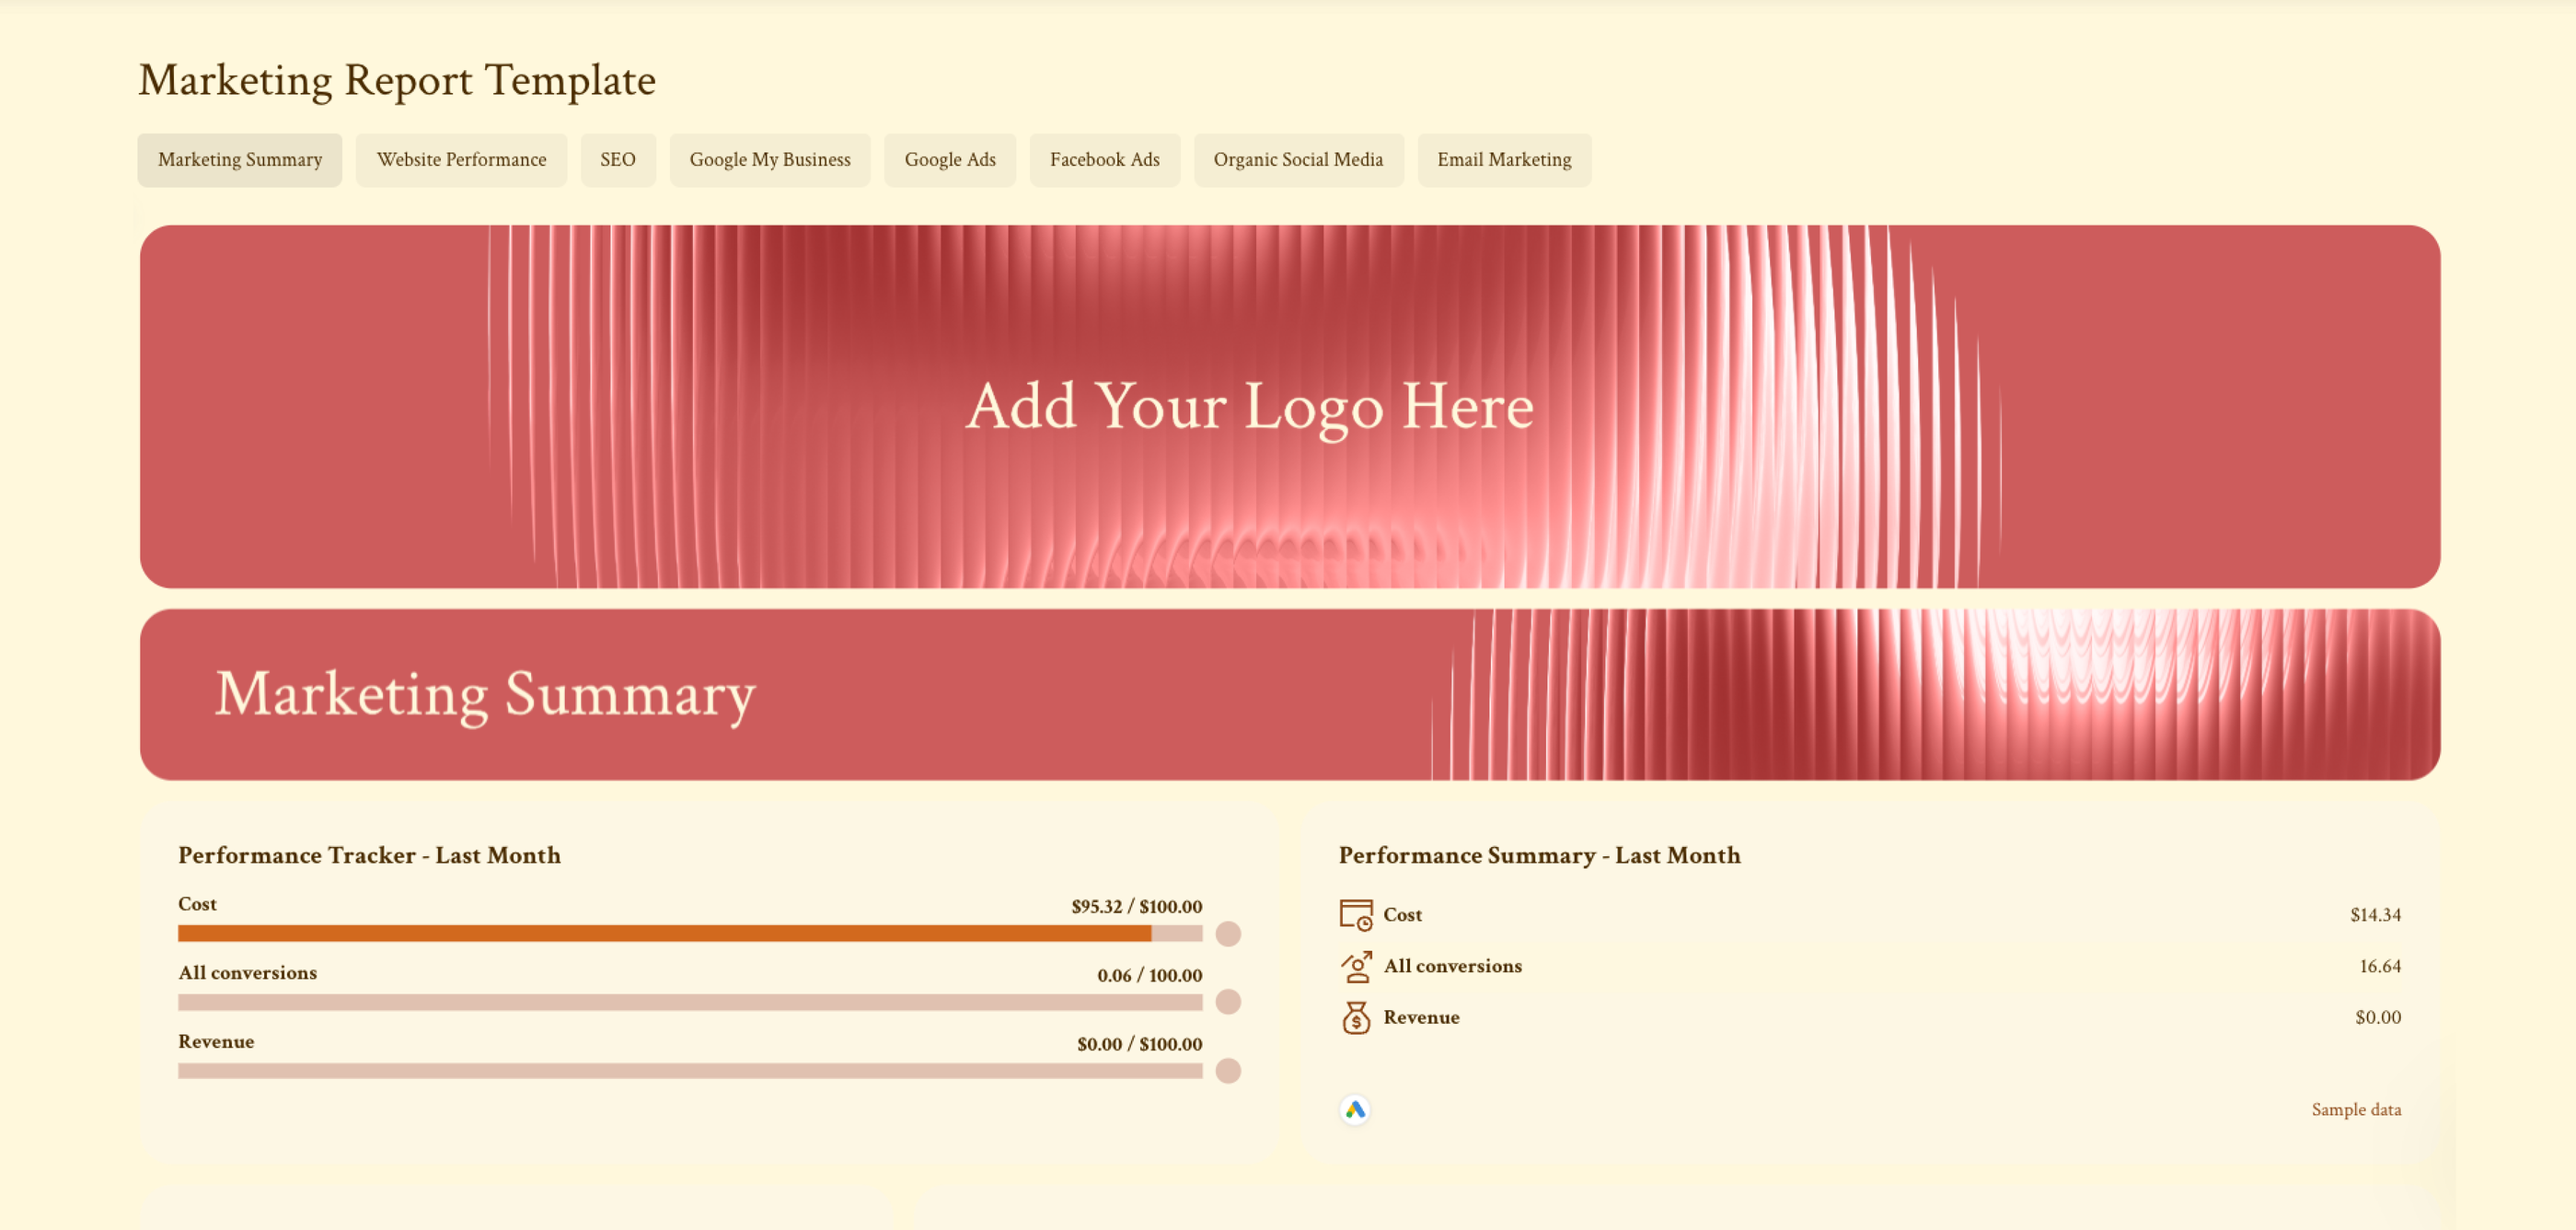
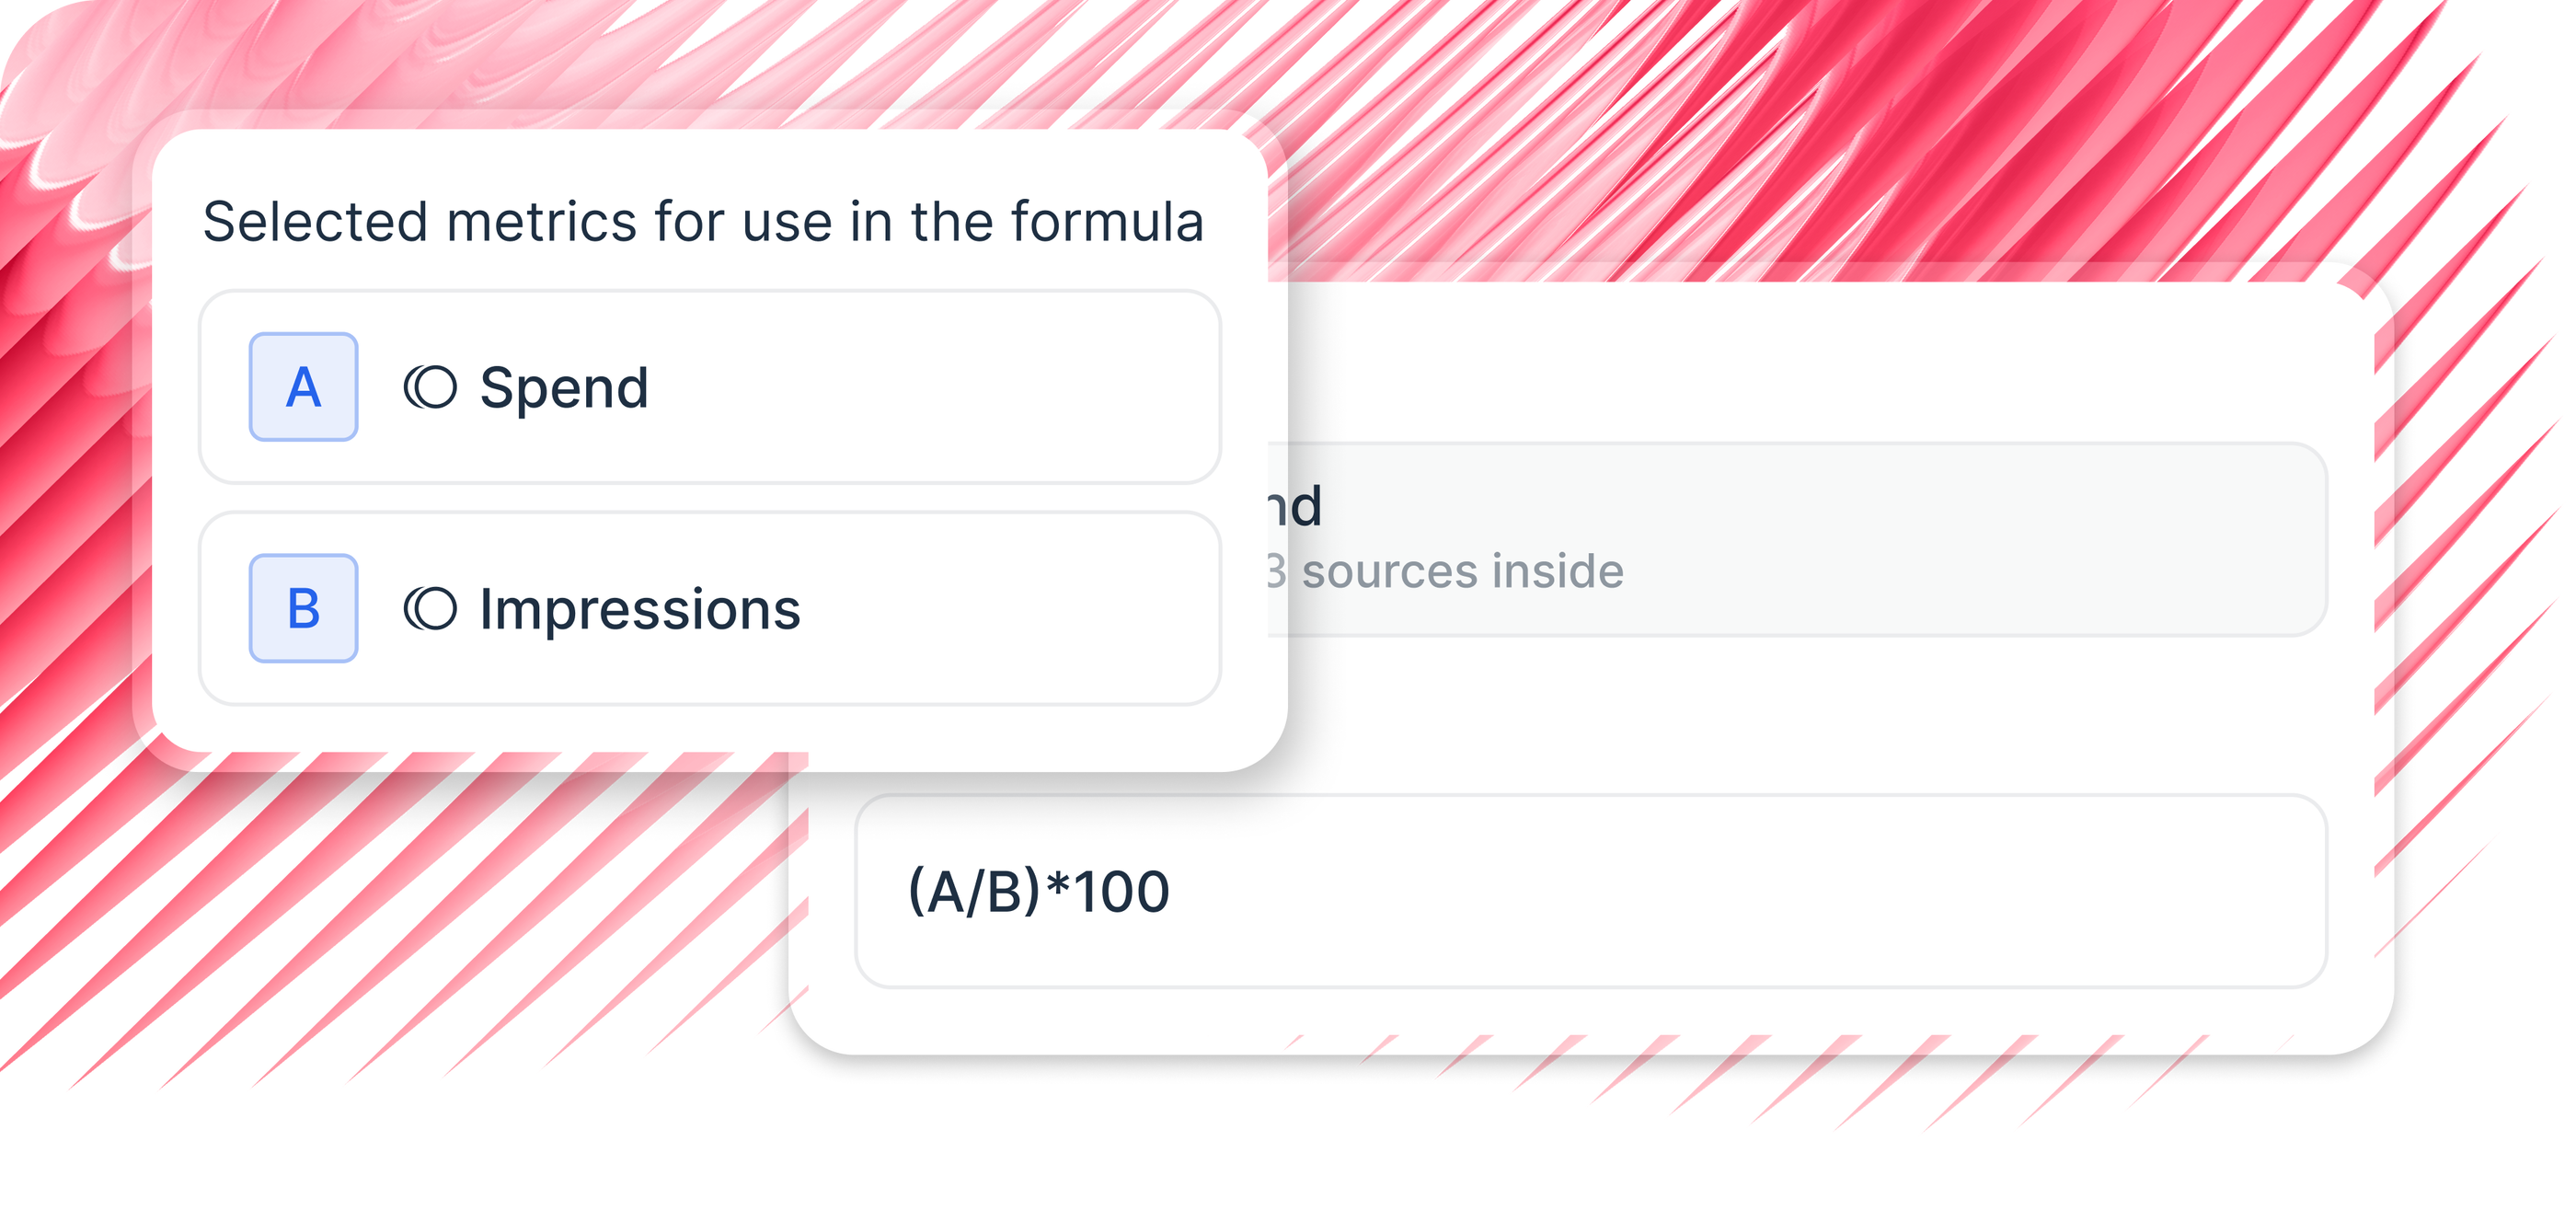
Official Whatagraph product images · retrieved 30 October 2026 · vendor examples, not our test
Editing a dashboard
Marketing report template
Building a metric
One source credit equals one connected account. Ten clients need 30 but pay the 50-credit minimum, subject to quote. Prices for 75/150 credits are unpublished. Max excludes custom domains; those require custom-priced Prime plus an add-on, even for 10 clients.
Assume one monthly report/client and one GA4 property, Ads account and Search Console site each, with scheduling/branding where sold. Prices are monthly equivalents billed annually, checked 30 October 2026: USD except Whatagraph (EUR). Taxes, staff, implementation and additional third-party services are excluded. Anomaly's file work and Data Studio's license are not equivalent portal solutions or total ownership costs.
Scroll sideways to see every column.
| Tool | 10 clients / 30 sources | 25 clients / 75 sources | 50 clients / 150 sources | Scope and verification |
|---|---|---|---|---|
| AgencyAnalytics | $200 calculated | $500 undiscounted estimate | $1,000 undiscounted estimate | Core: clients × published $20; sources, users, portal and scheduling included; 25+ discounts need a quote |
| Anomaly Pro | Not directly comparable: published $20/month equivalent ($240/year), not three verified roster prices | 12,000 annual credits upfront; illustrative 715-credit file workload above; live connections/delivery unverified; no white-label portal | ||
| DashThis | $139 published — Professional | $279 published — Business | $429 published — Standard | 10/25/50 dashboards; 40/100/200 sources; branding and email included; no required add-on; AI Insights Pro excluded |
| Databox | Custom quote required | Custom quote required | Custom quote required | Agency from $79; conditional 6/21/46 packs at $20; branding listed $200. Client-user subscriptions and branding scope unpriced |
| Klipfolio | Custom quote required; Pro fee $440 | Custom quote required; Pro fee $440 | Custom quote required; Premier fee $900 | Published fees include white-labeling and 30/80 clients AND dashboards; three-source capacity and resource fees unverified |
| Data Studio standard | $0 license | $0 license | $0 license | Published no-cost license and native Google connectors; not directly comparable: build, maintenance and portal costs excluded |
| Supermetrics | Custom quote required | Custom quote required | Custom quote required | Published Growth starting rates conflict ($159/$177/month annually); 10-account configuration unconfirmed, 25/50 exceed public ceilings. Standard Data Studio destination license adds $0; workflow cost unverified |
| Swydo | $143.10 calculated | $325.35 calculated | $561.60 calculated | One plan; 30/75/150 active sources; full tiered total ×0.9 annually; users, portal, branding and scheduling included |
| Whatagraph | From €699 published minimum — Max | Custom quote required | Custom quote required | 50-credit minimum despite 30 needed; 75/150 pricing unpublished. Branding/PDF email included; custom domain requires Prime/add-on quote |
Before cancelling, verify each gate for a pilot client; this checklist is not a vendor-specific migration procedure.
Related workflows: repeatable marketing reporting, Google Sheets to PDF, and uploaded data to client-ready PDF.
Do not assume a saved AgencyAnalytics template can be imported elsewhere. Our file tests rebuilt the reports; they did not test template portability. Preserve the layout, metric definitions, filters and delivery settings, then ask the replacement vendor to demonstrate the same report before budgeting a bulk migration.
In this synthetic dataset, 402.8 Google Ads conversions versus 320 GA4 Paid Search key events is a 25.9% difference, not a proven tracking error. Attribution models, conversion definitions, counting rules, channel filters and reporting windows can differ. The test checks the calculation and whether the difference was identified; it does not diagnose its cause.
Use the pilot to measure setup hours per client and monthly maintenance, then apply your actual staff cost. For example, two setup hours at $50 an hour add $100 per client before subscription fees. This is illustrative arithmetic, not measured savings from any tool in this comparison.
A shared dashboard gives a client access to a report. A portal may also organize that client's reports, login and permissions under your agency brand. A scheduled PDF is a delivered snapshot. Test each separately: finding a Share or Email control does not establish portal parity, white-label entitlement or successful delivery.
Confirm the export and cancellation rules for your existing account before relying on continued access. A saved PDF preserves the displayed report, not its live connections, filters or drill-down behavior. Archive the important outputs and metric definitions while you can still open them, and verify that the exported files work outside the old account.
Founder, Anomaly AI (ex-CTO & Head of Engineering)
Abhinav Pandey is the founder of Anomaly AI, an AI data analysis platform built for large, messy datasets. Before Anomaly, he led engineering teams as CTO and Head of Engineering.
LinkedInContinue exploring AI data analysis with these related insights and guides.
Choose an AI app for a spreadsheet analysis you can check, reproduce and hand over. Compare the calculations and the file you actually receive.

We gave ten AI tools, including ChatGPT, Claude and Julius AI, the same sales data and checked every answer for accuracy.
Leaving Tableau as a small team? Match the replacement to which part of Tableau you keep and which cost, setup, or specialist burden you are trying to shed.