Best Client Reporting Tools for Marketing Agencies in 2026
Client reporting is where an agency's month quietly disappears. Here are the tools worth shortlisting in 2026, compared by the job that's actually slowing you down.
Ash RaiTechnical Product Manager, Data & Engineering
13 min read
AgencyAnalytics
Swydo
Whatagraph
DashThis
Google Data Studio
Anomaly AI
Quick answer — best client reporting tools for marketing agencies in 2026
There is no single best client reporting tool for agencies; the right one depends on your binding constraint. For turnkey, fully branded reports across a roster, AgencyAnalytics (priced per client) or Swydo (priced per data source) are the most direct fit. For consolidating many sources into polished, on-brand reports, Whatagraph. For flexible dashboards on a budget, free Google Data Studio (formerly Looker Studio) or templated DashThis. And when the hard part is turning messy client data into a report whose numbers you can defend, an AI data analyst like Anomaly AI fits that job rather than the client-portal one.
Client reporting is where an agency's month quietly disappears. Every client needs the same story told again — what happened, why, and what you did about it — pulled from a different mix of accounts, cleaned up, branded, and sent on a schedule someone will notice if you miss. The tools that promise to fix this aren't really competing for the same job. One is a branded client portal, another is a data-consolidation engine, another is a dashboard builder, and another is an analyst that checks the numbers. Choosing well starts with naming your actual bottleneck.
This guide compares six tools an agency would realistically shortlist, judged on the work of repeated client delivery rather than on feature counts. Competitor pricing was checked against each vendor's live page in August 2026; where a vendor only quotes custom pricing, that's noted rather than guessed.
Two shapes of the client-reporting job
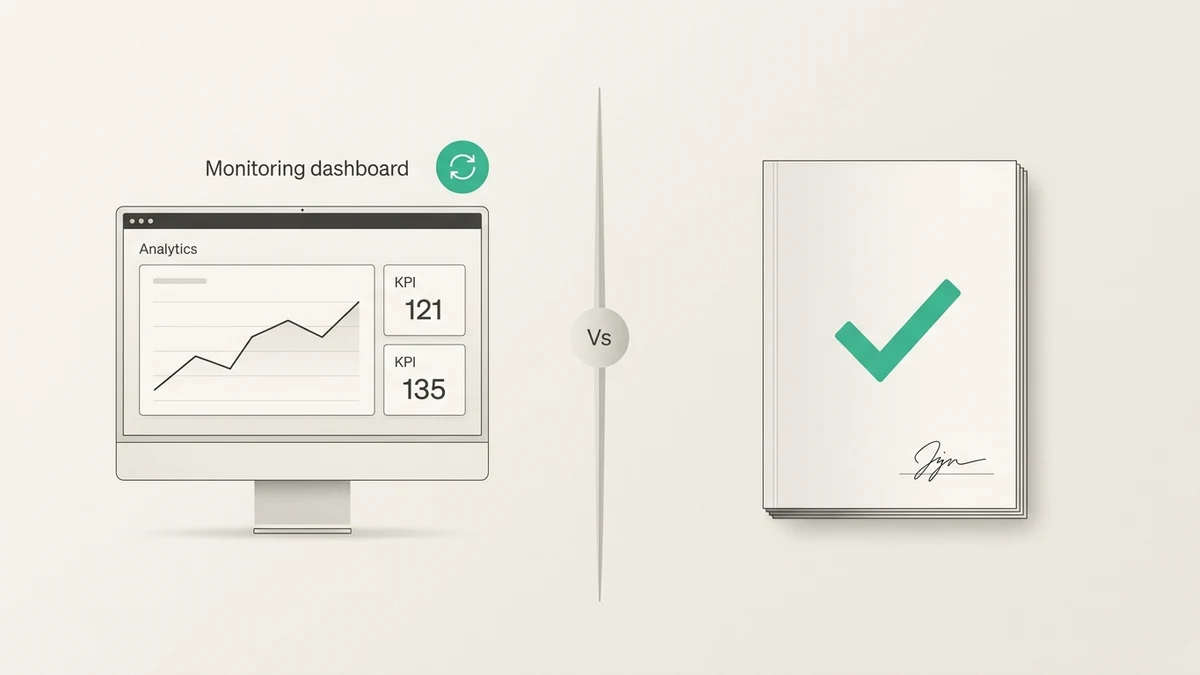
Reporting-first. Strength: recognizable, high-volume delivery. Limit: draws on its own catalog of marketing connectors, and the AI summarizes the dashboard rather than opening every calculation.
Analysis-first. Strength: makes sense of non-standard data and keeps numbers defensible. Limit: not a turnkey per-client portal, and not the widest catalog of prebuilt marketing connectors.
Most of the tools below sit on the left. One sits on the right. Naming which side your bottleneck is on is the whole decision.
01What actually decides the right client-reporting tool
Feature lists blur together. Five questions separate the tools that will genuinely save you time from the ones that just move the bottleneck somewhere else:
1
Data intake and refresh
Which of your clients' sources does it connect to, what has to be uploaded by hand, and how does new data reach the report — automatically, on a schedule, or on a click?
2
Repeatability across clients
Can you build a template once and reuse it, clone a client setup, and schedule delivery — or does each report start closer to scratch than you'd like?
3
Reviewability before delivery
Before a report leaves the agency, can you see the calculations, definitions, filters, and source rows behind the numbers? This is the criterion most reporting tools quietly skip, and the one that costs you when a client challenges a figure.
4
Client delivery experience
Dashboards, a branded portal, scheduled PDFs, a shareable link — and does the result look like your agency instead of the vendor's?
5
Agency fit
How it handles a growing roster, team permissions, and setup effort — and, the part that quietly decides more shortlists than anyone admits, how its pricing model scales with your particular mix of clients and data.
The rest of this comparison is organized around the first thing you should settle: which of these is your binding constraint.
Your binding constraint points to a tool
Volume and branding — a roster that each needs a recognizable monthly reportAgencyAnalytics, Swydo
Many light, single-channel clientsSwydo (per source)
Breadth — a wide, messy source landscape into premium reportsWhatagraph
Budget and control — happy to build your ownData Studio, then DashThis
The data itself is messy and every number must be defensibleAnomaly AI
02The six tools at a glance
Tool
Pricing model & entry (2026)
White-label + client portal
Best-fit binding problem
AgencyAnalytics
Per client — $20/client/mo (billed annually)
Yes, on all plans
Turnkey branded reporting across a roster
Swydo
Per data source — from $69/mo (10 sources incl.)
Yes, on all plans
Many clients that each use only a few sources
Whatagraph
Per source credit — Max from $812/mo (annual); Prime custom
Yes
Consolidating many sources into polished reports
DashThis
Per dashboard + sources — $44–$429/mo (billed yearly)
Included on all paid plans
Fast templated dashboards for a small/mid roster
Google Data Studio
Free; Pro $9/user/project/mo
No native white-label or client management
Google-centric teams that build their own reports
Anomaly AI
Included credits per plan — Free $0 / Pro $25/mo / Team $45/seat (pooled)
Team + public sharing and PDF; not a per-client portal
Analyzing and verifying messy client data
Pricing verified against each vendor's live page, August 2026. Order:·
03Turnkey white-label delivery: AgencyAnalytics and Swydo
If your reporting pain is volume — a roster of clients who each need a recognizable, on-brand report every month — the tools built specifically for that are AgencyAnalytics and Swydo. Both give you white-label reports, a client portal, reusable templates, and scheduled delivery out of the box. Where they differ is how they charge, and that difference decides which one is cheaper for you.
AgencyAnalytics prices per client: $20 per client per month on annual billing (about $25 monthly), with every feature, unlimited staff and client logins, white-label branding, a client portal, and 85+ marketing integrations included at that rate. A client connected to two platforms and a client connected to twelve cost the same. That makes budgeting predictable and, for agencies whose clients each pull from several sources, usually the better deal — the tradeoff being that a roster of light, single-channel clients still costs $20 apiece. Database connectors sit outside the base plan as a paid add-on.
Swydo charges the other way, per data source. One plan at $69 per month ($62 on annual billing) includes unlimited users and your first ten connected sources, with white-label and a client portal on every plan; you add sources as you connect more accounts. For an agency with many clients who each need only a couple of sources, paying by source can land well below a per-client rate. For a handful of clients who each pull from a dozen platforms, it tips the other way.
Both now layer AI over the reporting: automated summaries that flag what moved, and, in AgencyAnalytics, goal tracking, benchmarks, and forecasting. What they're built to do is assemble and deliver recognizable metrics from your connected accounts, cleanly and on schedule. Their limit for an agency is flexibility rather than intelligence — they draw on their own catalog of marketing connectors rather than arbitrary client data, and the AI summarizes the dashboard rather than opening every calculation and source row for review. That's the right trade when recognizable, high-volume reporting is the work, and a weaker one when the report is the easy part and making sense of messy, non-standard data is what takes the time.
04Consolidating many sources into polished reports: Whatagraph
Whatagraph sits at the premium end of agency reporting, aimed at teams whose problem is breadth: many clients, each with data spread across advertising, analytics, and social accounts, all of which need to land in one clean, heavily branded report. Its editor is built for polish, it blends and transforms data across sources, and the output tends to look the part in front of a client.
That capability is priced to match. Whatagraph now runs on two plans — Max, from $812 per month billed annually, and a custom-priced Prime tier — on a source-credit model where each connected account costs one credit; Max includes 50-plus credits with unlimited users and reports. There's a 14-day trial but no permanent free plan, and annual billing is the norm. For a large agency taming a wide, messy source landscape, the spend can be justified by the hours it removes. For a smaller shop it's a lot of tool for the job, and one of the per-client or per-source options above will produce a comparable client report for a fraction of the commitment. Worth remembering, too, that consolidation and reporting are separable problems — a data pipeline feeding a cheaper reporting layer is sometimes the better-value combination.
05Flexible, lower-cost dashboards: Data Studio and DashThis
Not every agency needs a purpose-built platform. If you're comfortable building your own reports, two options cover most of the ground between free and mid-market.
Data Studio is free, connects natively to GA4, Google Ads, Search Console, Sheets, and BigQuery, and gives you near-total control over how a report looks. For agencies living in Google's stack it's the obvious starting point, and the price is hard to argue with. The costs surface elsewhere: there's no built-in client-management or white-label layer, blending non-Google sources such as Meta or LinkedIn usually means paying for a connector like Supermetrics on top, and every hour spent building and maintaining templates is unbilled. Data Studio Pro adds governed team workspaces and Gemini assistance at $9 per user per project per month, billed per Google Cloud project — which, for an agency running a project per client, adds up.
DashThis is the paid, faster version of the same idea: templated dashboards you assemble from 30-plus integrations instead of designing from a blank canvas. Its pricing moved in 2026 to a dashboard-plus-source model — Individual at $44 per month, Professional at $139, Business at $279, and Standard at $429 on annual billing — and because agencies usually build one dashboard per client, your plan tends to climb with your client count, with a second limit on the number of connected sources. White-labeled dashboards, a custom domain, and custom email appear across all four paid plans on its current pricing table. It's a sensible middle path for a small agency that wants speed without a platform-sized commitment, provided you keep an eye on the dashboard and source caps as the roster grows.
06When the hard part is the data, not the packaging: Anomaly AI
The tools above are reporting-first: they connect your marketing accounts, assemble recognizable metrics, deliver them on brand and on schedule, and increasingly summarize them with AI. That covers the bulk of agency reporting. Some of it is a different shape, though. If a client hands you a year of messy exports, a database, or a spreadsheet too large to open, or if the recurring question is less "show the metrics" and more "explain what changed and prove it," then the binding constraint is the analysis, not the layout.
That's the job Anomaly AI is built for. It's an AI data analyst: connect Excel or CSV files, GA4, Google Sheets, BigQuery, MySQL, or Snowflake — or drop in a client's ad-account exports — ask in plain language for what you need, and it builds the dashboard and turns the analysis into a client-ready output: an interactive dashboard, an Excel report, a PowerPoint deck, or a PDF. Shareable dashboards and automatic report scheduling — delivered by email with the PDF attached — come in on the Pro plan and above. What sets it apart for agency work is the third criterion above: the analysis is meant to be reviewed, not taken on faith. You can inspect the logic, the SQL, the source data, the filters, and the calculations behind the numbers before a report goes out, and it preserves your metric definitions and business rules so recurring reports stay consistent from one cycle to the next. When a client asks why a figure moved, you have the working, not just the chart. The free tier lets you try it; Pro is $25 per month, and the Team plan is $45 per seat per month with credits pooled across the team.
A client report Anomaly built from campaign data
First-party Anomaly AI product screenshot; figures are illustrative sample data. Asking Anomaly to build a client marketing report from uploaded campaign data produced these spend, leads, and ROAS cards and a channel-by-month spend chart — each figure traceable to the source data. Anomaly AI.
A number you can defend
Illustrative. When a client challenges a figure, what you want is to open the source rows, filter, and formula behind it — the working, not just the chart. That's the job an AI data analyst like Anomaly AI is built for.
Be clear about where it isn't the right pick. Anomaly is not a turnkey, fully white-labeled client portal, and it doesn't carry the widest catalog of prebuilt marketing connectors — if the job is branded reports for forty clients each pulling from a dozen ad platforms, a per-client platform like AgencyAnalytics or a consolidation tool like Whatagraph will serve you better. It isn't a real-time or streaming dashboard, it doesn't deliver to Slack, and it isn't a code notebook or an automated anomaly-detection or forecasting product. Reach for it when reviewable analysis of real, messy client data is the part that actually eats your month.
07Why the pricing model matters more than the sticker price
The headline price on a reporting tool tells you little until you map it to your own shape. Several models are in play here, and each rewards a different kind of agency:
Per client
AgencyAnalytics
Flat and predictable; every client costs the same regardless of how many sources it uses. Best when your clients are data-heavy; least efficient when you carry many light, single-channel accounts.
per-client rate stays flat, not total cost · illustrative
Per data source
Swydo, and Whatagraph’s credits
Scales with reporting depth, not client count. Best when you have many clients that each need only a few sources; it climbs fast for a few source-hungry ones.
cost as sources grow · illustrative
Per dashboard and source
DashThis
Tends to track client count, since most agencies build one dashboard per client, with a second lever on the sources behind them.
cost as clients grow · illustrative
Free but time-costed
Data Studio
No license fee, but you pay in unbilled setup and maintenance, plus add-on connectors for non-Google data.
hours as reports grow · illustrative
Included credits, or per seat
Anomaly AI
The Free, Pro, and Analyst plans bundle a monthly credit allowance you spend on analysis and outputs; the Team plan is priced per seat with credits pooled across the team. It suits irregular, analysis-heavy work better than a fixed roster of identical monthly reports.
cost steps up with plan/seats · illustrative
Illustrative cost shapes, not measured data. Read the curve, not the sticker price.
The cheapest tool on paper is often the most expensive once your actual mix of clients and sources is plugged in.
Before comparing sticker prices, do the arithmetic for your real roster: count your clients, count the sources each one needs, and run two or three models against those numbers. The cheapest tool on paper is often the most expensive once your actual mix of clients and sources is plugged in.
08Match the tool to your agency
A growing roster that needs recognizable, branded reports every month, with clients that each use several sources
start with AgencyAnalytics.
Many clients that each need only a couple of sources
price out Swydo's per-source model first.
A large agency consolidating a wide, messy source landscape into premium reports
Whatagraph, if the budget matches the breadth.
A Google-centric team happy to build and maintain its own reports
Data Studio, moving to DashThis when you want templated speed without the upkeep.
Recurring reports where analyzing and verifying messy client data is the real work
What is the best client reporting tool for a marketing agency?
There isn't a single best; it depends on your binding constraint. For turnkey branded reports across a roster, AgencyAnalytics (per client) or Swydo (per source). For consolidating many sources into polished reports, Whatagraph. For flexible dashboards on a budget, Data Studio (free) or DashThis (templated). For recurring reports where analyzing and verifying messy data is the hard part, an AI data analyst like Anomaly AI.
What's the most affordable way to report for many clients?
It depends on the shape of your roster, not the sticker price. If you have many clients that each use only a few sources, a per-source model like Swydo is often cheapest; if your clients are data-heavy, a flat per-client rate like AgencyAnalytics can win. If you're willing to build and maintain reports yourself, Data Studio is free.
Which client reporting tools offer white-label reports?
AgencyAnalytics and Swydo include white-label branding and a client portal on every plan. Whatagraph includes white-label reporting, and DashThis includes white-labeled dashboards, a custom domain, and custom email across its paid plans. Data Studio has no native white-label or client-management layer.
How do I keep client report numbers consistent and defensible?
Choose a tool that lets you review the calculations, metric definitions, filters, and source data before a report goes out, and that preserves those definitions so each cycle stays consistent. Many reporting platforms now add AI summaries but still present the finished dashboard rather than the calculations and source behind each figure; a tool that keeps the logic and source inspectable is what lets you reconcile a challenged number and defend it.
Can one tool both analyze the data and deliver the client report?
Reporting platforms assemble and deliver metrics from your connected accounts, increasingly with AI-generated summaries, and they're built around delivery to clients. An AI data analyst such as Anomaly AI is built around the analysis itself — working from arbitrary uploaded or connected data, generating the dashboard and report, and keeping the logic and source inspectable. If what you need is primarily a branded client portal at scale, a dedicated reporting platform is the better fit; if it's open-ended analysis of non-standard data, an analyst tool is.
—The bottom line
The best client reporting tool for your agency is the one that removes your binding constraint, not the one with the longest feature list. If that constraint is volume and branding, a per-client or per-source platform pays for itself; if it's consolidating a sprawl of sources, Whatagraph earns its price at scale; if it's budget and control, Data Studio or DashThis will do. And if the part that actually eats your month is making sense of messy client data and being able to defend every number in the report, that's the job Anomaly AI is built for — connect the data, get a dashboard and a client-ready report you can trace and reuse, and start free. Whatever you shortlist, price it against your real roster before you commit.
Ash Rai is a Technical Product Manager with 5+ years of experience building AI and data engineering products, cloud and B2B SaaS products at early- and growth-stage startups. She studied Computer Science at IIT Delhi and Computer Science at the Max Planck Institute for Informatics, and has led data, platform and AI initiatives across fintech and developer tooling.