AI Agents for Marketing Analytics: Check the Numbers
One weekly marketing question, asked from Claude Code through Anomaly’s MCP server and traced to its SQL and rows, with the daily-users trap worked out in the open.
Abhinav Pandey··13 min read
Quick answer — AI agents for marketing analytics
An AI agent for marketing analytics is an assistant, such as Claude or ChatGPT, that reaches your marketing data through a connection. It runs the queries a question needs and returns an answer, chart or report. Its answer is only as good as the definitions behind it. On our downloadable sample, adding up seven daily user counts gives 6,527 “users” for one week; counting each person once gives 4,603. Start read-only, ask one recurring question, and check the number against its SQL and rows.
AI agents for marketing analytics can answer the Monday question, “how did last week go?”, without anyone writing a query. In our run, the first answer took about 12 minutes. The risk is not invented numbers but a definition you would not have picked. On the same rows, users grew 20.7% or 38.8% week over week, depending on whether each person was counted once or once per day.
This guide, for marketers and agency analysts, follows one weekly question from Claude Code, through Anomaly’s MCP server, to the SQL and rows behind the answer.
What AI agents for marketing analytics do
An agent differs from a chatbot and an automation in where it starts and what it can reach:
Chatbot
Automation
AI agent
Starts from
A question
A trigger
A goal
Data it sees
What you paste
Set fields
What its tools reach
Steps
One reply
Fixed
Plans and adjusts
Changes things
No
By rule
Only if allowed
AI marketing agents are AI assistants that do marketing work through connected tools. Lists of them mix two jobs: content and campaign agents write copy or move budget. A marketing analytics AI agent reads Google Analytics (GA4), Google Ads or spreadsheet data and answers performance questions, such as which channel moved or whether Google Ads and GA4 agree. That is the lowest-risk way to use agentic AI in marketing, because a read-only agent cannot spend money. For agents that act on spend, Sigma’s guide covers spend limits, approvals and logs. Anomaly is not a content or campaign agent and never changes campaigns.
Before you connect an agent to marketing data
Four questions decided whether our answers were usable:
What can it change? Start read-only. Google’s own Google Ads MCP server is read-only in its current release and “cannot modify bids, pause campaigns, or create new assets” (verified 8 October 2026). Queries Anomaly runs cannot change your data.
Where do the definitions live? “Users”, “conversion” and “week” each need one meaning that every answer reuses, or the definition can drift between Mondays.
What does a question cost? Through Anomaly, MCP is on Pro and above: $25 a month, or $20 a month billed yearly (pricing). Each question uses credits, about 3 per message on average, and there is no separate MCP fee (both verified 8 October 2026).
How will you check a number? Ask for the SQL and rows behind any figure that reaches a decision, and keep a copy of the data.
A worked run: one weekly question from Claude Code
Disclosure: We make Anomaly AI. This guide shows one run through it; other routes exist.
Anomaly AI is an AI data analyst for large datasets and spreadsheets. Your agent asks it questions through MCP; Anomaly runs the queries with its metric definitions and returns numbers you can check.
How to use an AI agent for marketing analytics, in four steps: connect it, ask a recurring question, check the SQL and rows, then build a weekly report.
Method (8 October 2026): we generated a synthetic sample for a fictional online furniture store. It holds 159,863 GA4-export-shaped events over eight Monday-to-Sunday weeks (10 August to 4 October 2026) and a 168-row Google Ads daily report. We uploaded it to a new project in an Anomaly test account, connected Claude Code 2.1.295 (model: Claude Opus 5.5) to Anomaly’s MCP server and asked the questions below. A separate script re-computed every number on this page.
Download the sample
marketing-agent-sample.xlsx holds both tables plus an about sheet with the definitions and the Google Ads crediting rule. It is synthetic, with no real users or spend, and reproduces every number on this page.
Add the server URL to your AI assistant, then sign in through the browser. There is no API key to copy. We ran these two commands in a terminal:
claude mcp add --transport http --scope user anomaly https://mcp.findanomaly.ai/mcp
claude mcp login anomaly --no-browser
--no-browser prints the sign-in link, which we opened where our test account was signed in; without it, your default browser opens. The sign-in page asked whether to allow “Claude Code (anomaly)” to use Anomaly. Once allowed, the agent acts as you, sees only your projects and uses your credits. To use Claude, ChatGPT, Cursor or VS Code instead, set up Anomaly’s MCP server for that client.
How it was checked:claude mcp list reported anomaly: https://mcp.findanomaly.ai/mcp (HTTP) - ✔ Connected.
02Step 2: Ask the weekly question
Name the project and spell out the week. Our prompt:
Prompt to Claude Code
Ask Anomaly, in my project "AI agents for marketing analytics - sample data", for our weekly marketing check: how did last week (Monday 28 September to Sunday 4 October 2026) compare with the week before? I want users, sessions, purchases and revenue, in total and by channel, plus Google Ads spend, conversions and cost per conversion. Give me the headline numbers and the link to the chat.
Claude Code found the project, rewrote our request as a question for Anomaly and collected the answer. Below is the run’s transcript, with replies in the Markdown Anomaly returned; “[…]” marks cuts and IDs are shortened.
Claude Code ↔ Anomaly MCP · transcript excerpt (8 Oct 2026)
anomaly · list_projects
  {"search": "AI agents for marketing analytics sample data"}
→ […] AI agents for marketing analytics - sample data (id: 5f7db976-[…], last activity: 2026-10-08)

anomaly · ask_anomaly
  {"project_id": "5f7db976-[…]",
   "question": "Weekly marketing check: compare last week (Monday 28 September to Sunday 4 October 2026) with the week before […]. Please give users, sessions, purchases and revenue, both in total and broken down by channel […]"}
→ Status: working […]

anomaly · get_answer
→ Status: complete […]
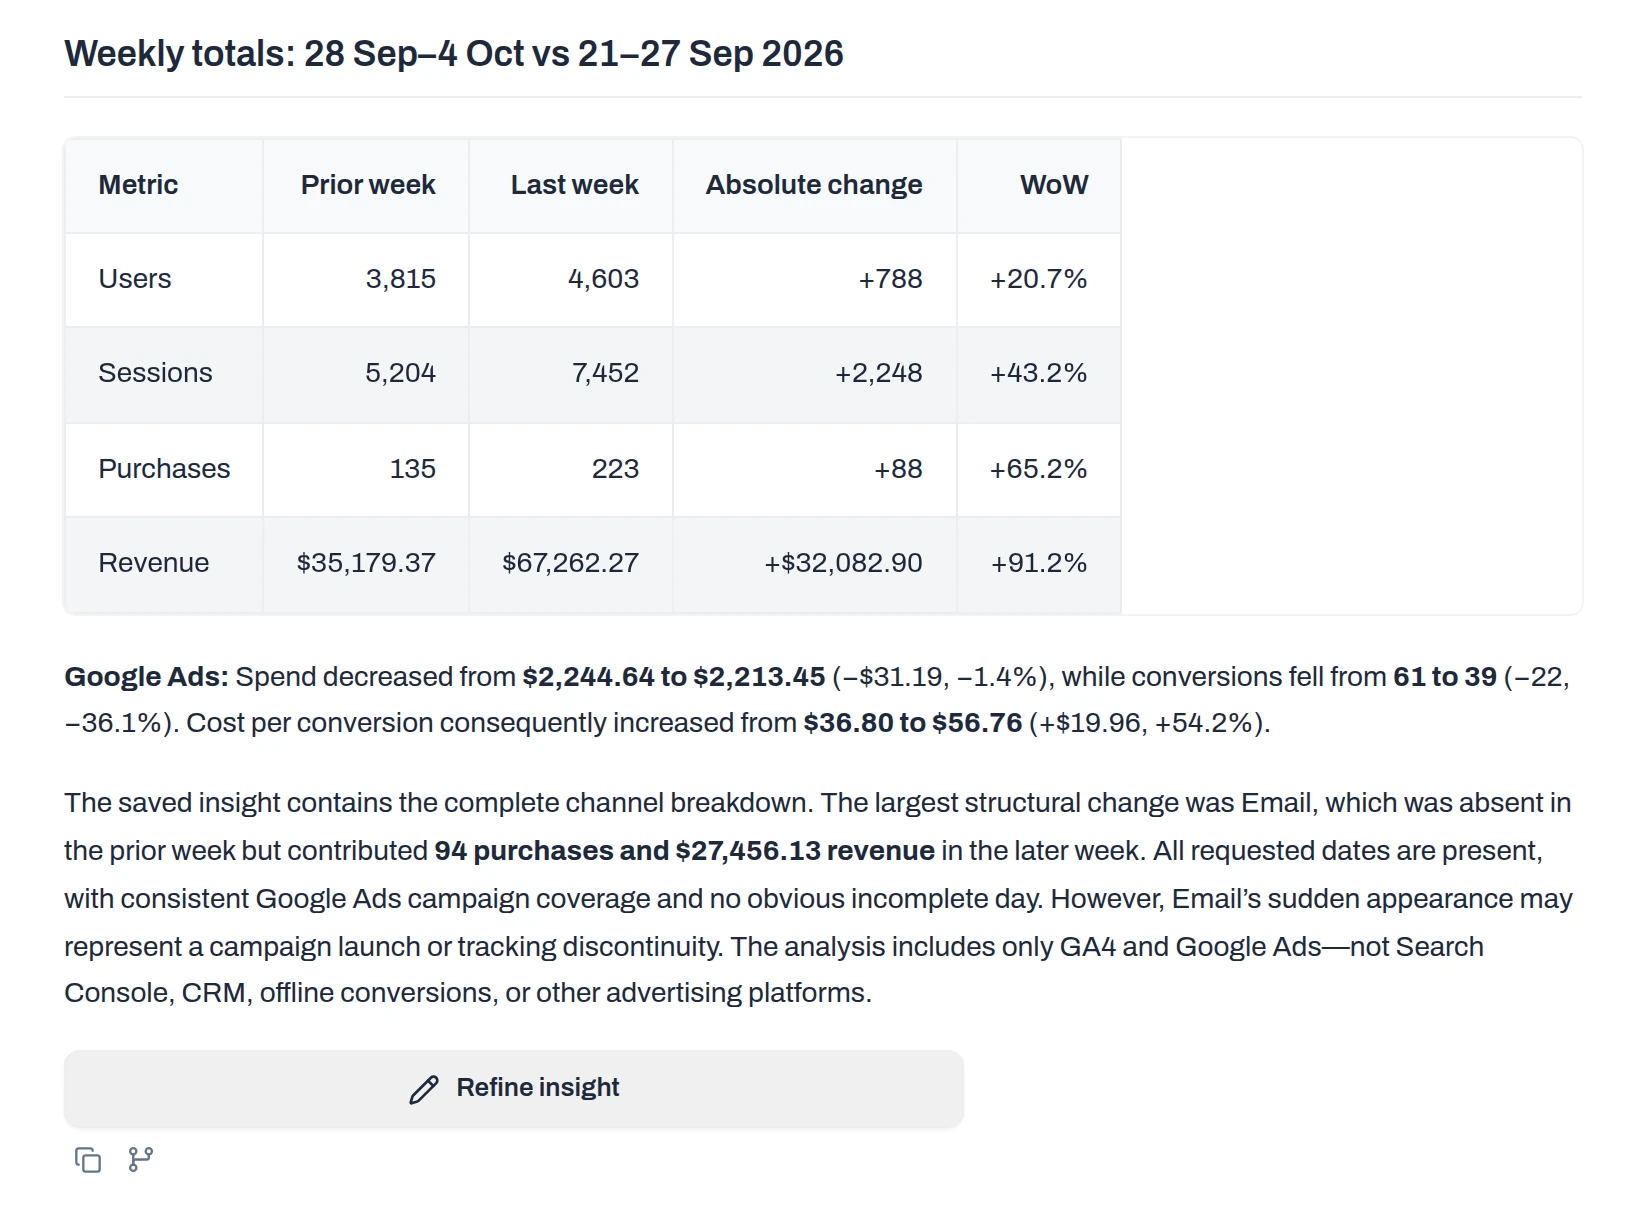
  | Metric | Prior week | Last week | Absolute change | WoW |
  |---|---:|---:|---:|---:|
  | Users | 3,815 | 4,603 | +788 | +20.7% |
  […]
  | Revenue | $35,179.37 | $67,262.27 | +$32,082.90 | +91.2% |

  **Google Ads:** Spend decreased from **$2,244.64 to $2,213.45** (−$31.19, −1.4%), while conversions fell from **61 to 39** (−22, −36.1%). Cost per conversion consequently increased from **$36.80 to $56.76** (+$19.96, +54.2%).
  […]

Claude Code:
  Channel user counts add up to more than the total, because some people came in through more than one channel.
Anomaly took about 12 minutes on this first question (follow-ups took under two minutes): it checked that every day was present, built a comparison table and saved an insight. One get_answer call never returned; asking Claude Code to collect the answer again brought it back at once. The question also appears as a normal chat in the Anomaly project, with every step Anomaly took:
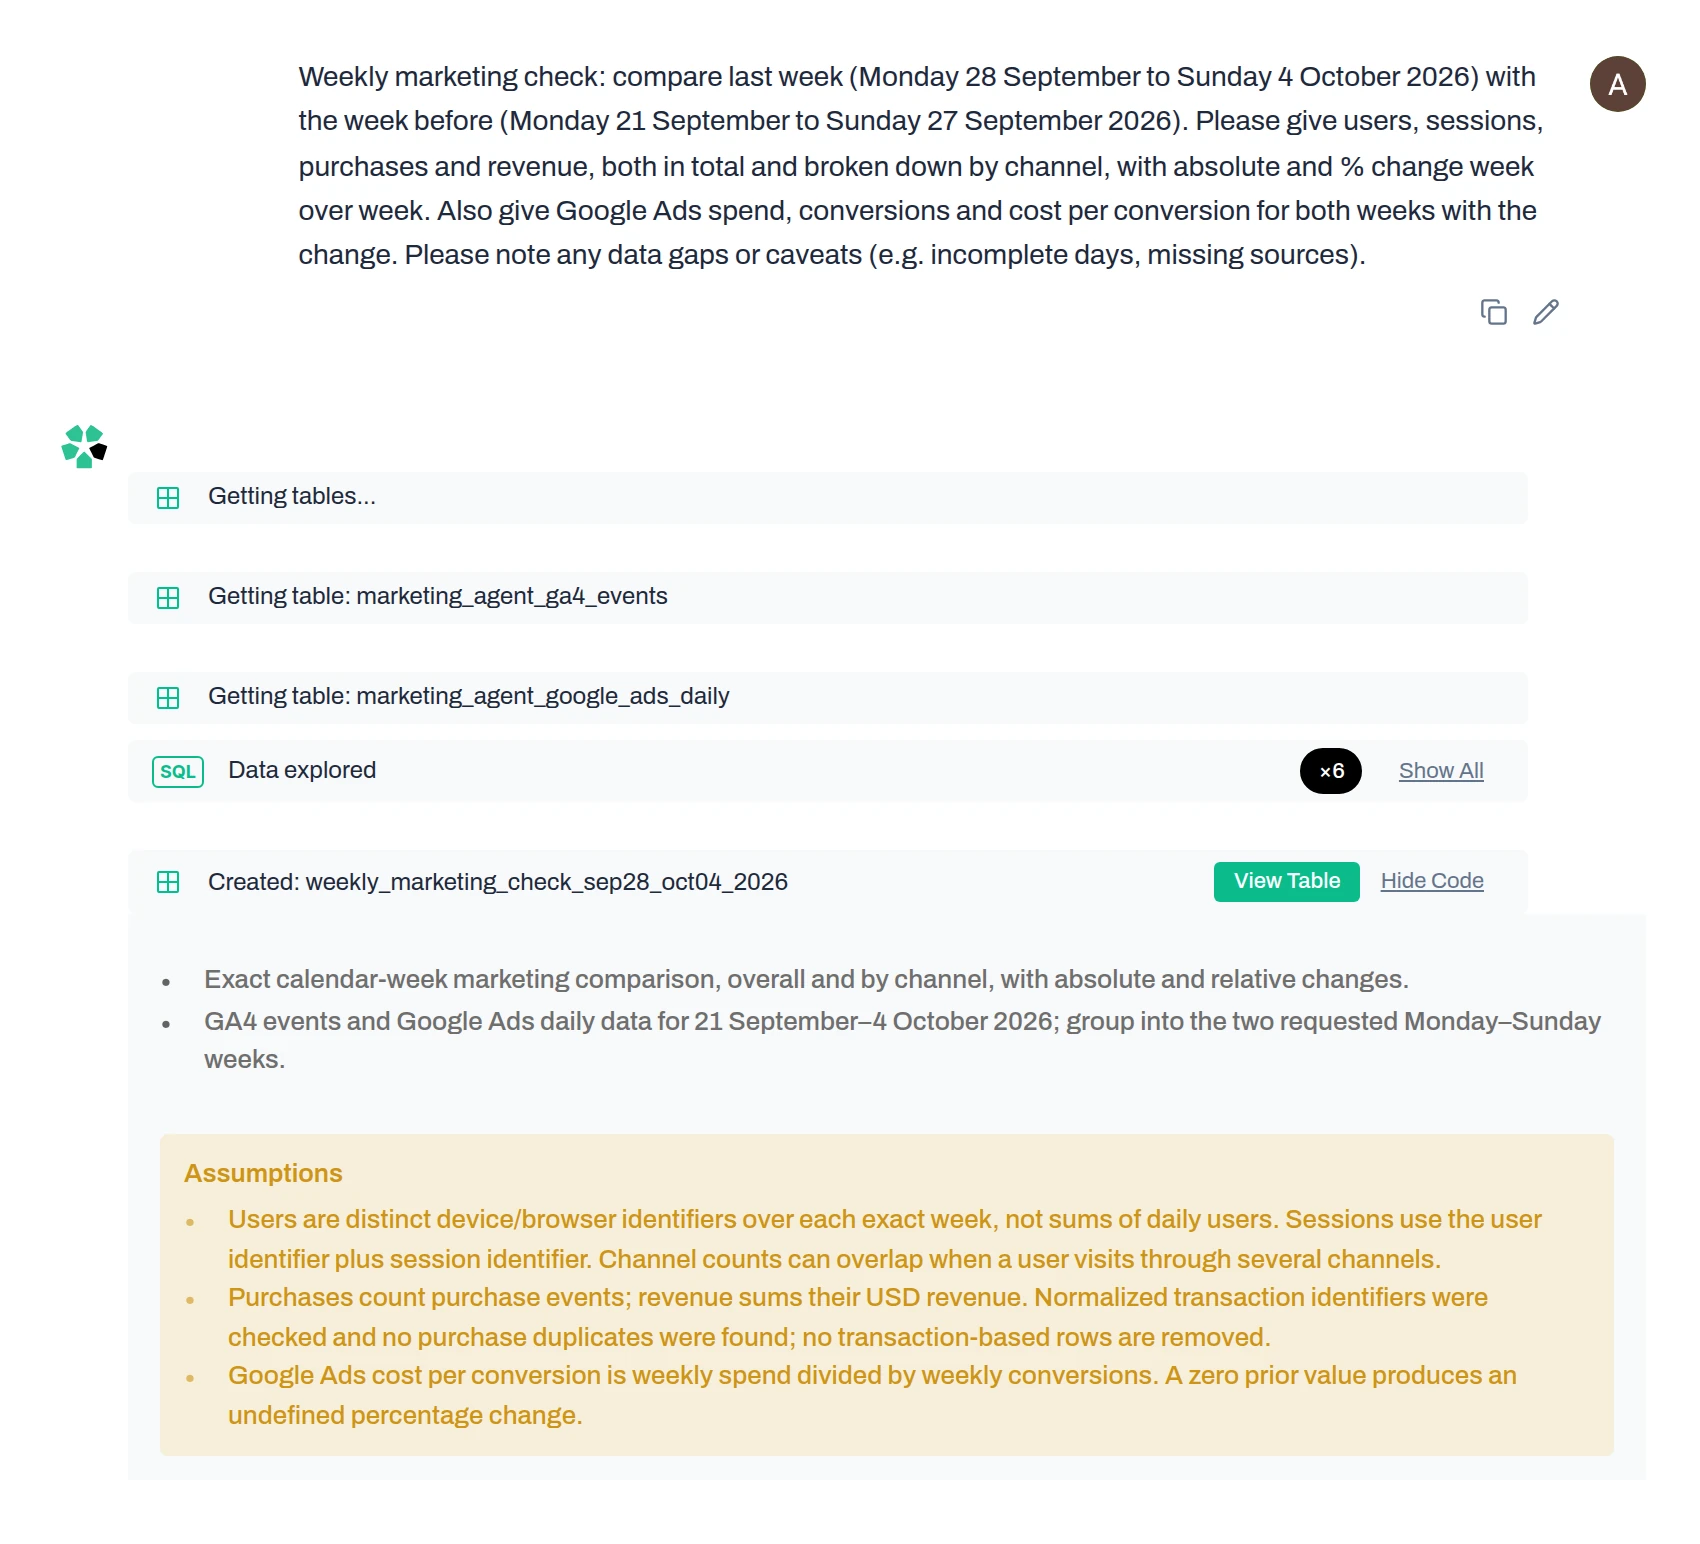
The question Claude Code sent through MCP, as it appears in the Anomaly chat, with the steps Anomaly took and the assumptions it recorded: users are counted once per exact week, not summed from daily counts. First-party Anomaly screenshot; synthetic sample data.
Anomaly’s answer in the chat: the weekly totals and the Google Ads changes that Claude Code relayed. First-party Anomaly screenshot; synthetic sample data.
How it was checked: the totals match our independent script exactly. The closing channel note was Claude Code’s own.
03Step 3: Check the SQL and the rows
To see how the answer was counted, we asked a follow-up in the same chat, with a deliberately labelled wrong figure for comparison:
Prompt to Claude Code
Ask Anomaly, in the same chat: show me exactly how it counted weekly users. I want the SQL and the rows behind the users number for both weeks. Next to it, add a column clearly labelled "sum of 7 daily user counts (not a user count)" so I can see how far apart the two are, and say which one belongs in the report.
Anomaly answers by writing SQL against your tables (text-to-SQL) and keeps each query beside the chart or table it produced. Its reply, shortened:
Transcript excerpt · follow-up in the same chat
anomaly · ask_anomaly
  {"conversation_id": "da7df696-[…]",
   "question": "Please show me exactly how you counted weekly users. […] add a column labelled exactly "sum of 7 daily user counts (not a user count)" […]"}
→ Status: complete […]
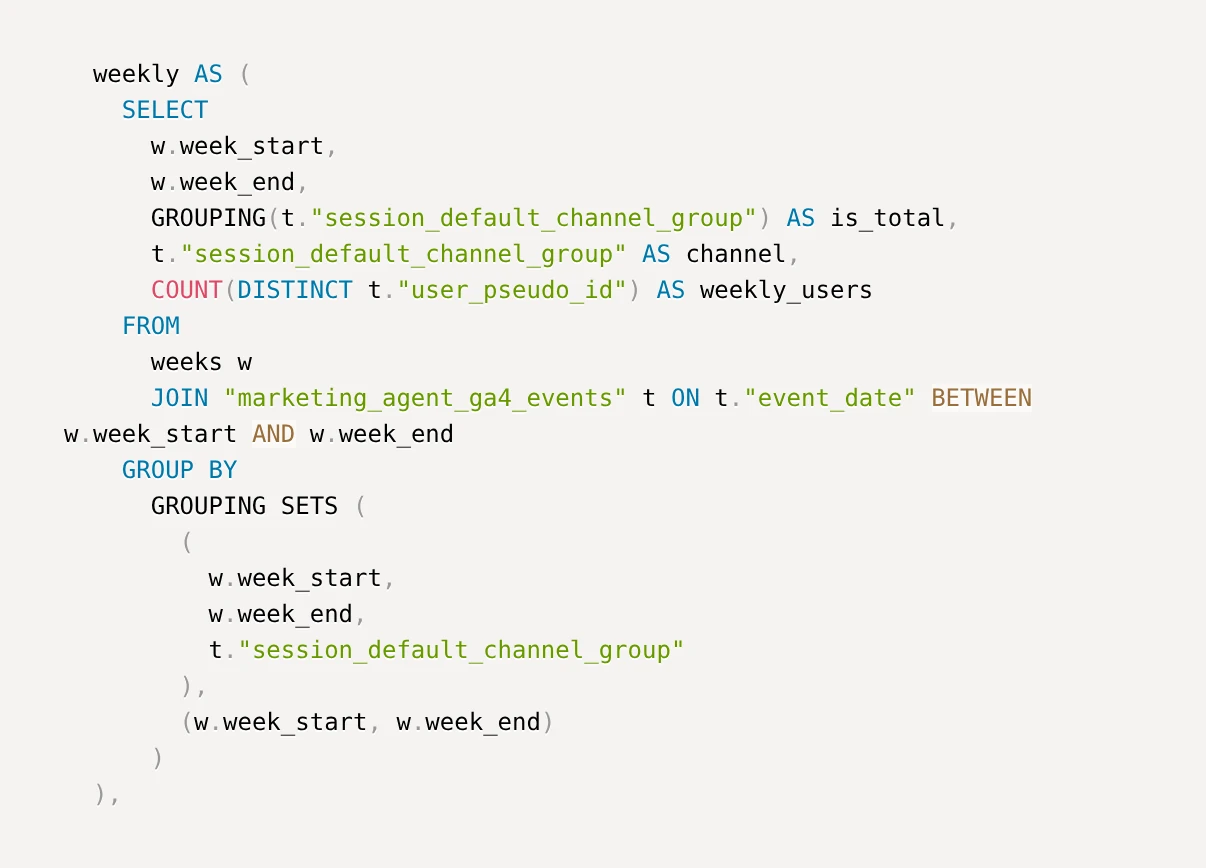
  **The weekly report correctly uses 3,815 users for 21–27 September and 4,603 users for 28 September–4 October.** Each is a distinct count of `user_pseudo_id` across the **entire week**, not a sum of daily distinct counts.
  […]
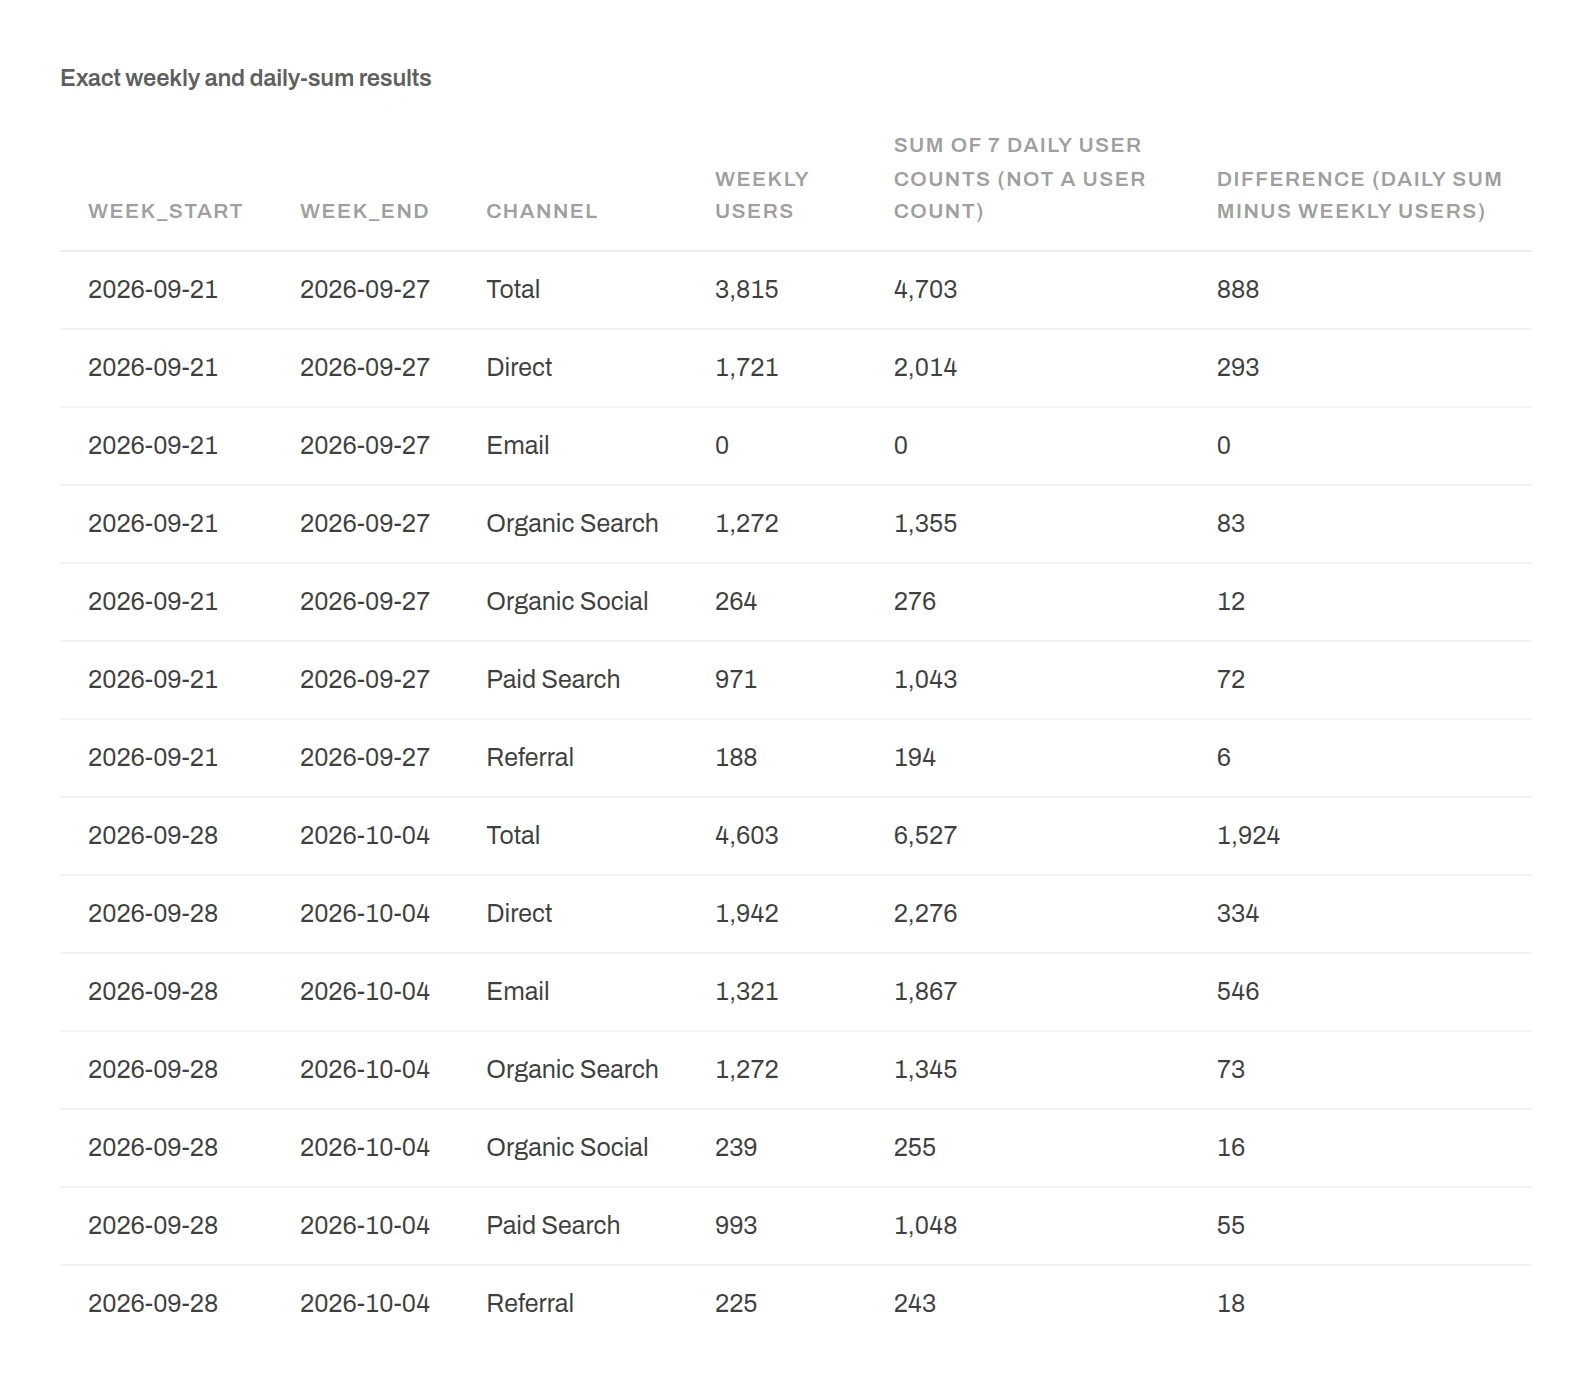
  **Use `weekly_users`.** A user who appears on three different days counts **once** in weekly users but **three times** in the sum of daily counts. The difference measures these repeat daily counts—not additional users.
The weekly step of the SQL, from the table’s View calculation panel: each user ID is counted once per week, and the Total is its own grouping set rather than a sum of channels. First-party Anomaly screenshot; synthetic sample data.
All 14 rows behind the number: weekly users beside the labelled sum of seven daily counts and the difference, for the Total and each channel. First-party Anomaly screenshot; synthetic sample data.
How it was checked: our script returns the same weekly users, daily sums and channel figures. Anomaly added a caveat worth keeping: these are browser or device IDs (user_pseudo_id), not necessarily unique people or GA4’s active users.
04Step 4: Turn the answer into a weekly report
A good Monday answer should not need re-asking, so we asked the agent for a dashboard built from the same definitions (for what belongs on one, see these marketing dashboard examples):
Prompt to Claude Code
Ask Anomaly to build a weekly marketing dashboard in this project from the same definitions: users (each person counted once per week), sessions, purchases and revenue by channel for all 8 weeks, plus Google Ads spend, conversions and cost per conversion by week. Send me the dashboard link.
Transcript excerpt · dashboard request
anomaly · ask_anomaly
  {"conversation_id": "da7df696-[…]",
   "question": "Please build a weekly marketing dashboard in this project, using exactly the same definitions as in this chat […] users (distinct user_pseudo_id per full week, each counted once per week […]) […] Please add a short note on the dashboard covering: […] Email has no activity before 28 Sep 2026; […]"}
→ Status: complete […]
  The eight weeks are complete, but my earlier Email note was too broad: Email activity also appears in August and mid-September. I’ll note that Email was absent in 21–27 September, rather than incorrectly saying it had no activity before 28 September.
  […]
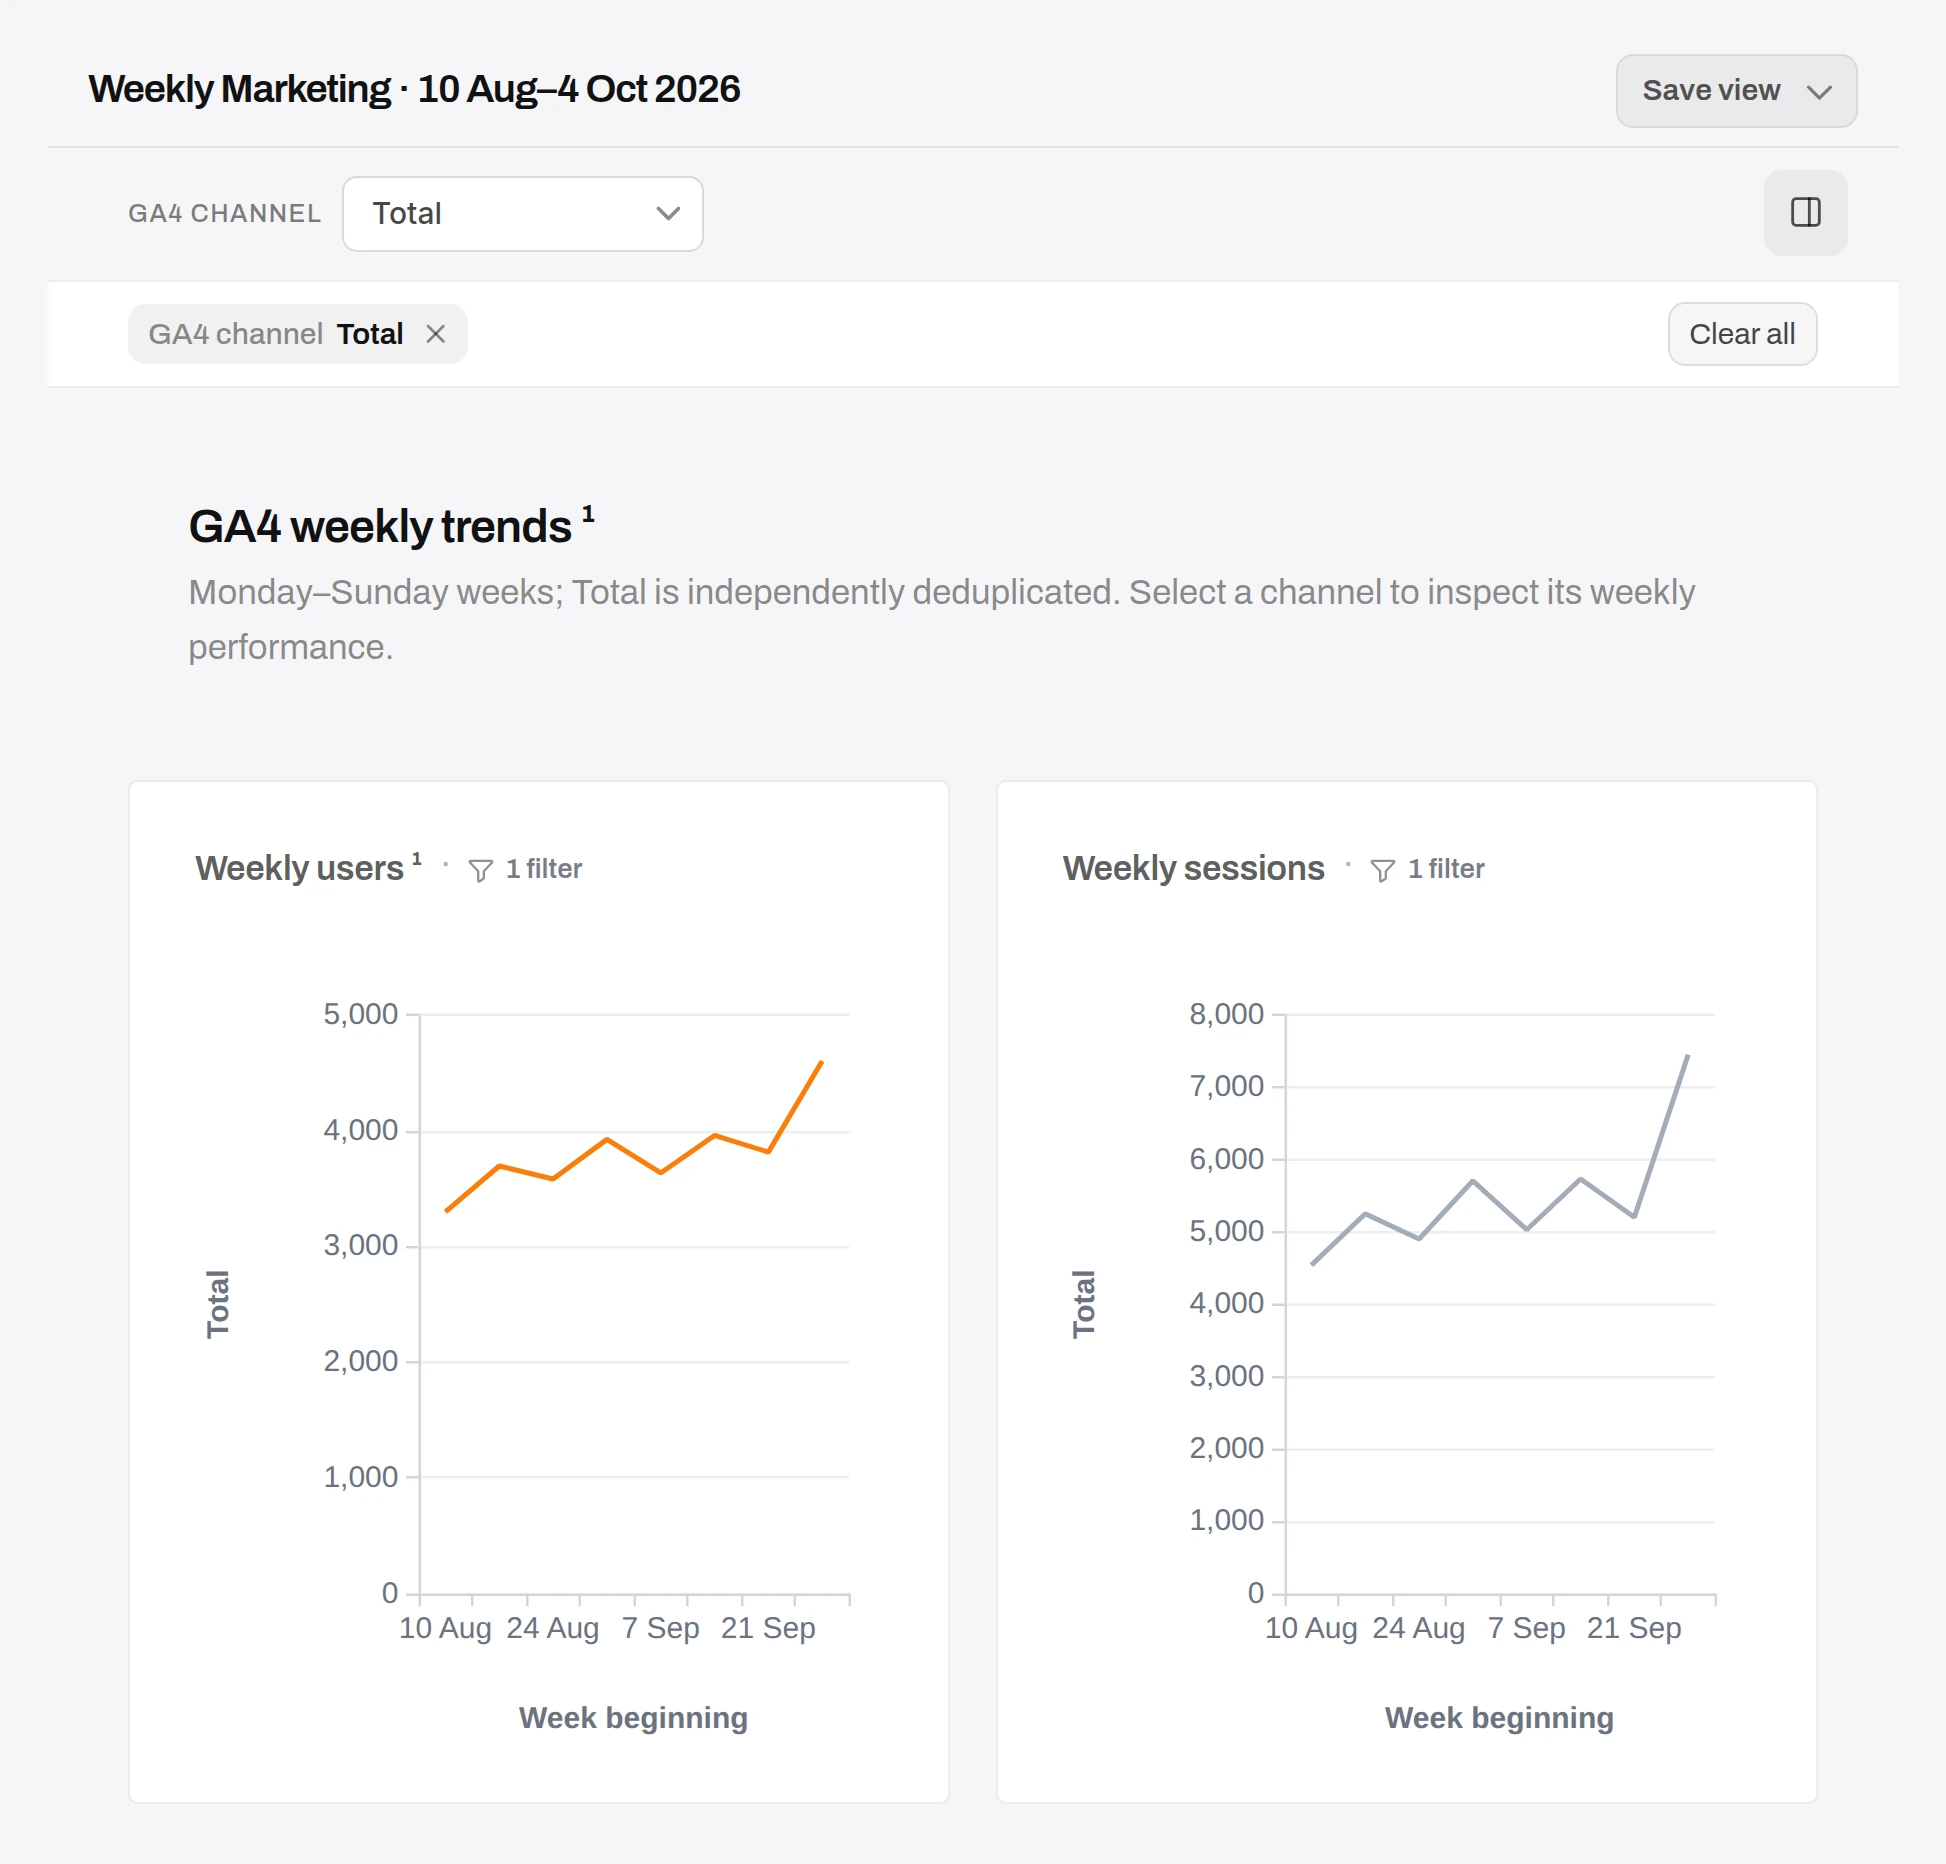
  - Dashboard: Weekly Marketing · 10 Aug–4 Oct 2026 […]

Claude Code:
  **A correction to my own wording:** in my request to Anomaly, I wrote that Email had no activity before 28 Sep. That was wrong. […] Anomaly caught this and the dashboard note now says it correctly.
That Email claim was the agent’s own, unprompted and wrong; Anomaly checked the rows and corrected it. Agents relay assumptions as confidently as facts, so keep the numbers where they are checked.
The dashboard built from the agent’s request, with the same definitions: weekly users and weekly sessions for all eight weeks. First-party Anomaly screenshot; synthetic sample data.
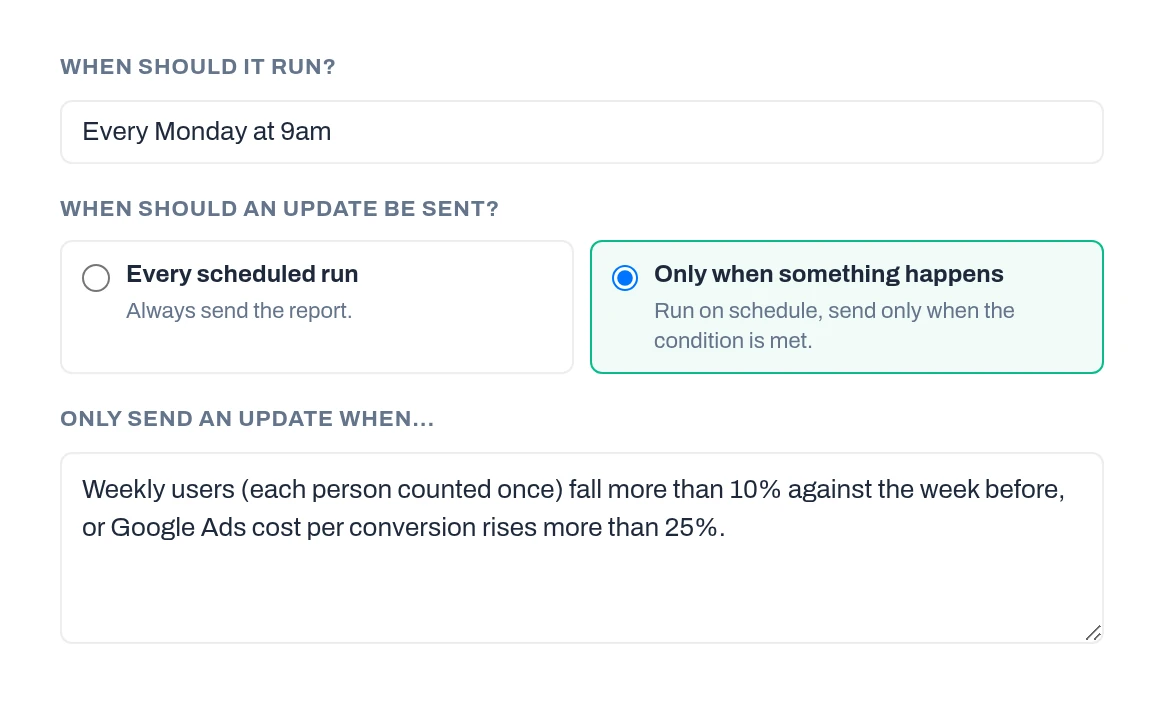
We then set a schedule in the Anomaly app and chose “Only when something happens”. That option is anomaly detection on a schedule: on every scheduled run, Anomaly checks for the change, threshold or exception you describe. It sends the report, by email or Slack, only when that condition is met. Before activating it, Anomaly asked whether to report the latest week or wait a week, because Sunday’s data may still be processing; we chose to wait. Schedules are on Pro and above. For the whole weekly setup, step by step, see the weekly marketing report tutorial.
Weekly schedule with a send-only-when condition. Connected sources refresh before each run; an uploaded file stays a snapshot. First-party Anomaly screenshot; synthetic sample data.
The definitions trap: daily users don’t add up to weekly users
A user count de-duplicates people (strictly, browser or device IDs). Someone who visits on three days of a week is one user for the week but appears in three daily counts. GA4 defines total users as the unique users who triggered any event in the date range (Google Analytics Help).
21–27 Sep
28 Sep–4 Oct
Change
Users, once
3,815
4,603
+20.7%
Daily sum*
4,703
6,527
+38.8%
Overstated
+23.3%
+41.8%
* The seven daily user counts for the week, added up. It is not a user count.
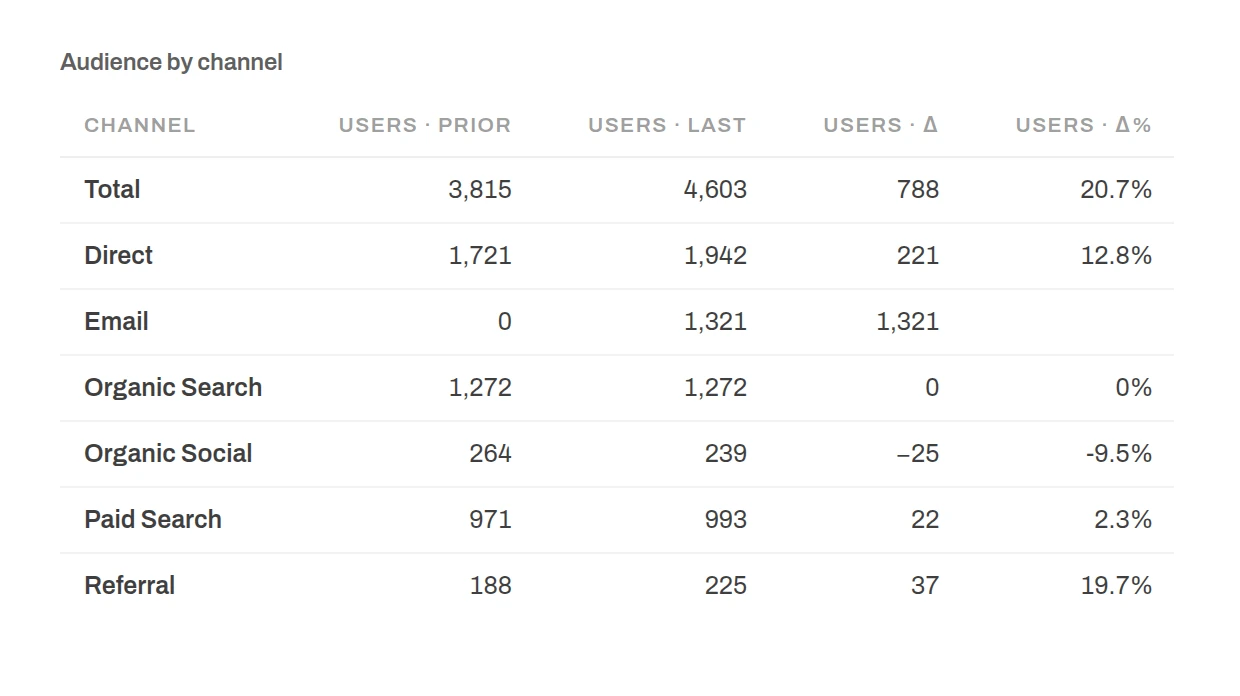
In the week of 28 September, 1,381 people visited on two or more days. Two newsletter sends brought readers back on extra days, so the summed figure jumped further than the real one. Channels work the same way: the six channel user counts for that week add up to 5,992, but only 4,603 people visited.
User counts by channel overlap: last week’s six channel counts add up to 5,992, but the Total counts each person once. First-party Anomaly screenshot; synthetic sample data.
People make this mistake too: one GA4 user on Stack Overflow added up a month of daily active users, got about 89k instead of GA4’s 71k and trusted the sum. For connected GA4 data (see how to analyze GA4 data in Anomaly), Anomaly’s product docs say unique users come from exact date windows. Sampled results are split until exact or marked as estimated (product docs, not shown in this run).
Google Ads and GA4 disagree, and both can be right
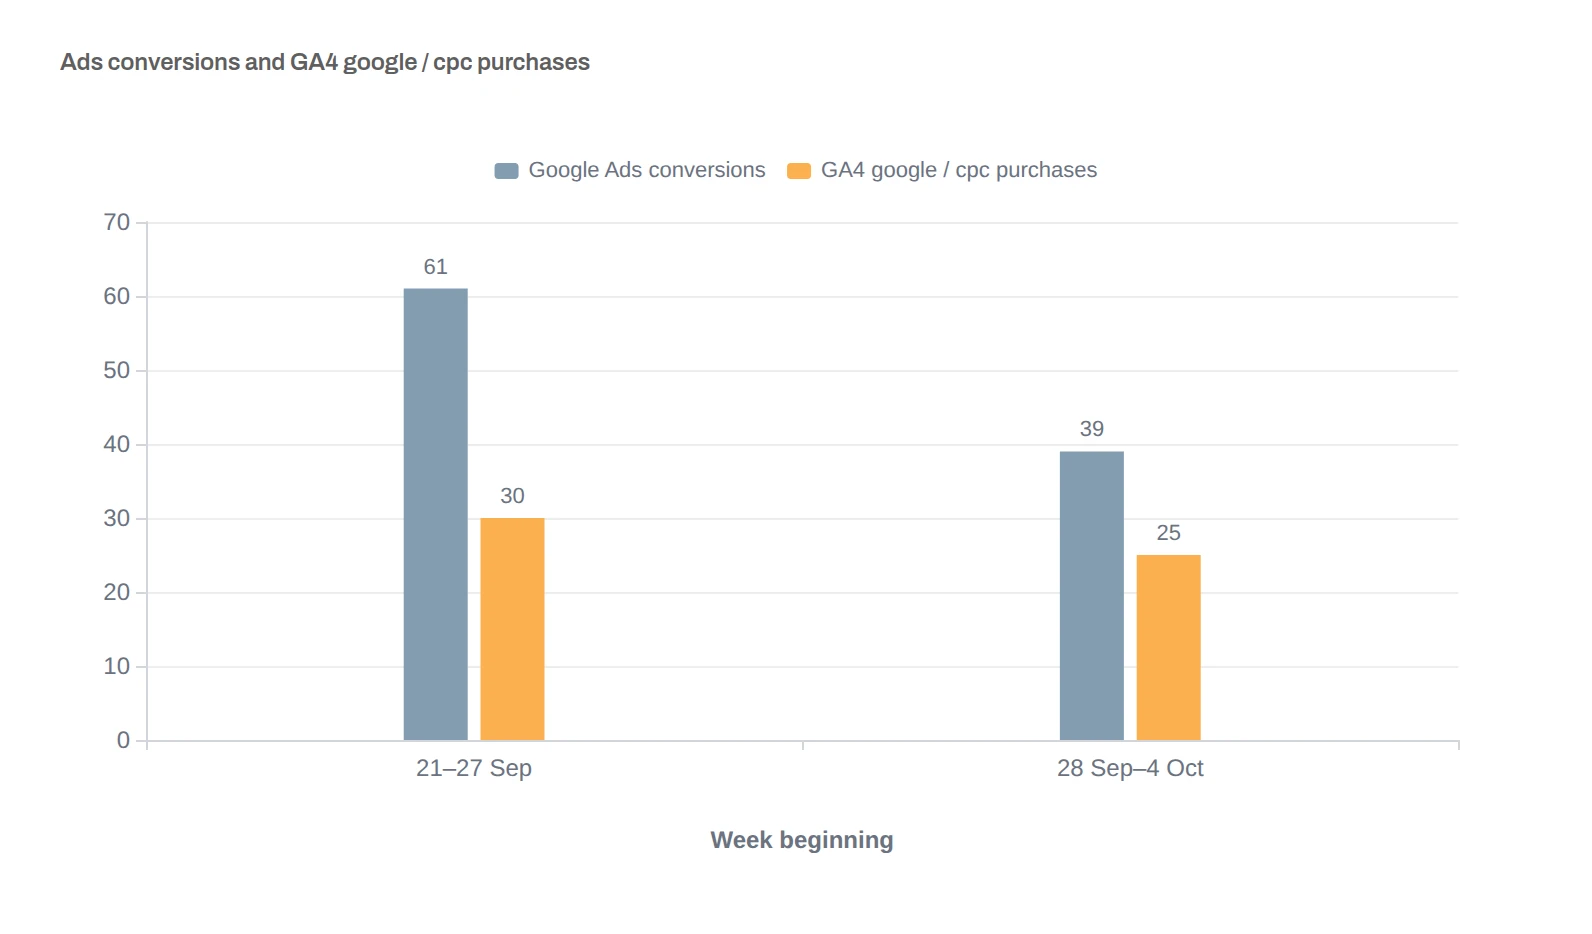
For the week of 21 September, Google Ads reports 61 conversions; GA4 records 30 purchases in google / cpc visits. Google Ads dates a conversion by the ad click, GA4 by the purchase (Google Ads Help). The sample’s Ads report credits each purchase to the buyer’s most recent google / cpc visit on or before the purchase day (within 30 days), dated by that visit. By that rule, 30 of the 61 were bought in a google / cpc visit that week: GA4’s 30. The other 31 were bought in a later Direct (15), Email (12) or Organic Search (4) visit, which GA4 credits instead; 23 of them came the following week.
We built the sample so the two sources disagree: for 21–27 Sep, Google Ads reports about twice as many conversions as GA4 records in google / cpc visits. First-party Anomaly screenshot; synthetic sample data.
So the weekly story depends on the source. Google Ads cost per conversion rises from $36.80 to $56.76 (+54%), partly because the latest week’s clicks have had less time to convert. Cost per GA4 google / cpc purchase moves from $74.82 to $88.54 (+18%). Report both, label the source, and judge a week only after its conversions settle.
Start read-only, then decide what an agent may change
An agent that only reads is low-risk: the worst outcome is a wrong number, and you can check it. An agent that changes bids, budgets or campaigns needs a named owner, limits on what it may change, sign-off above a set amount and a log of every action. Grant write access only after its numbers have held up for several weeks, and have someone sign off every change to spend.
What to check before an agent’s number reaches a report
Name the date range, time zone and week start (Monday to Sunday in this sample).
Count users once per period; never add daily or channel user counts together.
Ask for the SQL behind every number that reaches a decision.
Open the rows and spot-check a few against the source.
Keep Google Ads conversions and GA4 purchases in separate, labelled columns.
Let conversions settle before judging the latest week. Recent weeks can show fewer conversions and a higher cost per conversion, because some people who clicked have not converted yet (Google Ads Help).
Reuse one saved definition for every weekly run.
Start read-only and keep a log of what the agent asked and changed.
They fetch data from connected sources, run the analysis and return an answer, chart, dashboard or report. Common jobs are weekly performance checks, channel comparisons and reconciling Google Ads with GA4. Check the definitions, SQL and rows behind each number.
How can agentic AI be used in marketing?
In two ways: analytics agents that read data and answer questions, and content or campaign agents that write copy or change budgets. Start with analytics: a read-only agent cannot spend money, and every number it returns can be checked.
Can an AI agent change my Google Ads campaigns?
Only if its connection allows it. Google’s official Google Ads MCP server is read-only in its current release, and Anomaly reads your data without changing campaigns. An agent with write access needs spending limits, human sign-off and a log.
What data can an agent reach through Anomaly?
Only the projects your Anomaly account can open. A project can hold Excel or CSV uploads up to 1 GB, Google Ads and Search Console data, and ad data from Meta (including Instagram) and TikTok. Connected sources also include GA4, Shopify, HubSpot, Google Sheets, BigQuery, MySQL and Snowflake. Each question runs as a normal Anomaly chat.
Can I trust an AI agent’s marketing numbers?
Trust the ones you can check: ask for the SQL and rows, compare one figure with the source, and make sure users are counted once per period. In our run, Anomaly counted each person once per week and showed the query and rows.
What does an AI agent for marketing analytics cost?
Through Anomaly, MCP is on Pro and above: $25 a month, or $20 a month billed yearly, with 1,000 credits a month. Each question uses credits, about 3 per message on average, and there is no separate MCP fee. Your AI assistant may have its own plan cost.
Ready to Try AI Data Analysis?
Experience AI-driven data analysis with your own spreadsheets and datasets. Generate insights and dashboards in minutes with our AI data analyst.
Founder, Anomaly AI (ex-CTO & Head of Engineering)
Abhinav Pandey is the founder of Anomaly AI, an AI data analysis platform built for large, messy datasets. Before Anomaly, he led engineering teams as CTO and Head of Engineering.