Sales Dashboard: Track Revenue vs Target by Region and Rep
Turn sales records and a separate target spreadsheet into a comparison you can trust, from the team total to the region and rep behind the gap.
Anubhav··14 min read
Imagine preparing a monthly sales review. The team has beaten its target, but one region has fallen short. You need to explain both results—and decide what to check before asking a sales representative why they missed their number.
We will follow a fictional team of eight sales representatives, or reps, with two in each region: North, South, East and West. In September 2026, the team recorded $190,850 in net sales against a $180,000 goal. North finished $737.50 below its own goal. Both statements are true; the total alone does not tell you where attention is needed.
Here, net sales means recorded sales minus credits—amounts that reduce earlier sales. We use that as this example’s revenue measure, excluding tax. All amounts are in US dollars (USD). The data is synthetic, not a customer success story; use your business’s agreed revenue definition for your own report.
Follow the numbers from their sources to the manager’s next action. You do not need downloads, prompts or Anomaly to understand the guide. Files and a practice prompt are optional extras near the end.
01What should a sales performance dashboard show?
A sales manager dashboard for the monthly review should answer three questions:
Did the named sales team reach its target for the selected month?
Which regions and reps are above or below their matching targets?
Which source records should we inspect before explaining a gap?
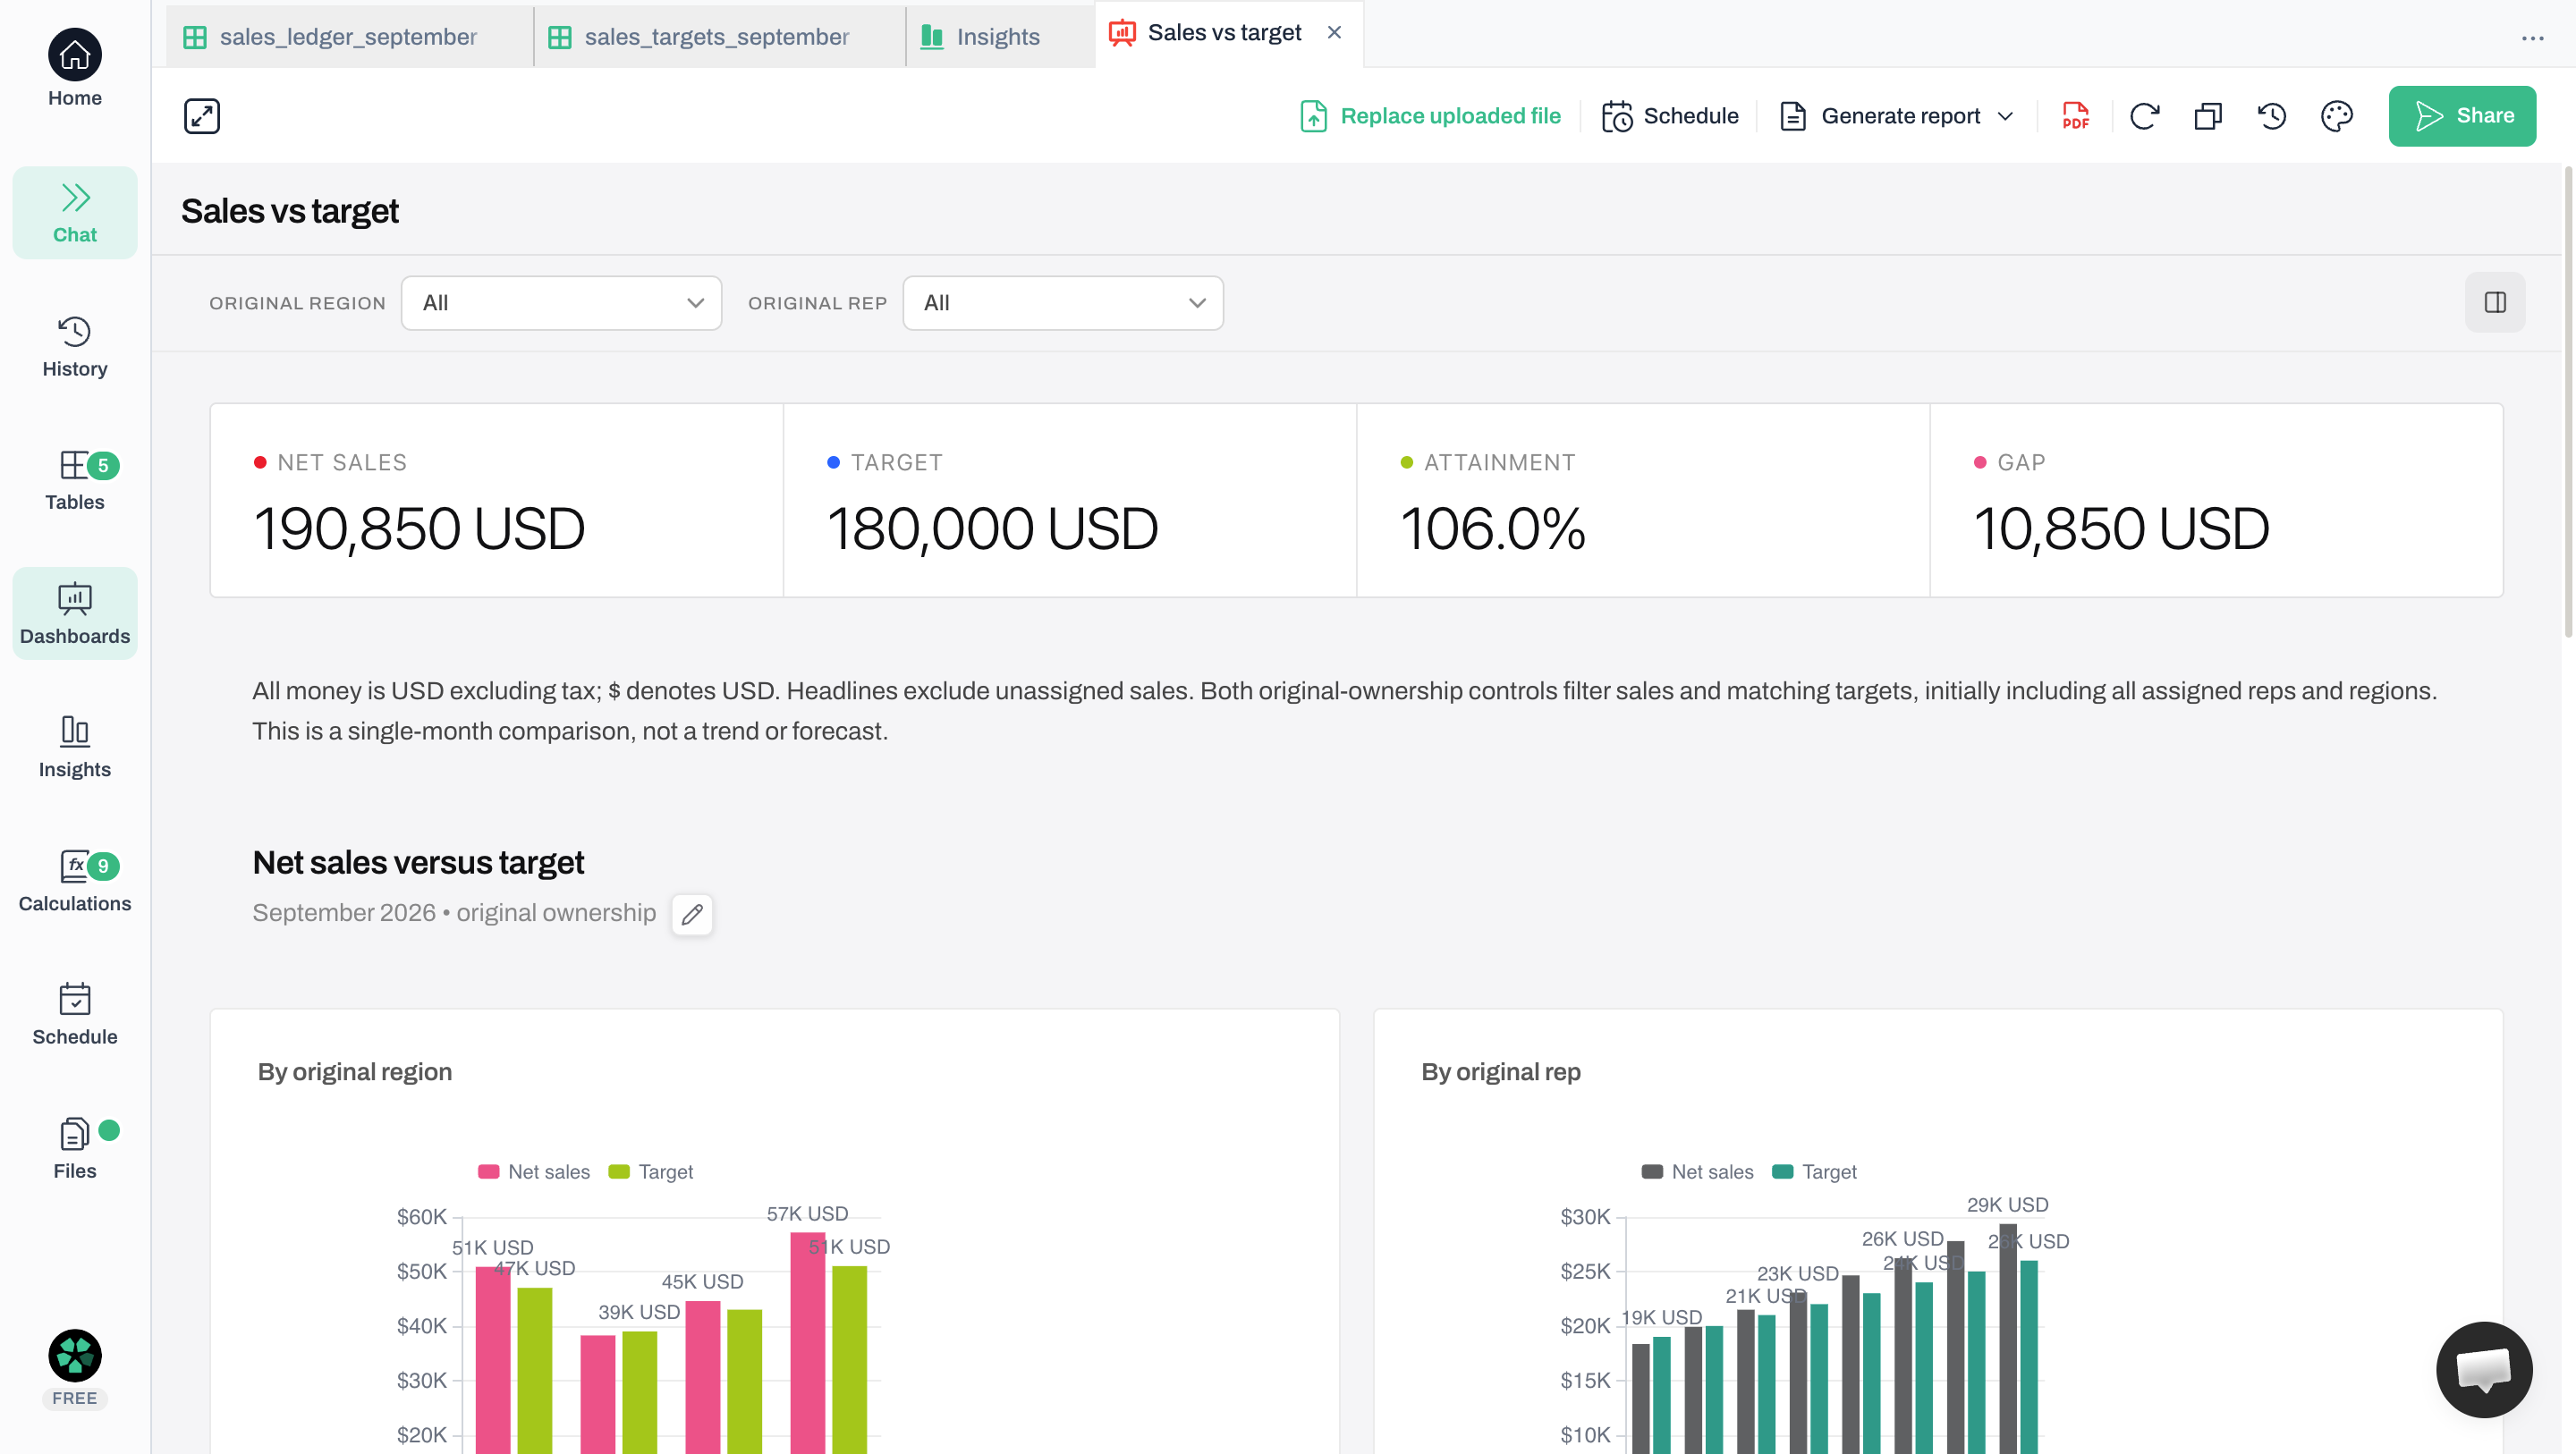
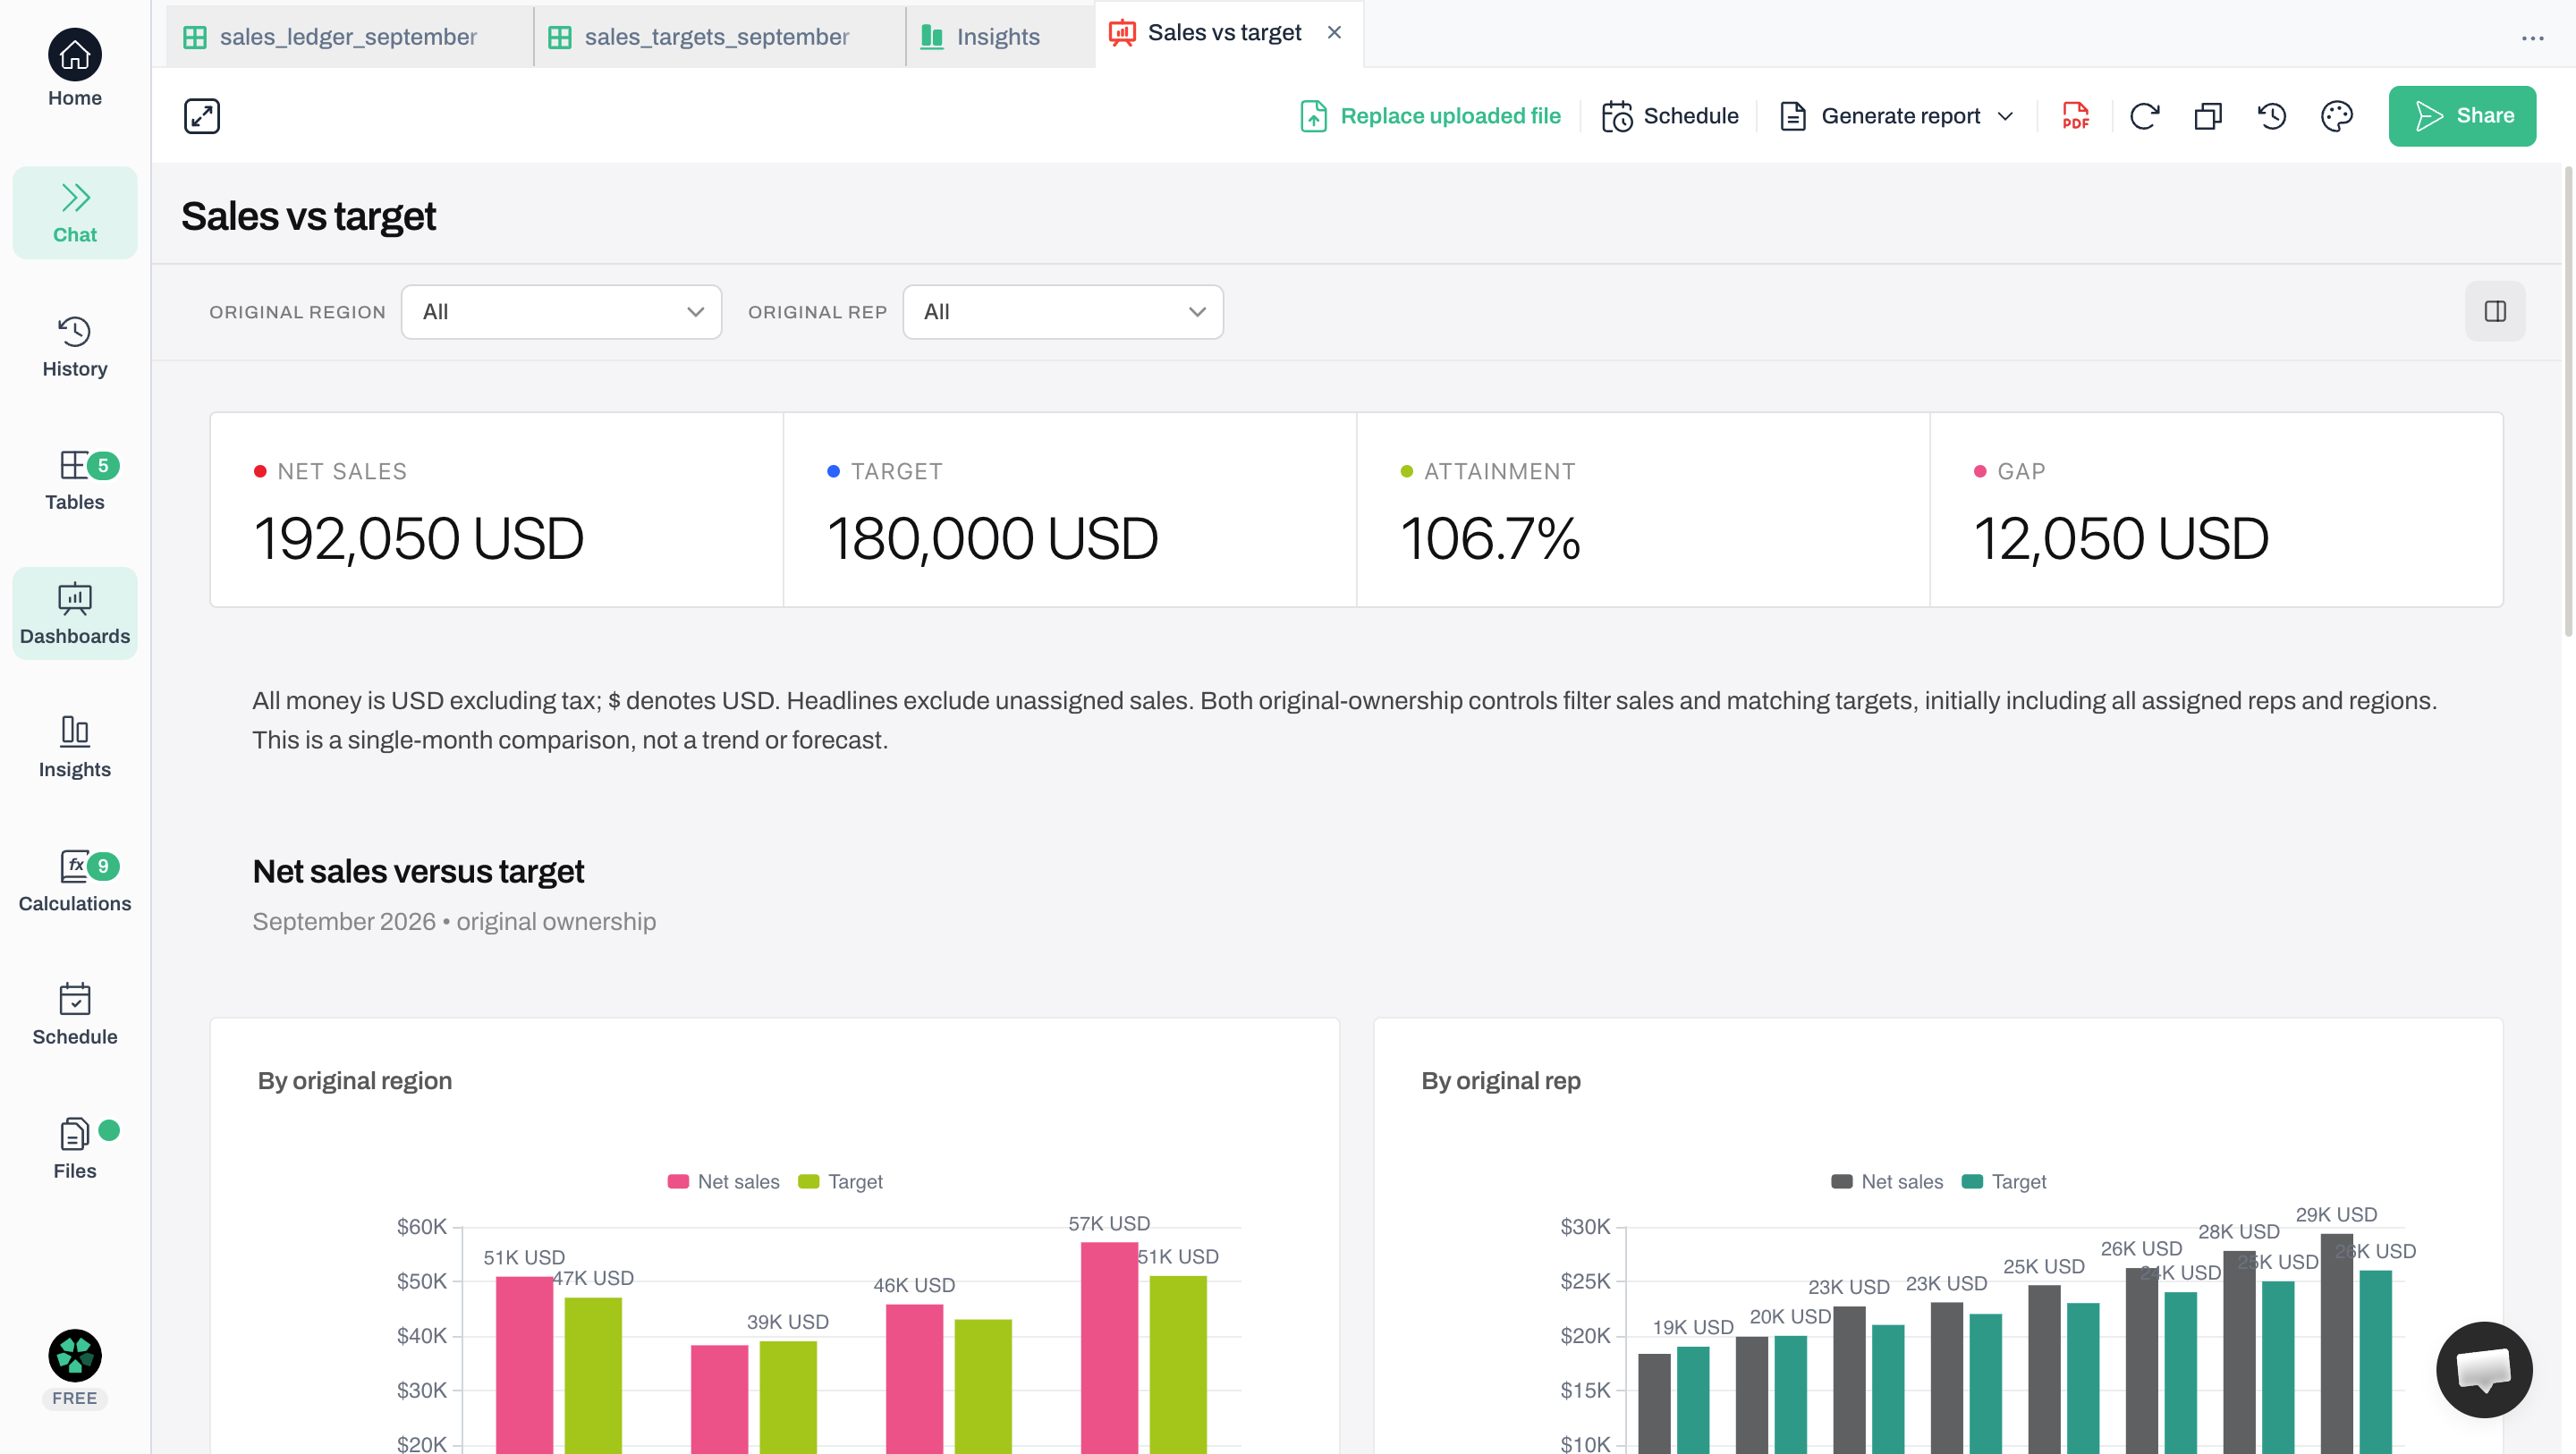
Read the four cards first: the team sold $10,850 more than its goal. Then scroll to the paired bars and find North, where sales fall below target. Keep the reporting period, currency and sales definition visible so someone opening the report can follow the same comparison.
This sales team performance dashboard, built in Anomaly AI, uses September-only copies of the example’s sales records and targets. We checked the results independently and tested its region and individual-rep filters. The next views show how to narrow the investigation.
Start with the team’s result, then look for the shortfall
Anomaly dashboard using synthetic data. All eight reps are selected; the $1,500 unassigned sale stays outside the headline. The cards show USD and round some values; the worked figures below keep cents and two decimal places. Click to enlarge.
Compare each region and rep with their own target
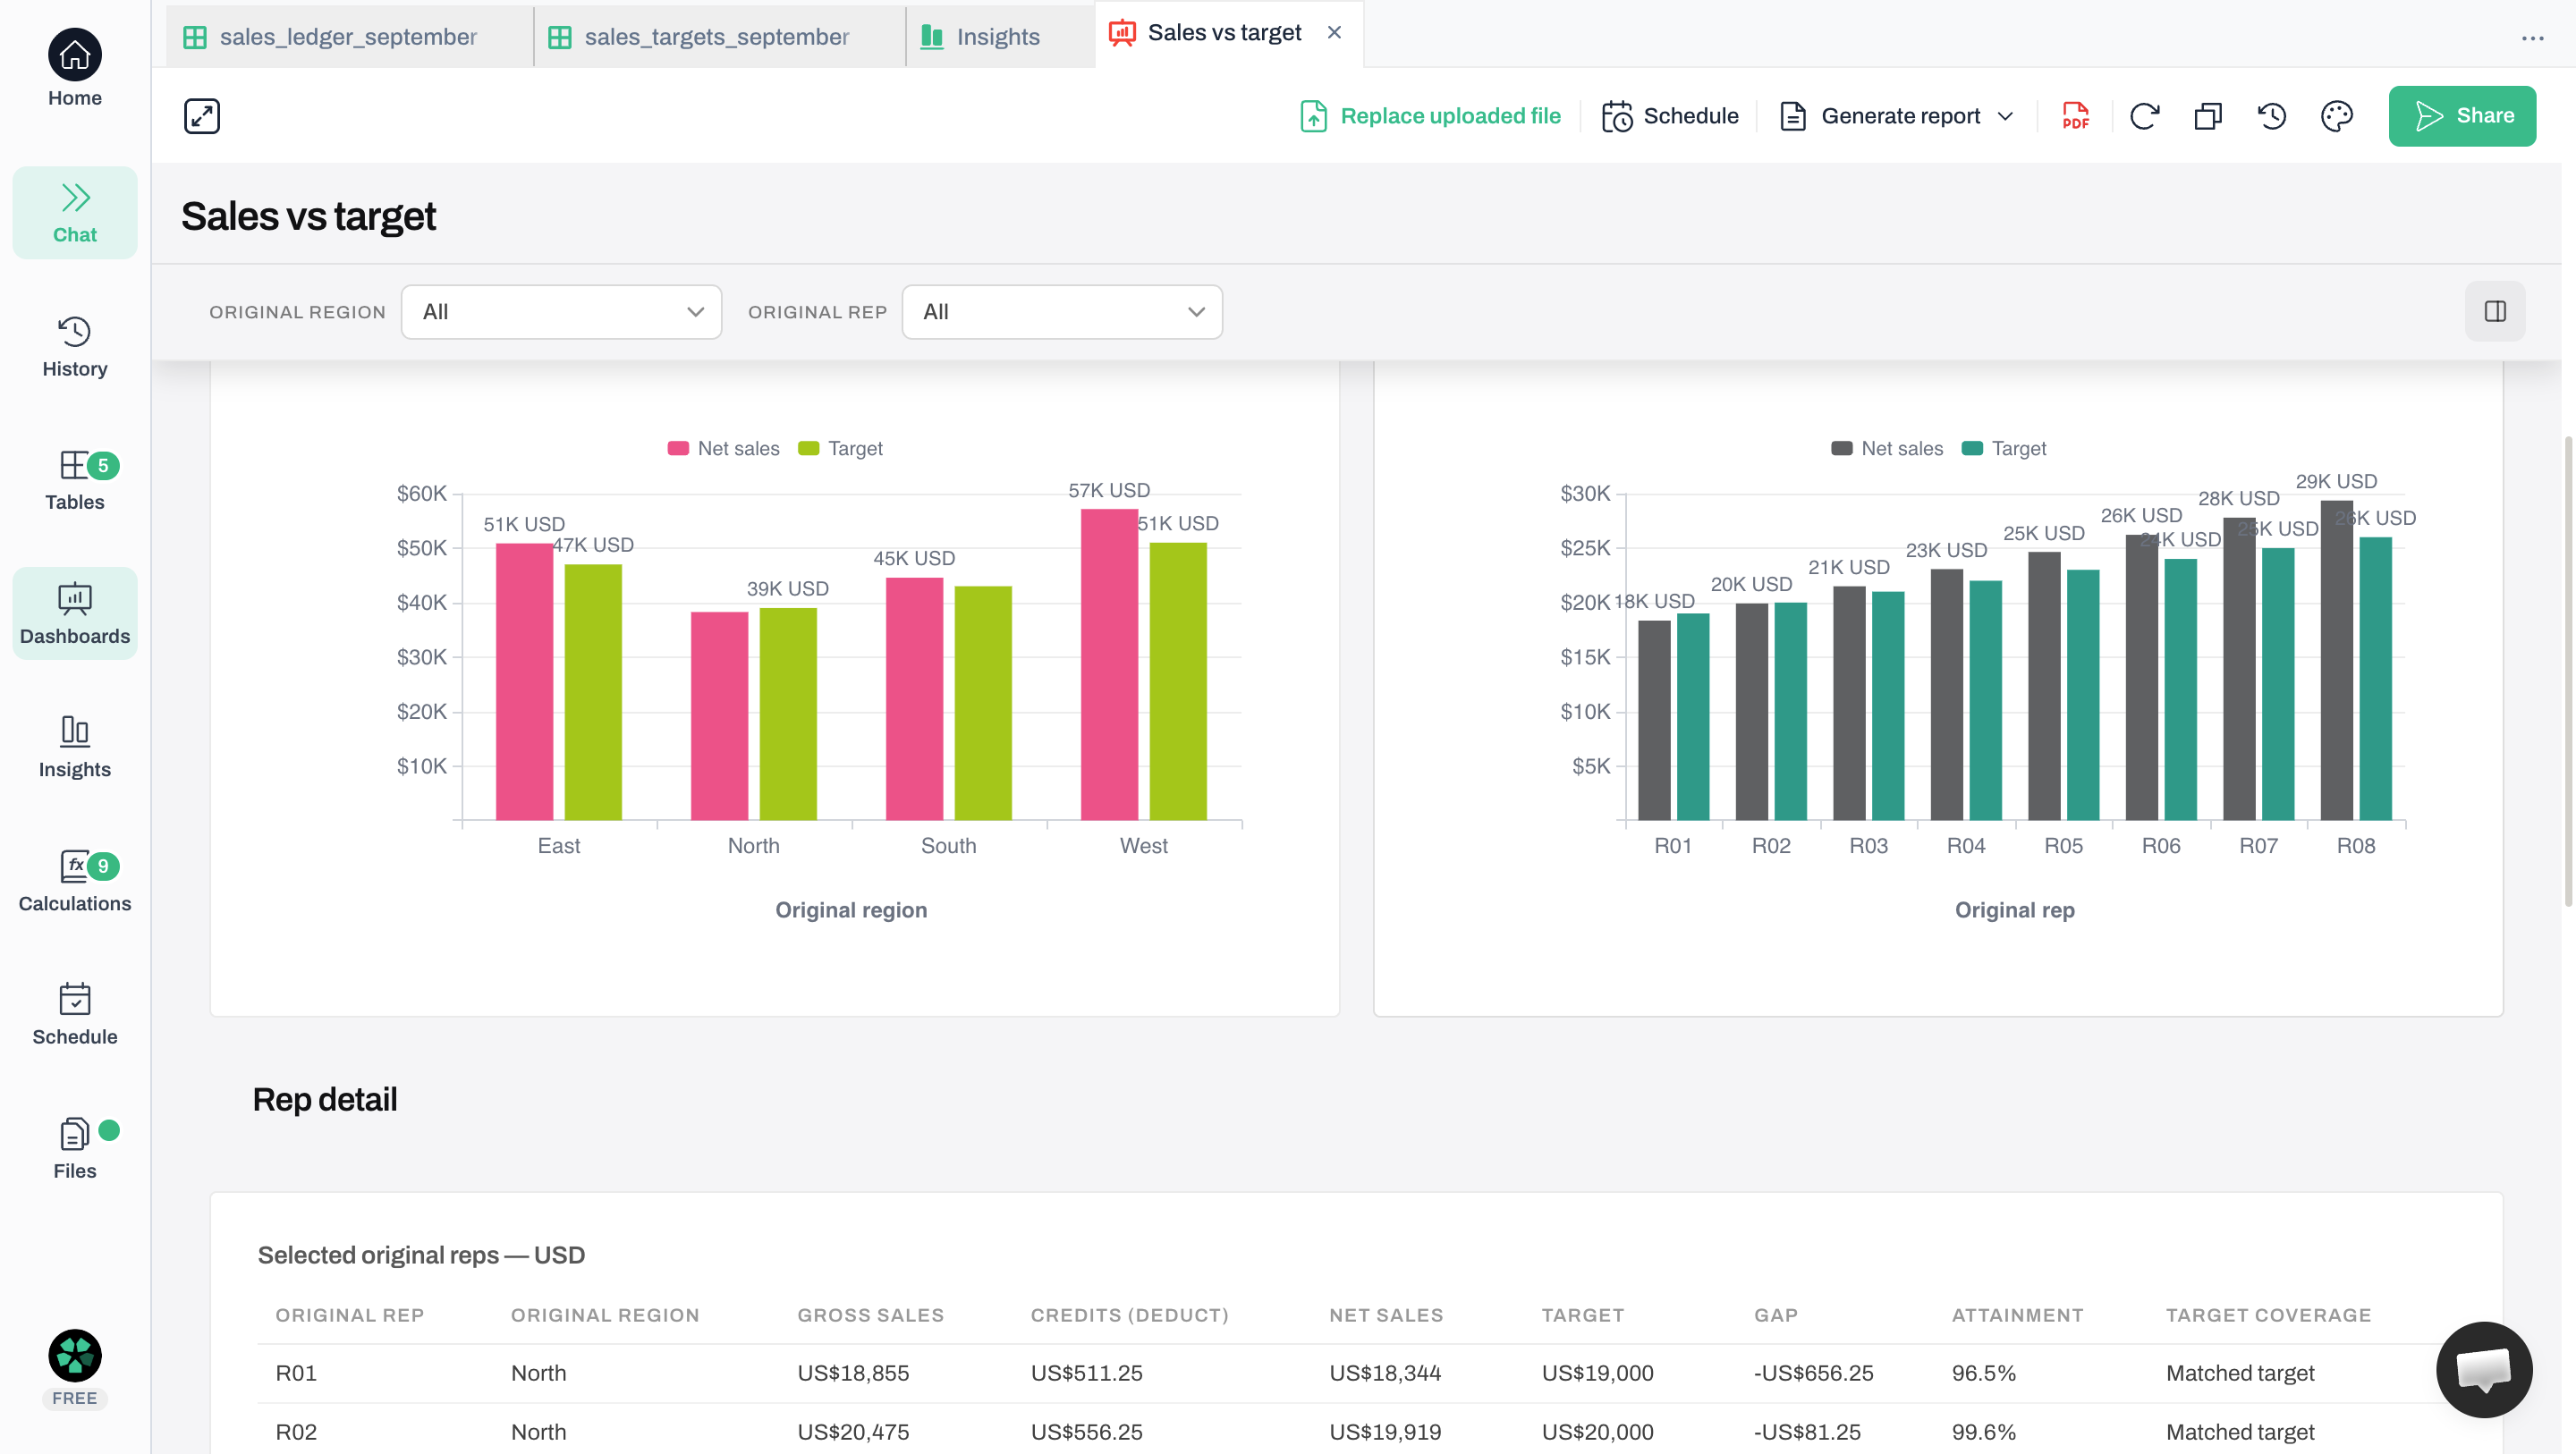
The same dashboard, scrolled to its comparisons. Both controls remain on All. Each pair of bars uses the same group’s sales and target; rounded labels help scanning, while the table supplies detail. Click to enlarge.
The regional bars point us toward North. Before selecting it, check how sales and targets were combined: a repeated or mismatched target would send the investigation in the wrong direction.
02Check the sales records and count each target once
The sales ledger lists sales and credits with their dates, amounts, reps and regions. A separate sheet gives each rep one monthly target. The full downloads cover October 2025 through 12 October 2026; this review and the product screenshots use only September 2026.
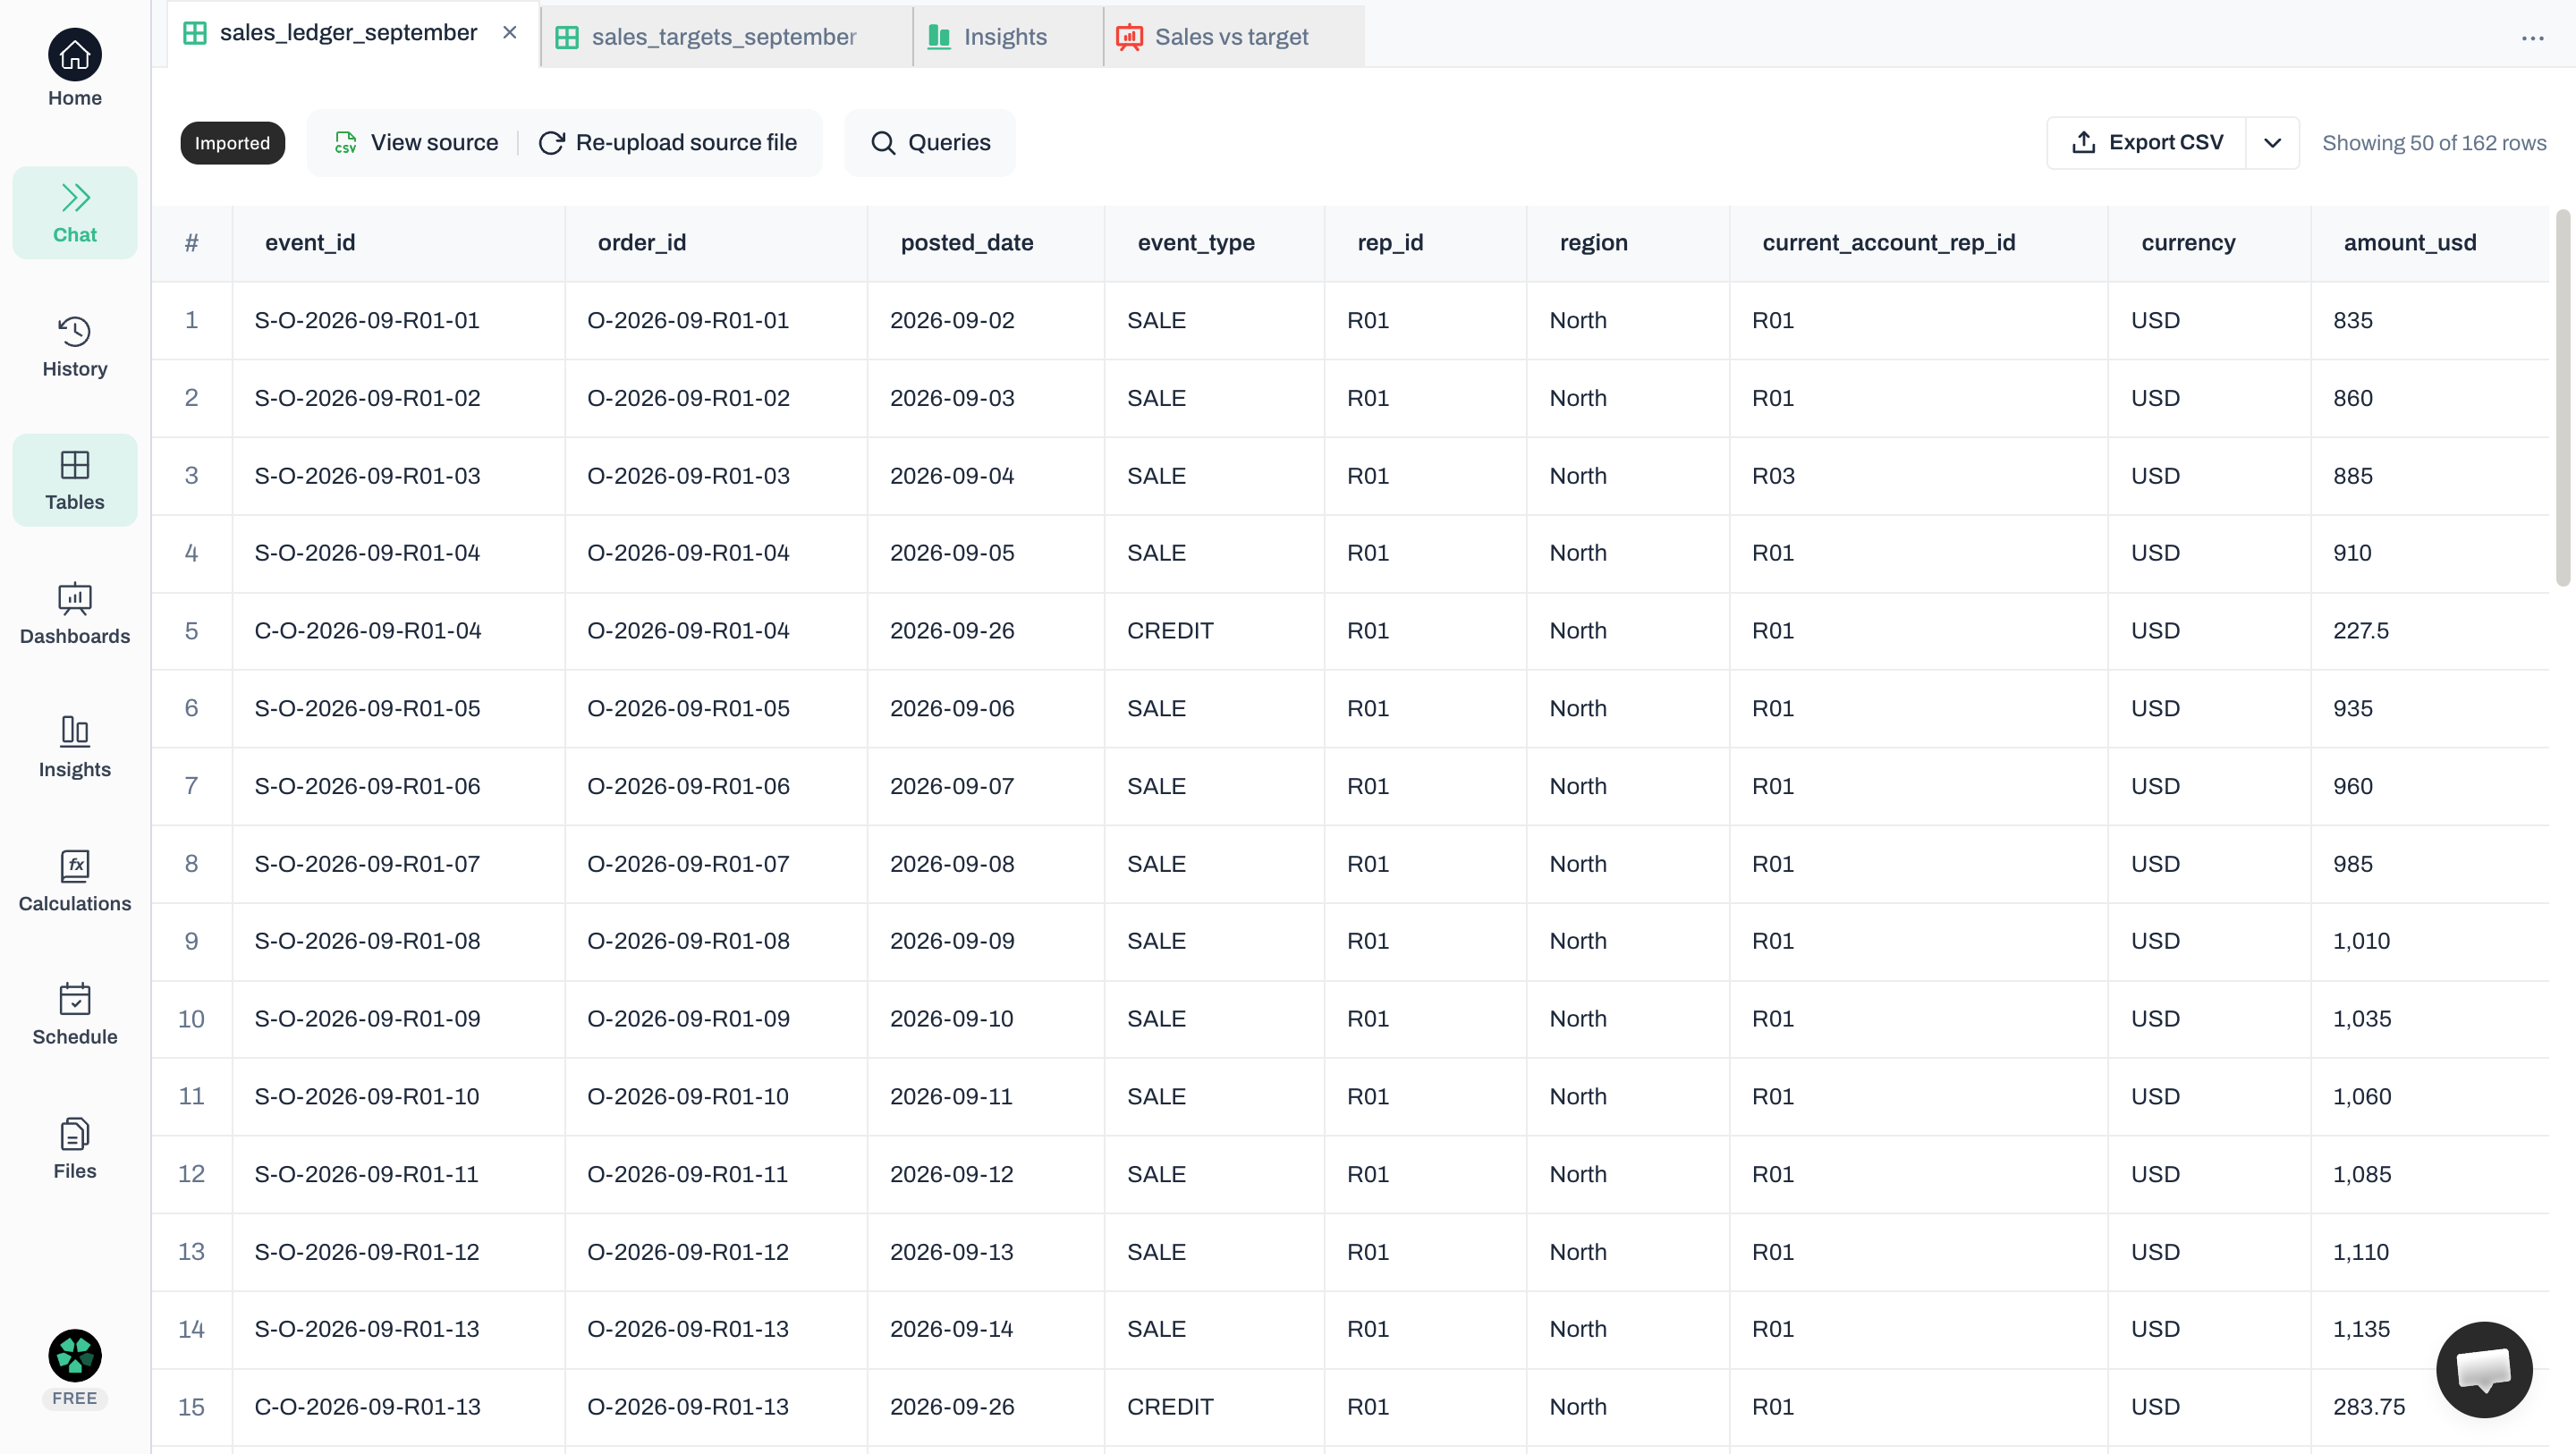
Open the sales source in Anomaly to see what each row contains. Look for the recorded date, whether the entry is a sale or credit, its original rep and region, and the amount. The separate targets source appears in the next tab.
Check the records behind your dashboard
Rows 4 and 5 are the sale and credit explained below. Synthetic data. Click to enlarge.
R01 identifies one fictional North-region rep. These are two of that rep’s records, not the entire month.
Selected September 2026 ledger entries · R01 · North · USD excluding tax
Recorded date
Entry
Amount
Effect on sales
5 September
Sale for one order
$910
Add $910
26 September
Credit against that order
$227.50
Subtract $227.50
This order contributes $682.50: $910 − $227.50. R01’s $19,000 target is for the whole of September, not this order. Compare it with the rep’s full monthly sales after credits.
Agree what a sale means
Both SALE and CREDIT rows store positive amounts; their labels tell us to add or subtract. The posting date—when the entry was recorded—decides the month. Use the original sale’s rep and region, not the customer’s current account manager. Also check that the target measures the same event: an order goal and invoiced sales are not automatically comparable.
Check duplicates and missing ownership
Count the ledger’s one identical repeated entry once. Conflicting amounts under the same ID need investigation, not an arbitrary choice; see our duplicate-checking guide. Keep the $1,500 sale without an assigned rep separate. The $190,850 headline covers the eight named reps, not all-company revenue.
Add up sales before attaching targets
Add up each rep’s sales after credits for the month, then match that total to one target:
Many sales and credit rows
Add them up to one net-sales row per rep and month.
→
One matching monthly target
Match both rep and month. Count the target once.
Attaching the target to every sales row inflates this sample’s $180,000 goal to $3,600,000. Nothing changed in the target sheet: the calculation counted it repeatedly. Microsoft’s data-model guidance explains why monthly targets and individual sales need different treatment.
03Sales dashboard metrics: revenue, target and attainment
Now check the four cards against their calculations. These four key performance indicators (KPIs) are the core of a sales KPI dashboard. They use September’s posting dates and the eight named reps:
September 2026 · named sales team · USD excluding tax
Metric
Calculation
Worked result
Net sales What remains after credits
Posted sales − posted credits
$196,200 − $5,350 = $190,850
Matching target The same team’s agreed goal
Sum each selected rep’s target once for the same month
$180,000
Target attainment How much of the goal was achieved
Net sales ÷ matching target × 100
$190,850 ÷ $180,000 × 100 = 106.03%
Gap to target The dollar surplus or shortfall
Net sales − matching target
$190,850 − $180,000 = +$10,850
For every $100 of target, the team recorded about $106.03 in net sales. It exceeded the goal by $10,850—not by 106.03%. Attainment of 100% means meeting the goal; below that means a shortfall. Keep full precision in calculations and round only the display.
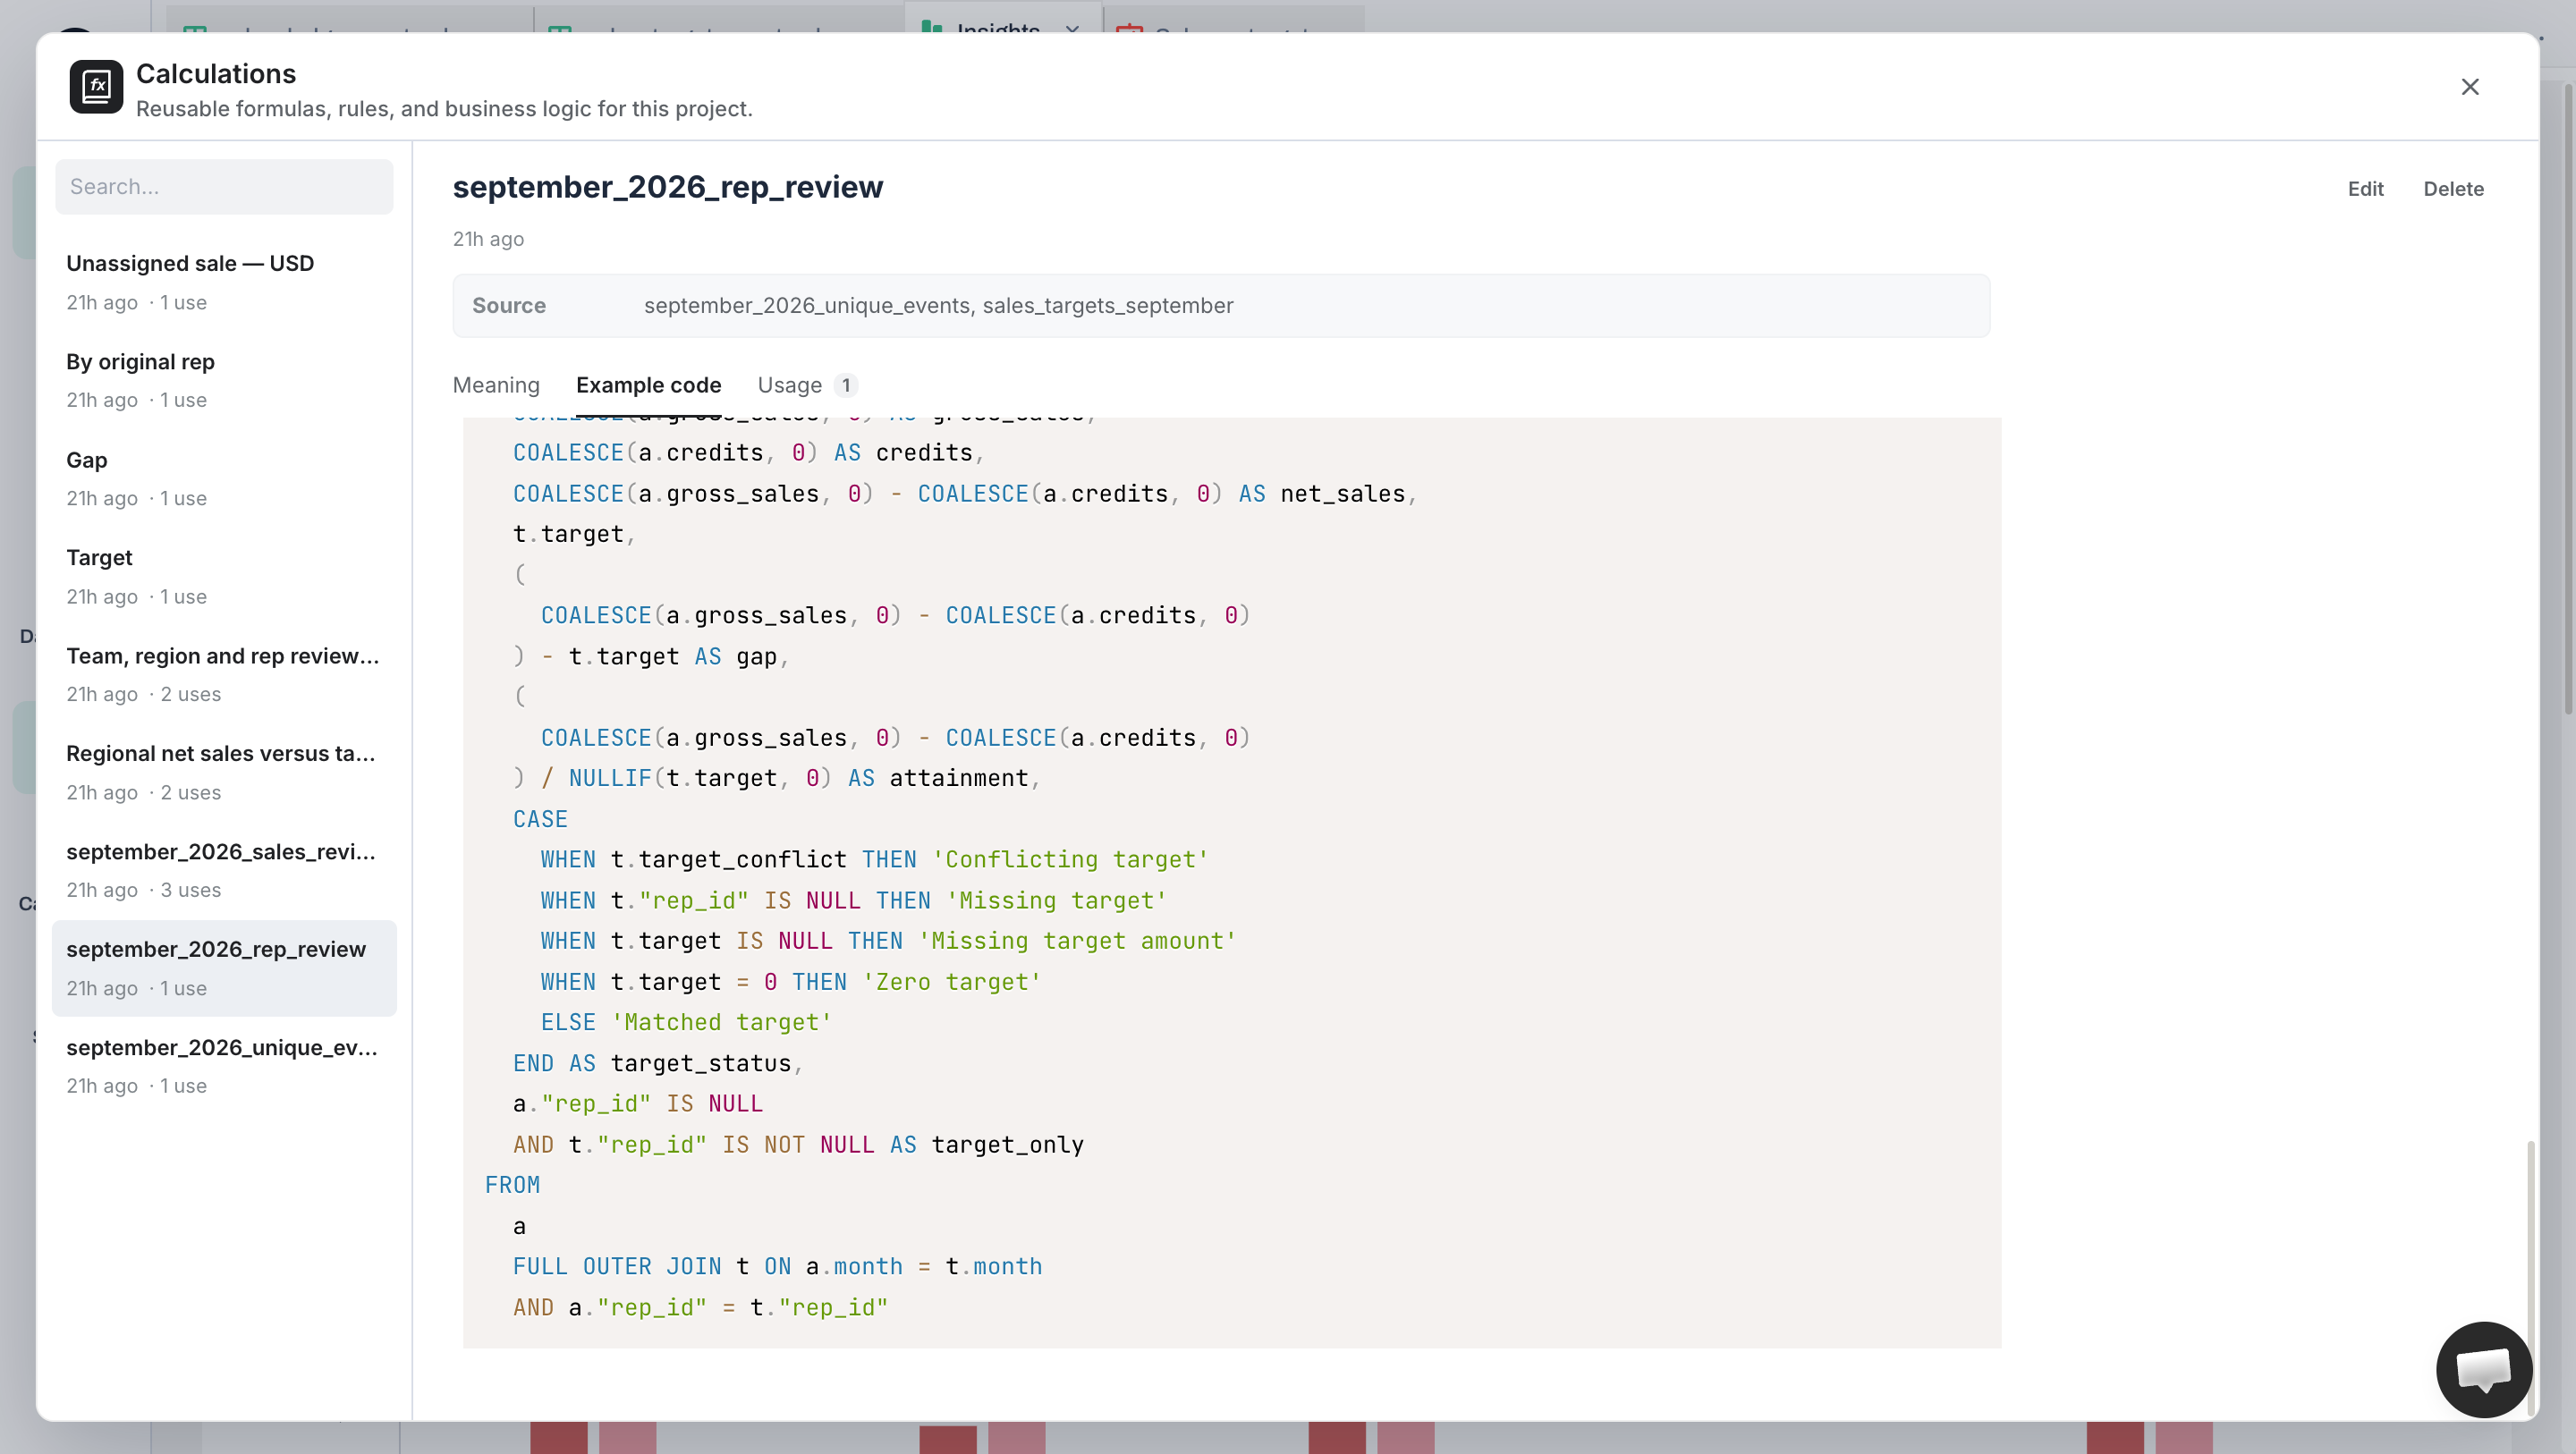
If an analyst needs to inspect the working, Anomaly’s Calculations panel also exposes saved example code. The view below shows sales minus credits, the target subtraction and the division used for attainment. You do not need to read SQL—the language used for these calculations—to follow the worked table above.
Inspect the saved calculation behind the metrics
The saved example code shows how the measures are defined; it is not a fresh calculation result. An analyst should also check where that code is used and compare the output with the source totals. Click to enlarge.
Read the dollar gap and percentage together; neither measures profit because these files contain no costs. A missing target is unknown, while a recorded zero makes attainment undefined. Flag either case instead of inventing a percentage. Our budget-versus-actual guide explains the related calculation.
04Sales dashboard example: find the region below target
Return to the regional bars with the totals checked. North is below target, while the other regions are above it. The table gives the exact amounts without needing to enlarge a screenshot.
Paired bars make the target easy to see when both use the same currency scale and clear labels. For a multi-month review, a line chart can show the trend, with partial months labelled. This September-only dashboard does not demonstrate a trend or forecast.
Sales dashboard example: September results by original region
Region
Net sales
Target
Gap
Attainment
North
$38,262.50
$39,000
−$737.50
98.11%
South
$44,562.50
$43,000
+$1,562.50
103.63%
East
$50,862.50
$47,000
+$3,862.50
108.22%
West
$57,162.50
$51,000
+$6,162.50
112.08%
South, East and West exceed their targets by $11,587.50 combined. That offsets North’s $737.50 shortfall and leaves the team $10,850 ahead. Now narrow the view to North.
Select North, then inspect one rep
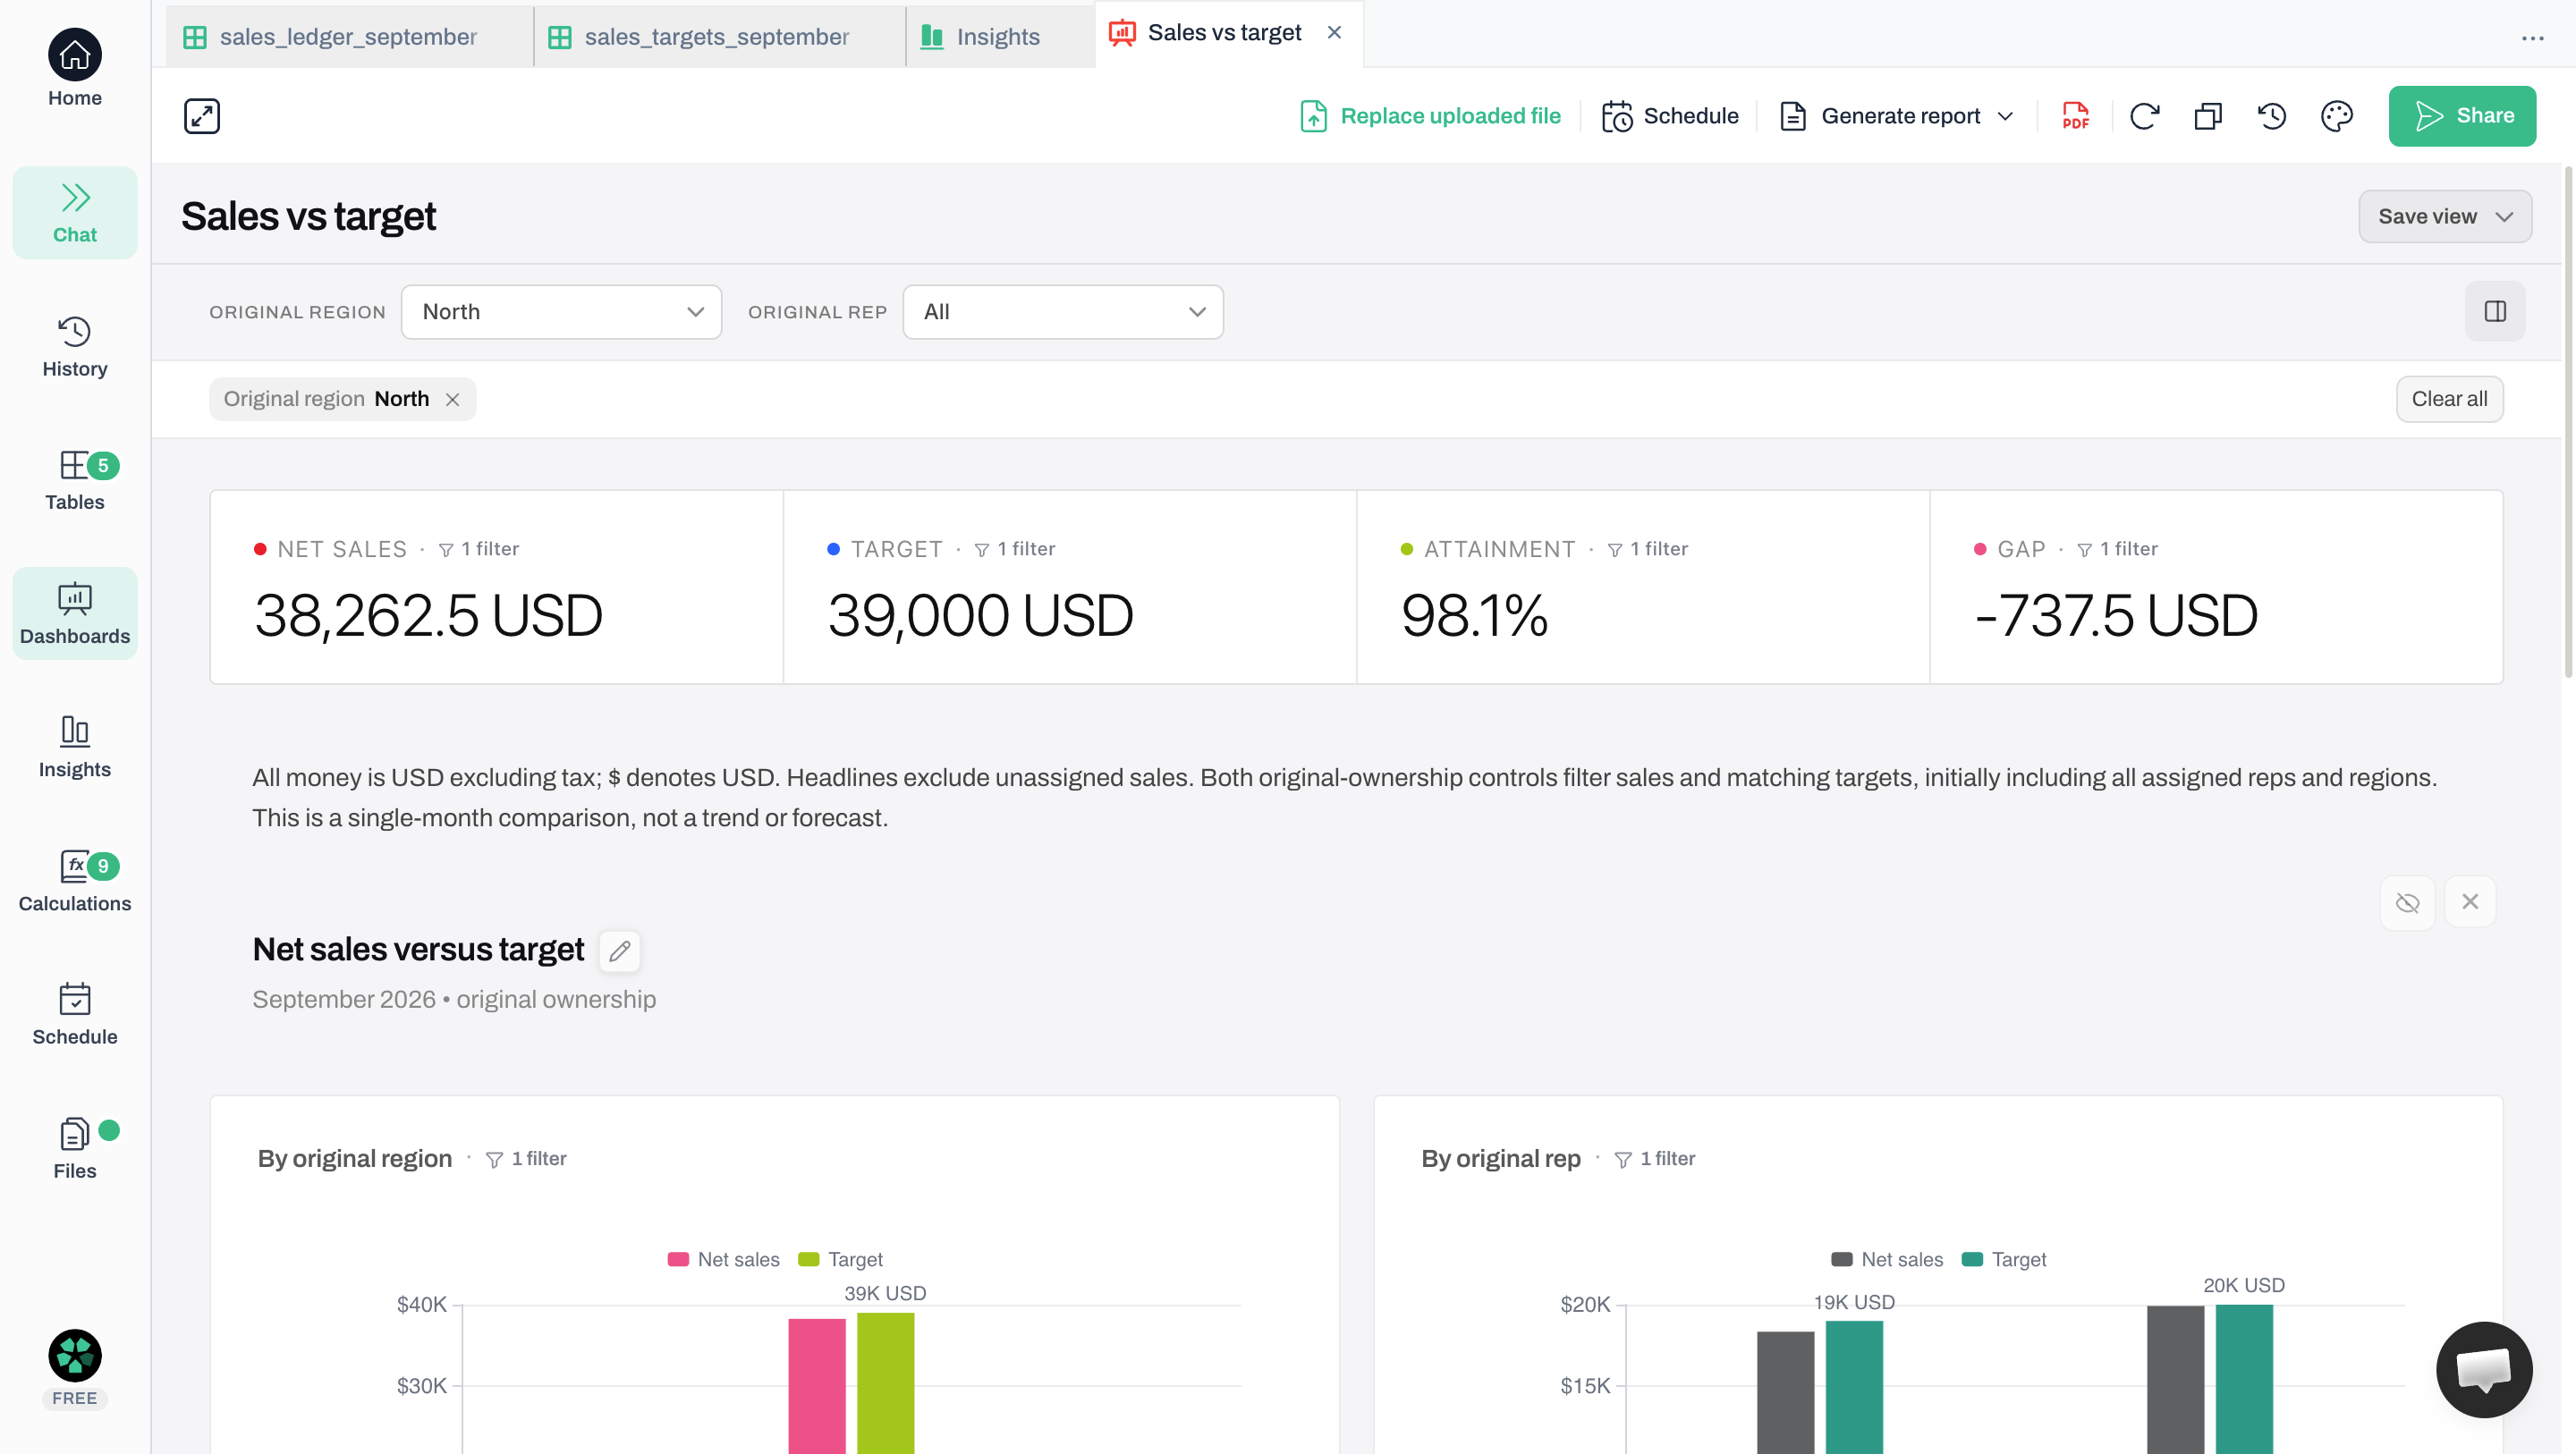
Set Original region to North, leaving Original rep on All. In our checked dashboard, both sides changed: $38,262.50 in sales against North’s $39,000 target, not the whole team’s goal.
Select North: its target falls to $39,000 too
The North selection includes R01 and R02. Sales and the target change together; the result is a $737.50 shortfall, not a comparison against the whole team’s goal. Click to enlarge.
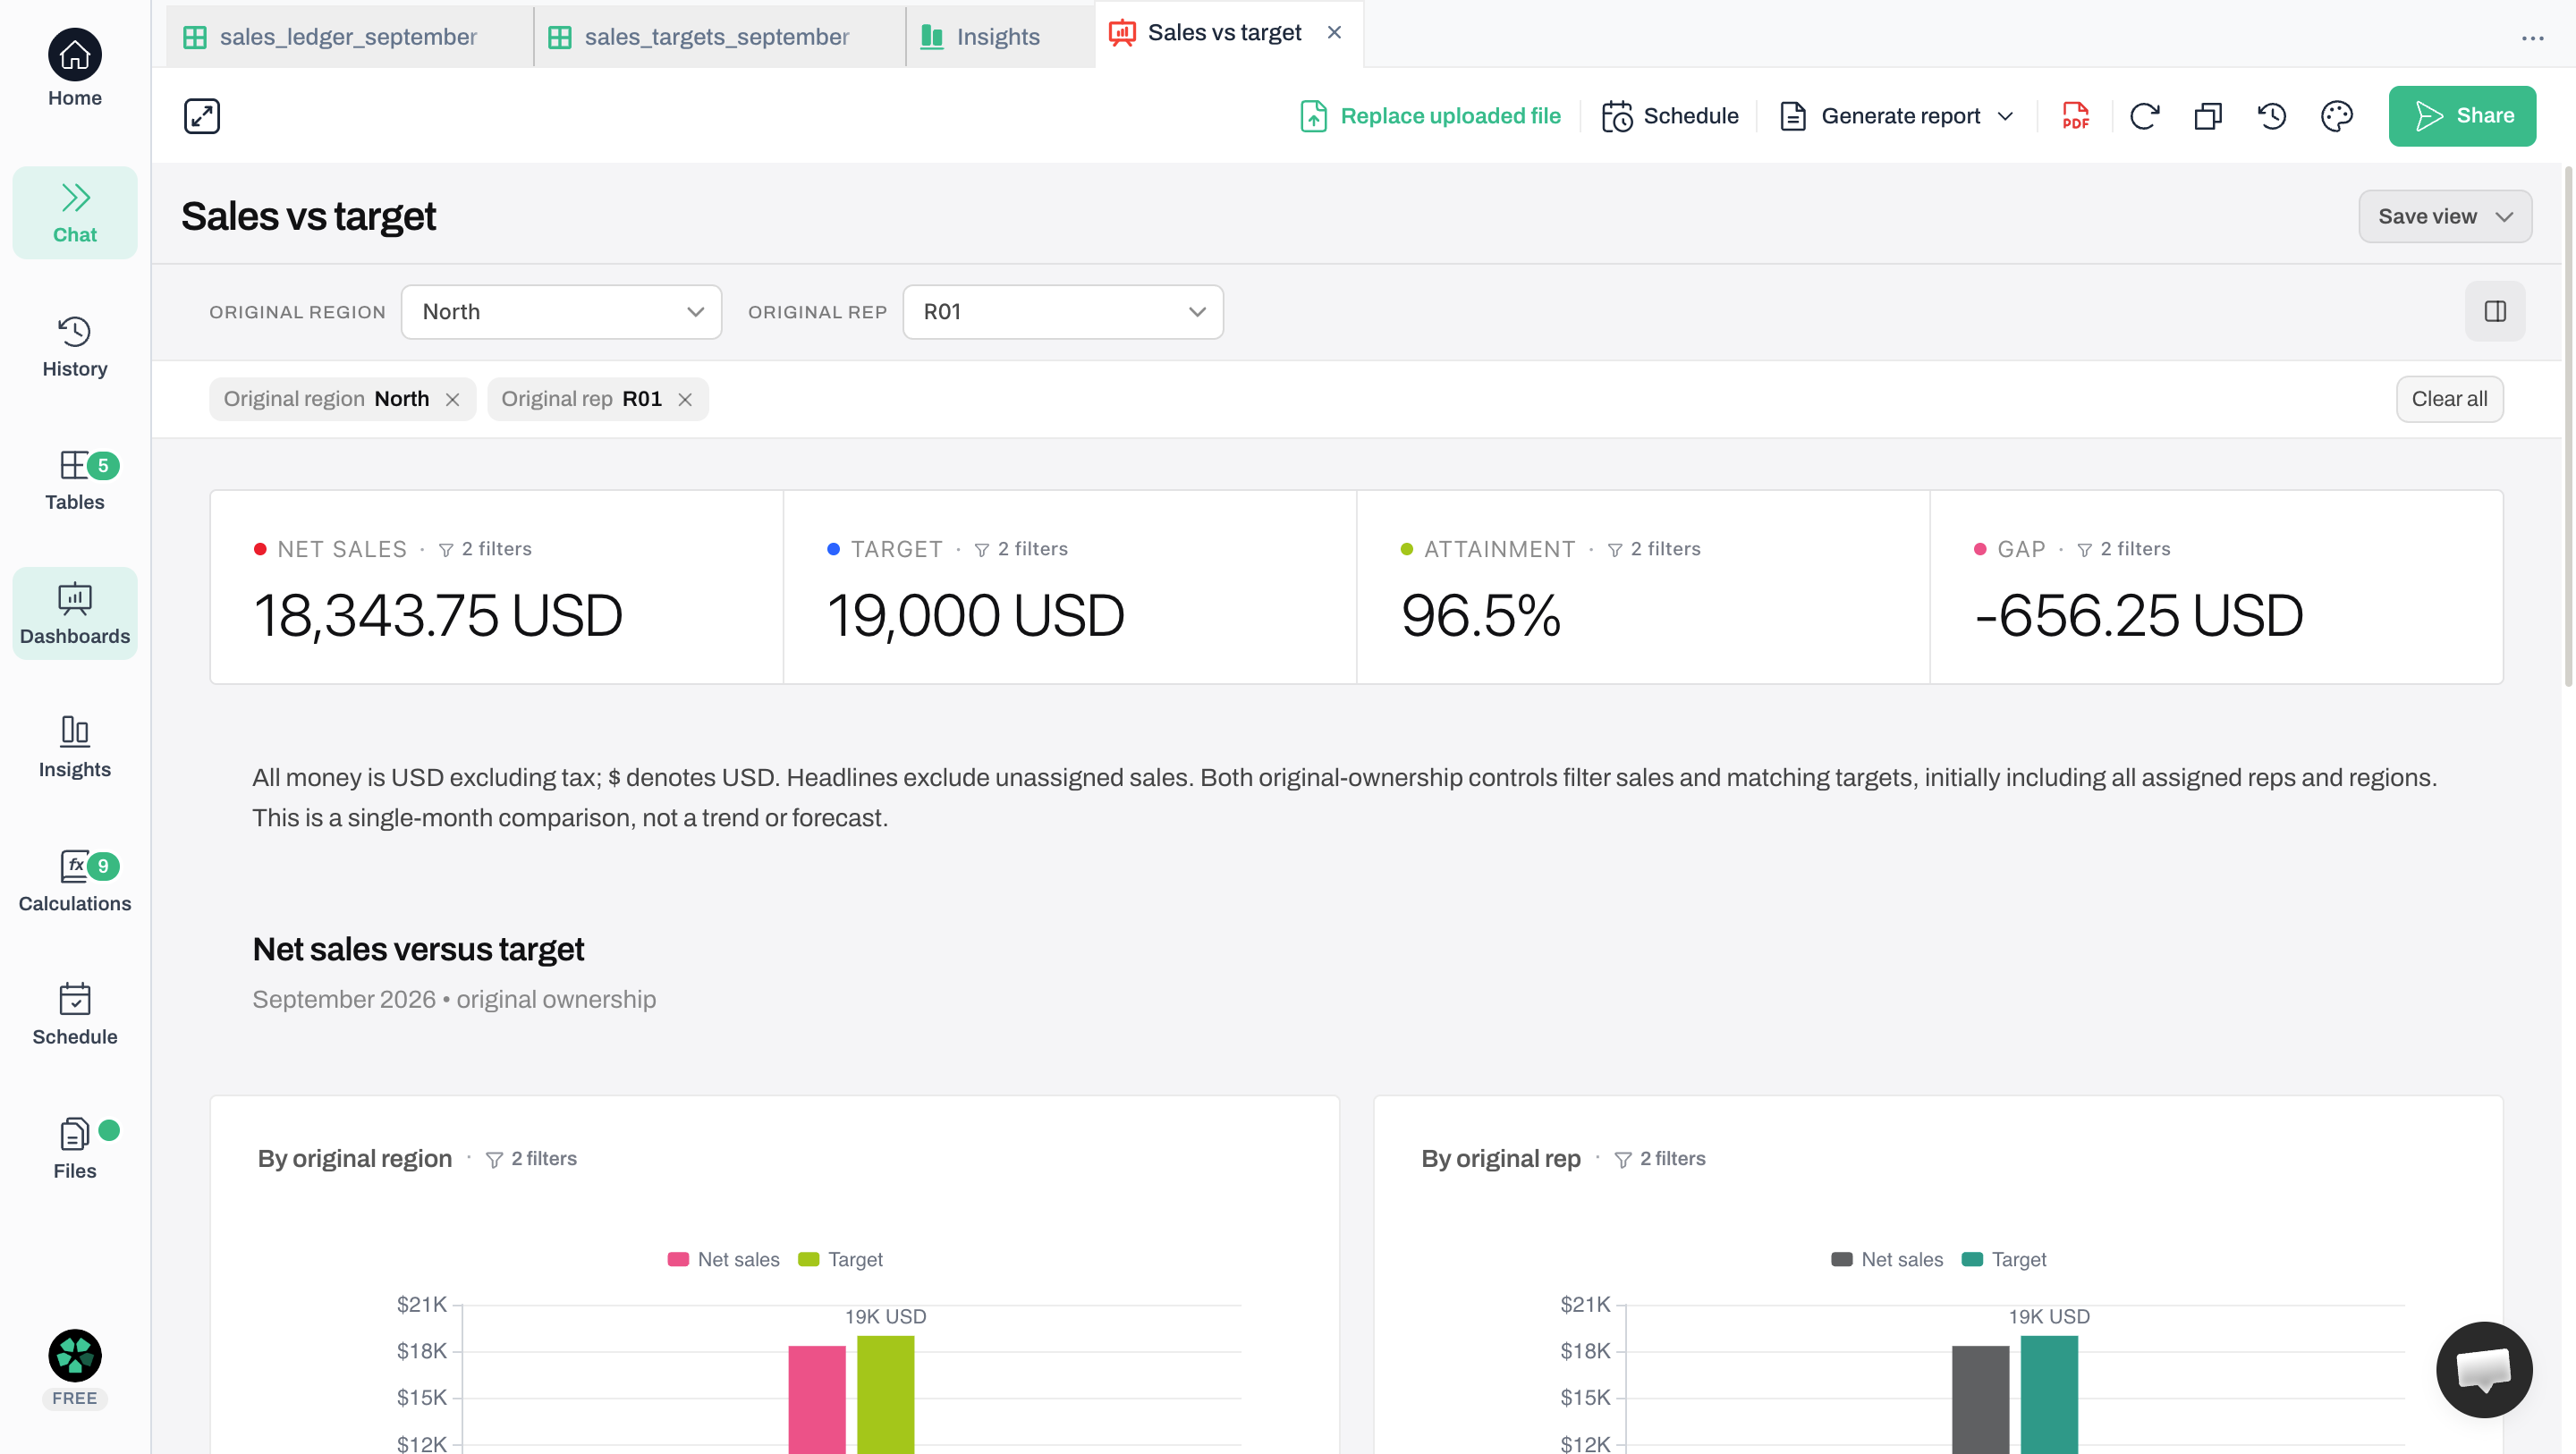
Keep North selected and set Original rep to R01, which turns the view into a sales rep dashboard for one person. This rep’s September sales of $18,855 minus $511.25 in credits give $18,343.75. Against the $19,000 target, the gap is −$656.25. These cover the whole month, unlike the two selected entries shown earlier.
Then select R01 to narrow the investigation
North remains selected while R01 narrows the view to one rep. The $656.25 gap matches that rep’s checked September records; the percentage is rounded on screen. Click to enlarge.
Clearing the filters restored the team totals. Check this in your own dashboard too: a correct chat answer does not prove the controls work. Keep unassigned sales separate; selecting North must not assign the $1,500 sale to it.
05Investigate a shortfall before drawing conclusions
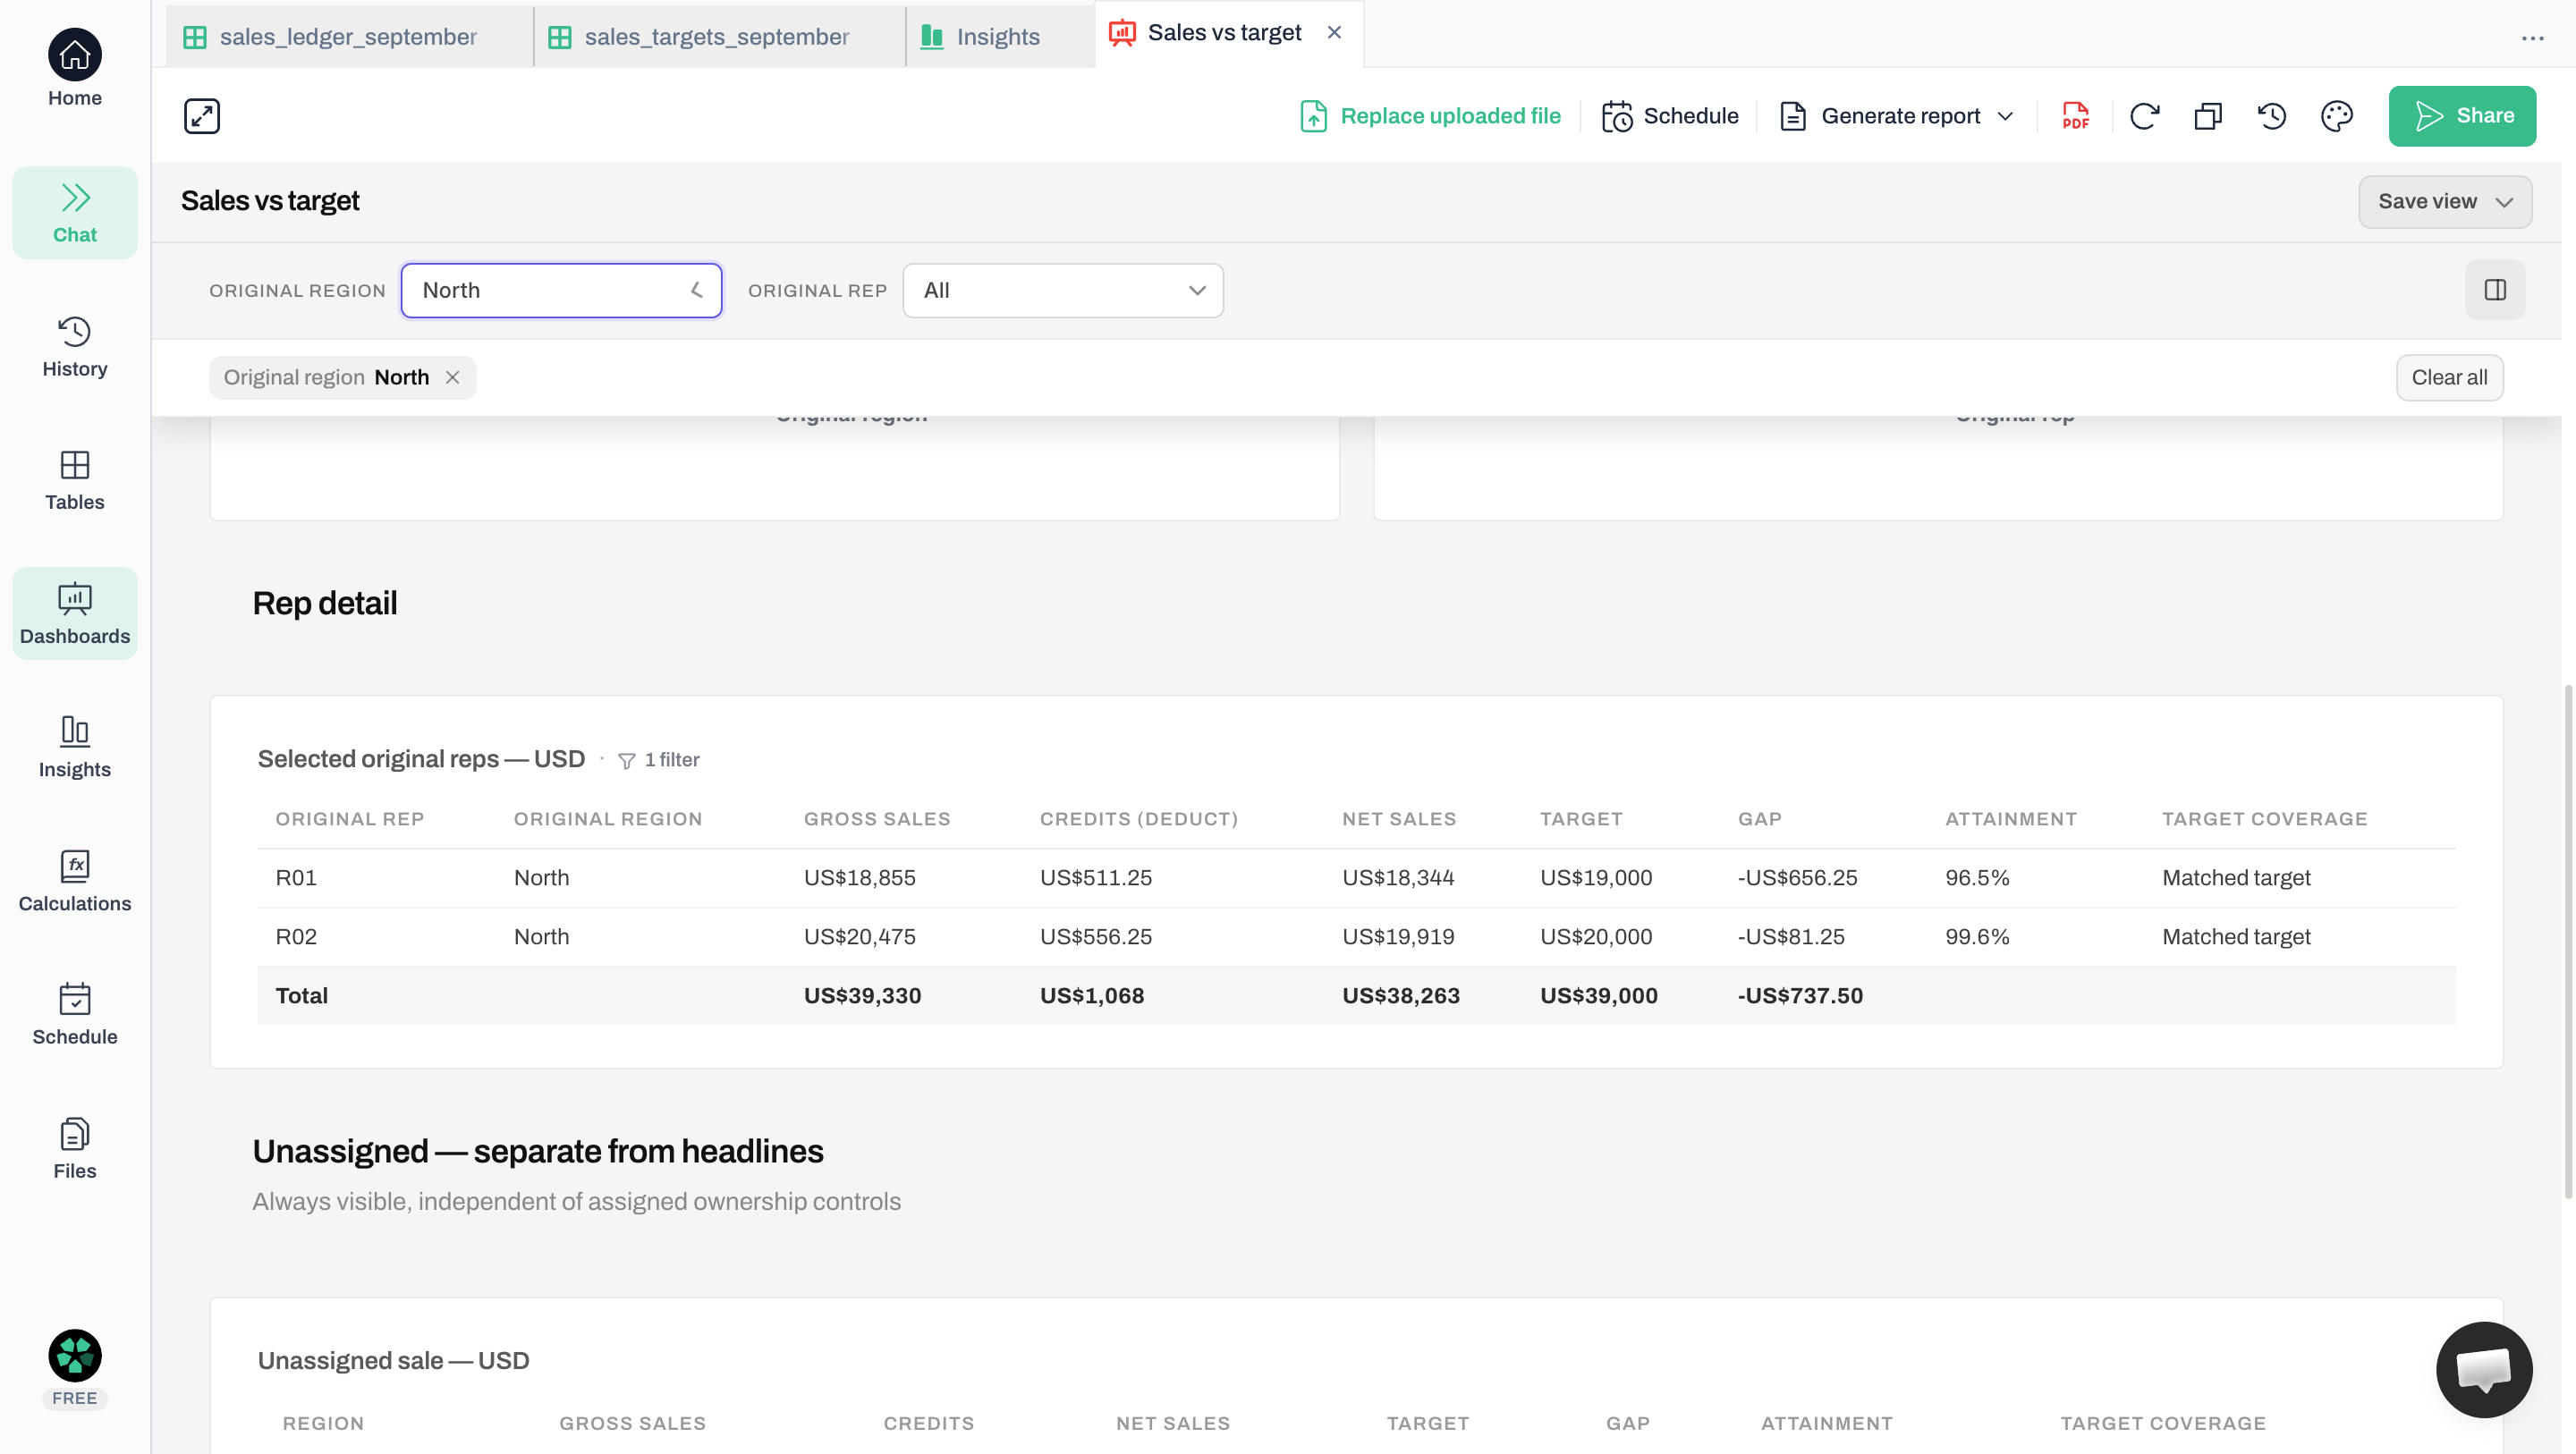
R01’s $656.25 shortfall and R02’s $81.25 shortfall explain North’s $737.50 gap. Start with R01’s records because that is the larger difference—not because the dashboard proves the rep performed poorly.
Find which rep contributes to the regional shortfall
The two gaps add to North’s $737.50 shortfall. Net-sales totals are rounded on screen; the gaps retain cents. This identifies where to investigate, not why sales fell short. Click to enlarge.
Check dates, duplicates and ownership before discussing demand or execution. A credit reduces sales here, but does not reveal why the customer received it. West’s larger total likewise says nothing about effort: these files do not describe territory potential or workload.
A credit counts in its posting month even if the sale happened earlier. An order-date report may therefore disagree without either calculation being wrong. Resolve which event the review should measure before changing dates.
06Repeat the sales report without changing its meaning
Keep the date rule, original ownership, credit treatment, currency and target selection unchanged next month. Otherwise, a new calculation can look like a change in sales.
Distinguish a correction from new business
Suppose an existing September sale for South-region rep R03 increases by $1,200, with everything else unchanged. Team sales become $192,050, the gap becomes +$12,050, and attainment becomes 106.69%. This corrects September; it is not a new October sale.
We tested this correction in the same Anomaly dashboard. After choosing Replace uploaded file and replacing only the September ledger, its cards changed to $192,050 in sales and a +$12,050 gap; the target stayed $180,000. The screen rounded attainment to 106.7%. This was a manual file replacement, not a scheduled refresh or sharing test.
Correct the source and check the updated dashboard
After the correction: sales rise from $190,850 to $192,050; the target stays $180,000. The overview in section 1 shows the earlier result. Click to enlarge.
Replace the original file rather than adding the corrected version as extra sales. Confirm that the changed record appears once and that targets have not changed.
Label an unfinished month honestly
October’s sales stop on 12 October. Comparison with a full-month target shows progress, not a forecast. Only reduce the target in proportion to elapsed days if the business has agreed that approach.
October also has one missing rep target and one zero target, so an overall percentage would not be a complete team comparison. Our verified product views use September, not this partial-month workflow.
For recurring reports, check how new data reaches the dashboard and confirm its latest date. Our refreshable monthly dashboard guide covers that separate setup; saving a dashboard does not prove it has refreshed.
Optional: try the example yourself
Choose the files for the exercise you want to try. Downloads are optional; the explanation above stands on its own.
In Anomaly AI, ask for checks before charts. This optional prompt is a writing example, not a verbatim test transcript:
Optional prompt: compare sales with the right targets
Inspect the original sales ledger and monthly targets. For September 2026, use posting dates and original rep ownership. Add sales and subtract credits, excluding tax. Count exact duplicate events once, flag conflicting duplicates, and keep unassigned sales separate.
Add up sales by rep and month before matching each monthly target once. Show net sales, target, attainment and gap for the team, each region and each rep. Explain the calculation and flag missing or zero targets before building any charts.
Compare the answer with the worked tables, then try the North and R01 selections. Both sales and targets should change together.
07Before sharing your sales report
Walk through these checks as if you were the person receiving the report. They should be able to understand the comparison and verify the result without asking how you built it.
Make the scope clear. Show the period, currency and included team.
Check that totals add up. Regions and reps must add back to the team; count each target once.
Try a smaller selection. Compare a region and rep with their source records and targets.
Explain exceptions. Show unassigned sales, missing or zero targets and incomplete periods.
Check what the recipient sees. Verify dates, filters and permissions. A download may not preserve interactive controls.
08Common questions
Why does my CRM sales report differ from my revenue dashboard?
Check what each report counts before looking for an error. A CRM report may count deals when they become closed-won, while your sales ledger records invoices and credits on their posting dates. Compare the same deal or invoice IDs, dates and amounts. Choose the event that matches your target definition; do not force unlike reports to agree.
What if two sales reps share credit for one sale?
Agree the credit split before reporting and store it against the sale. Allocated amounts must add back to the original amount, with no sale counted in full for both people. Apply the same ownership rule to credits and targets. The downloadable example uses one original rep per event; it does not demonstrate split-credit handling.
Can I compare monthly sales with a quarterly target?
Not as a like-for-like monthly attainment figure. Either report quarter-to-date sales against a clearly labelled full-quarter target, or obtain agreed monthly targets. Dividing a quarterly target by three assumes an even sales pattern. If the business has not approved that assumption, show the figures separately instead of presenting an invented monthly target.
How should I share a sales report without exposing individual performance?
Choose the audience before exporting or sharing. A wider business update may need regional totals rather than named-rep results or invoice details. Check the actual recipient view, remove information that audience should not see, and retain the reporting period and definitions. A hidden column or an on-screen filter is not proof that access is restricted.
About this example. Anomaly AI is our product. The figures are synthetic and were checked against an independent calculation on 15 October 2026. Scheduled delivery and recipient sharing were not tested.
Turn the finding into your next sales review
The team beat September’s target, but North fell short and R01 accounted for most of the gap. You now know where to investigate—not why it happened. Ask the regional manager to review the sales and credits, explain any remaining difference and agree the next action.
To try this in Anomaly AI, start with the September sample or sales records you are permitted to upload and a separate monthly target sheet. State the period and sales definition, check the team total, then select one region and rep to confirm their targets change too.
If you are still choosing software rather than checking a report, our sales analytics tools guide addresses that different decision.