Tools & Comparisons
12 min
Best Tableau Alternatives for Small Teams in 2026
Leaving Tableau as a small team? Match the replacement to which part of Tableau you keep and which cost, setup, or specialist burden you are trying to shed.
Read More
Tools & Comparisons — Tested comparison · 2026
 Updated 15 min read
A finance or operations workbook may hold several sheets that must agree. We tested nine AI tools to see which could read them, check totals and return a useful file.
Quick answer. In our test, ChatGPT returned an editable Excel workbook; Claude returned a portable report; Anomaly AI kept the analysis in a reusable workspace. Seven tools got the core totals right. Anomaly AI is our product.
We checked workbook reading, accuracy, evidence, returned files and cost.
Read all six sheets and combine them without double-counting.
Match totals, rates and monthly figures to our answer key.
Show calculations another person can inspect and repeat.
Return a useful chart, summary and file.
Record the tested plan and upgrade price.
Scroll sideways to compare every check.
| Tool | Plan and price checked 10 Oct 2026 | Total and best for | Prompts completed correctly | Reads the whole workbook | Right numbers | Shows its work | What you get back |
|---|---|---|---|---|---|---|---|
| Anomaly AI (our product) | 5/5Free; Pro US$25/mo | 25/25 provisionalA checked analysis you keep working on | 4 of 4 | 5/5 | 5/5 | 5/5 | 5/5Saved charts and findings; CSV |
| Better Analyst | 4/5Free; Starter US$20/mo (US$14/mo billed yearly) | 21/25 provisional · our sumTrying it on a free plan | 4 of 4 | 5/5 | 5/5 | 3/5 | 4/5Chart saved as SVG and CSV |
| ChatGPT | 4/5Free; Plus US$20/mo | 23/25 provisionalAn Excel file back | 4 of 4 | 5/5 | 4/5 | 5/5 | 5/5.xlsx with a live formula and a chart |
| Claude | 5/5Free; Pro US$20/mo | 25/25 provisionalA one-off report you can send | 4 of 4 | 5/5 | 5/5 | 5/5 | 5/5Standalone HTML report |
| Deepnote | 4/5Free; Team US$49 per editor/mo | 24/25 provisionalCode you keep editing | 4 of 4 | 5/5 | 5/5 | 5/5 | 5/5Notebook, CSV and PNG |
| Julius AI | 4/5Free; Plus US$20/mo | 23/25 provisionalA quick chart and a PDF | 4 of 4 | 5/5 | 5/5 | 4/5 | 5/5Two-page PDF |
| Google Gemini | 4/5Plan not shown; Google AI Pro US$19.99/mo or US$199.99/yr | 20/25 provisionalGoogle users who can retry a step | 3 of 4 | 4/5 | 4/5 | 4/5 | 4/5Right chat chart; .xlsx with a broken chart preview |
| Amazon Quick | Not assessedFree; Plus US$25/user/mo (US$20 billed yearly) | Unscored · input incompleteNot this job, in our test | 0 of 4 | Not assessed | Not assessed | Not assessed | Not assessedPartial input; query templates only |
| Hex | Not assessedFree; Professional US$36/editor/mo | Unscored · input incompleteAnalysis not assessed | Intake blocked | Not assessed | Not assessed | Not assessed | Not assessedNone |
For both upload tools and tools that work inside Excel, see our guide to Excel AI tools and add-ins.
The file. A 2.17 MB workbook from AdventureWorks sample data: sales (56,046 rows), returns (1,809), products, subcategories, categories and regions. We kept all six sheets together. No customer data was used; derived files are not public downloads.
The prompts. Eight tools received four fixed prompts. Hex failed on the first and received no further prompts. In brief:
The answer key. We worked out the right answers before any tool ran:
The file has no sale price, so any revenue figure would be wrong.
Scores. Five 0–5 ratings sum to 25. They are provisional tester judgments, not independent ratings. Better Analyst’s 21 is the sum of its recorded ratings. Hex and Quick are unscored; their earlier ratings remain in the historical records.
Conditions. Runs used normal web apps on 7–8 October. Five tools used Free; Deepnote used Team; Amazon Quick and Hex used trials; Gemini’s plan was not shown. Deepnote, Gemini, Quick and Hex were retried once the next day with the same workbook and script; both attempts are documented.
Testers. Claude-based AI agents operated the workbook runs; GPT operated Better Analyst. The 8 October testers knew earlier answer values; 7 October exposure is unrecorded. Prompts contained no answers. AI agents drafted this comparison; Ash Rai is its editorial byline.
Evidence. Our test evidence connects the fixed prompts, answer key and per-tool outputs, including retries and failures. Those combined details were absent from all eight comparison pages reviewed on 9 October. The same disclosed runs support our broader analysis comparison; this article focuses on uploaded workbooks.
Disclosure: Anomaly AI is our product, and we scored it on the same five checks as every other tool. Claude matched its total, and ChatGPT was the tool that handed back an Excel workbook with a live formula.
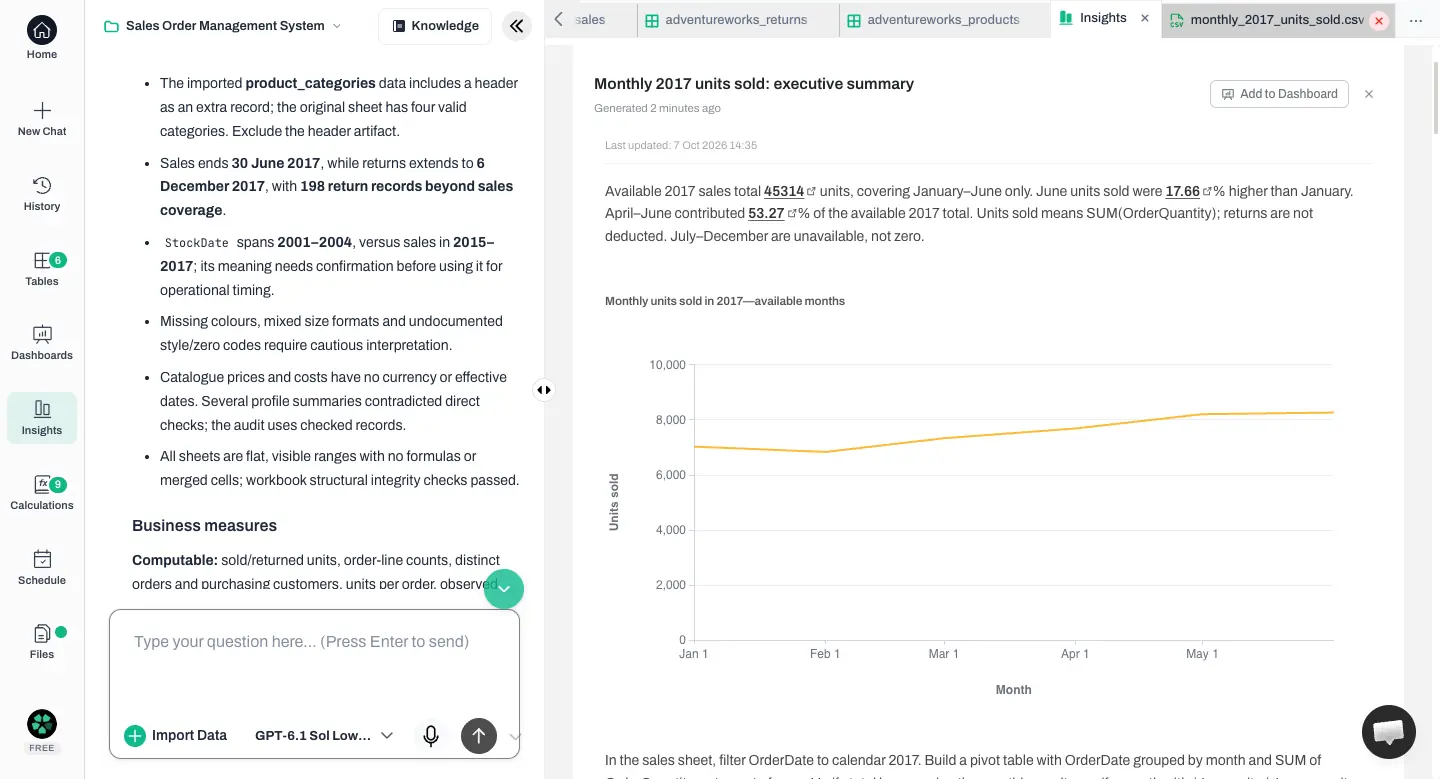
Anomaly AI matched every value in the answer key in our test and scored 25/25 on the Free-plan account we used. It read all six sheets, flagged that the returns sheet runs to December 2017 while sales stop in June, and kept the Components category even though it had no sales. Saved workbook evidence
Its tables, charts and findings stayed in one project. SQL queries and Python code—the calculation instructions—let another analyst check the results. Monthly figures exported as CSV. Anomaly correctly refused to use a catalog price as revenue.
Anomaly is an analysis workspace, not an editor for your open spreadsheet. Excel-report generation was outside this test. See Anomaly’s Excel workflow.
Anomaly AI read all six sheets and kept the findings beside the data
Price (checked 10 Oct 2026, pricing page): Free; Pro US$25 a month, or US$20 a month billed yearly; Analyst US$90 a month; Team US$45 per seat a month, two-seat minimum. Best for: a checked analysis you keep working on.
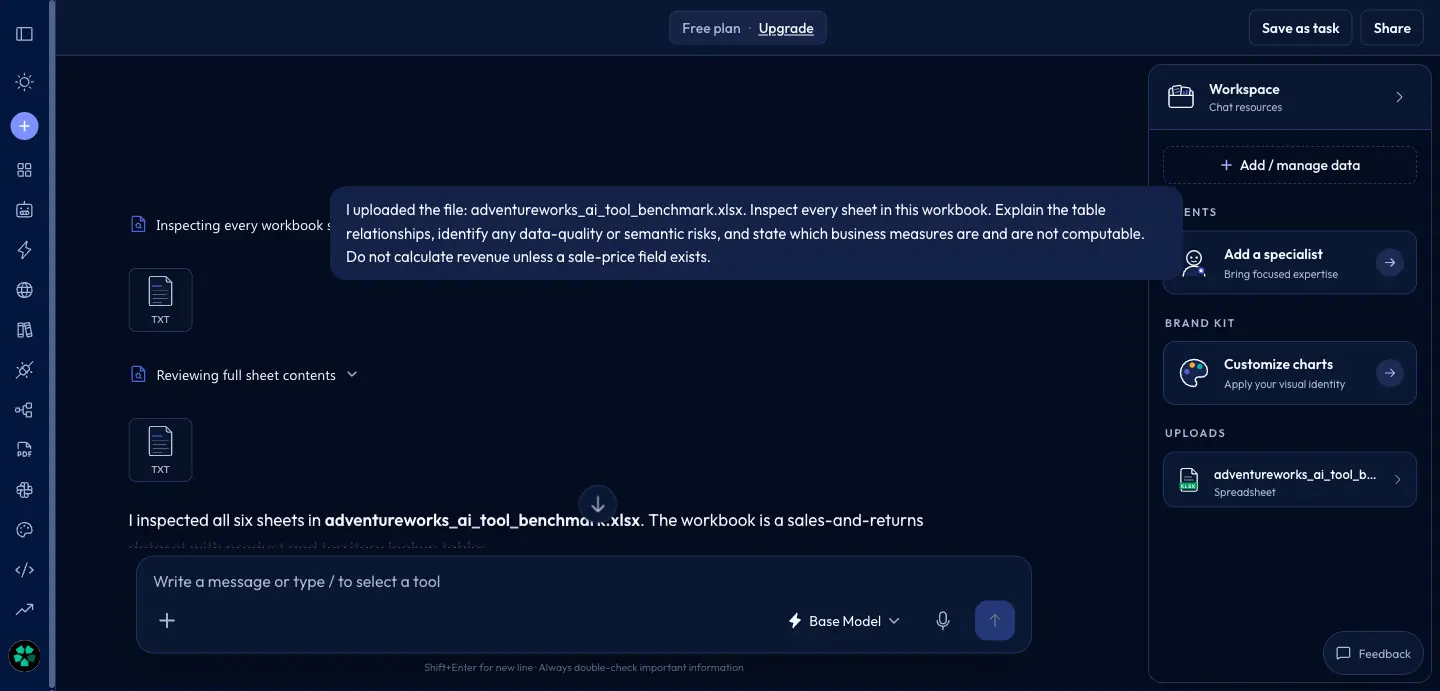
Better Analyst, formerly Formula Bot, read all six sheets on Free with its Base Model in our test. It returned the requested values correctly. Its provisional 21/25 sums ratings of 5, 5, 3, 4 and 4. A separate agent recomputed 26 numeric checks and six monthly values; all matched, but the ratings were not independently reviewed. Saved workbook evidence
It explained how sheets connect, rejected unsupported revenue and recovered from an internal error without our help. The chart menu offered PNG, SVG, CSV and Excel; we saved SVG and CSV.
It described its steps without retaining all rerunnable code, hence 3/5 for transparency. Free began with ten messages and 25 AI actions, which limits longer sessions.
Better Analyst confirms it inspected all six sheets
Price (checked 10 Oct 2026, pricing documentation): Free; Starter US$20 a month, or US$14 a month billed yearly; Max US$40 per seat a month, or US$28 billed yearly; Business US$80 per seat a month, or US$56 billed yearly. Best for: trying it on a free plan.
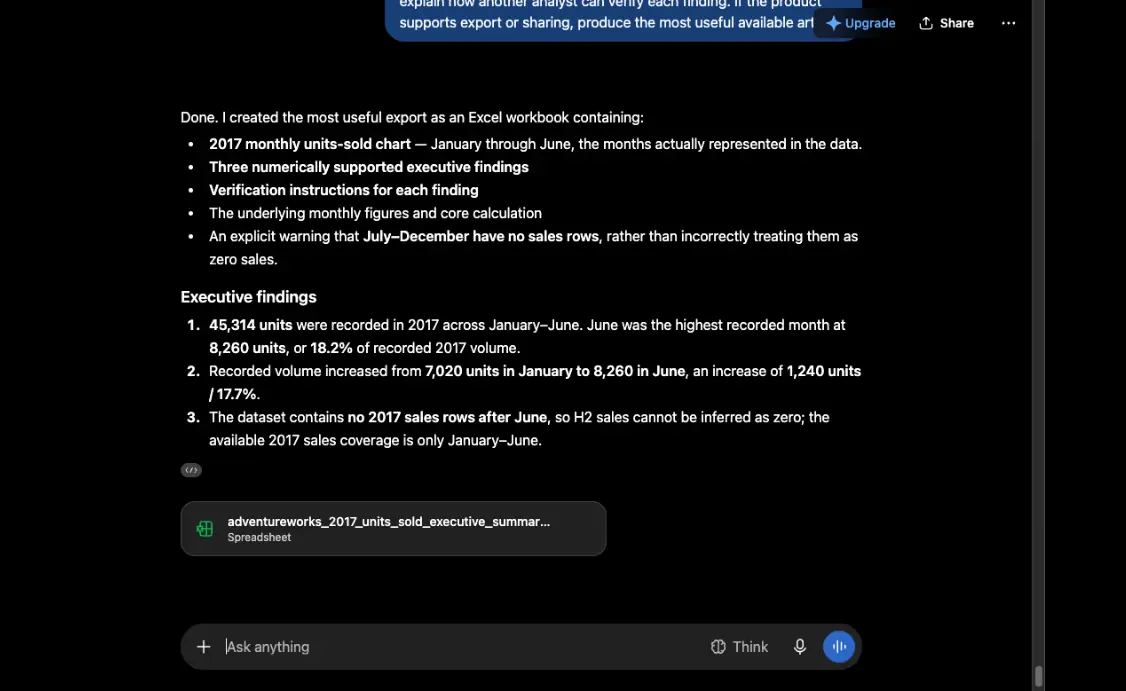
ChatGPT handed back a two-sheet Excel workbook in our test and scored 23/25 on its Free plan, with every core value right. The file held the monthly figures, a chart and a live SUM formula. We opened the saved file to confirm it. Saved workbook evidence
It lost a point on Right numbers. In the first prompt it gave the wrong date range for a side field, StockDate, saying 2002–2003 when the sheet runs from September 2001 to June 2004. In a separate repeat of the first prompt, the reply stopped after “I inspected all”, a reminder to read answers in full. It also scored 4 on Free plan and price.
ChatGPT’s final answer with the Excel workbook it created
Price (checked 10 Oct 2026, OpenAI help page): Free; Plus US$20 a month. Best for: getting an Excel file back.
Claude matched every value in the answer key and scored 25/25 on its Free plan in our test. It treated sales and returns as separate tables, explained why revenue could not be calculated, and showed SQL queries—the instructions selecting and combining rows—to check each finding. Saved workbook evidence
Its standout was the file it handed back: a standalone HTML report of about 6 KB. It holds the monthly chart, three numbered findings, a “How to verify” section with SQL, and short caveats. It opens in any browser or as an email attachment. Public share links were not available on the free account, so the export was the way to pass the work on. The report is a snapshot: next month you upload the new file and ask again.
Claude’s completed answer with the exported report open
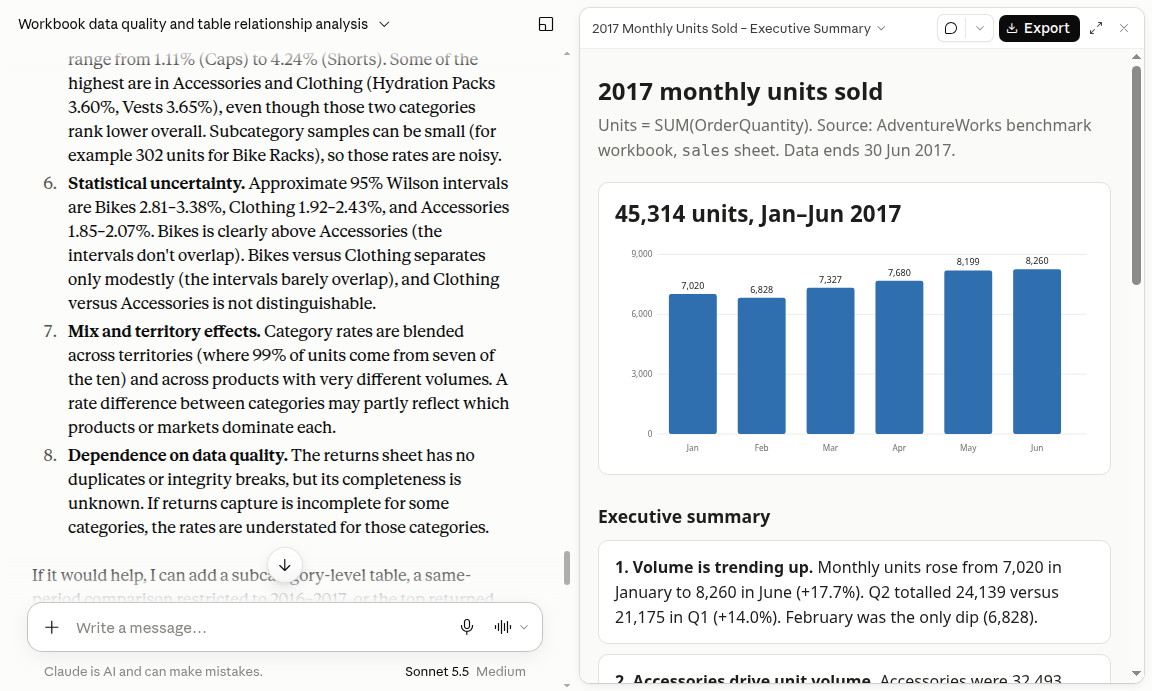
Price (checked 10 Oct 2026, pricing page): Free; Pro US$20 a month, or US$200 upfront yearly (about US$17 monthly); Max from US$100 a month. Best for: a one-off report you can send.
Deepnote returned every requested value correctly on its second attempt in our test and scored 24/25. Its notebook—a document containing code and results—used the pandas data library to load each sheet by name, making the source of each number visible. Saved workbook evidence
The first attempt, on 7 October, never started: the upload control picked the file, but it never became a project file, and the AI agent said it had no workbook. On 8 October we added the file through the Files sidebar and the run completed. The notebook then held the code, checks, a summary, the chart, and CSV and PNG exports, all editable.
Deepnote suits analysts who want editable code. It used Team, not Free. The current pricing comparison lists five Agent calls monthly on Free; the plan card describes these as “Limited Deepnote AI”.
Deepnote’s notebook loads every sheet of the workbook by name
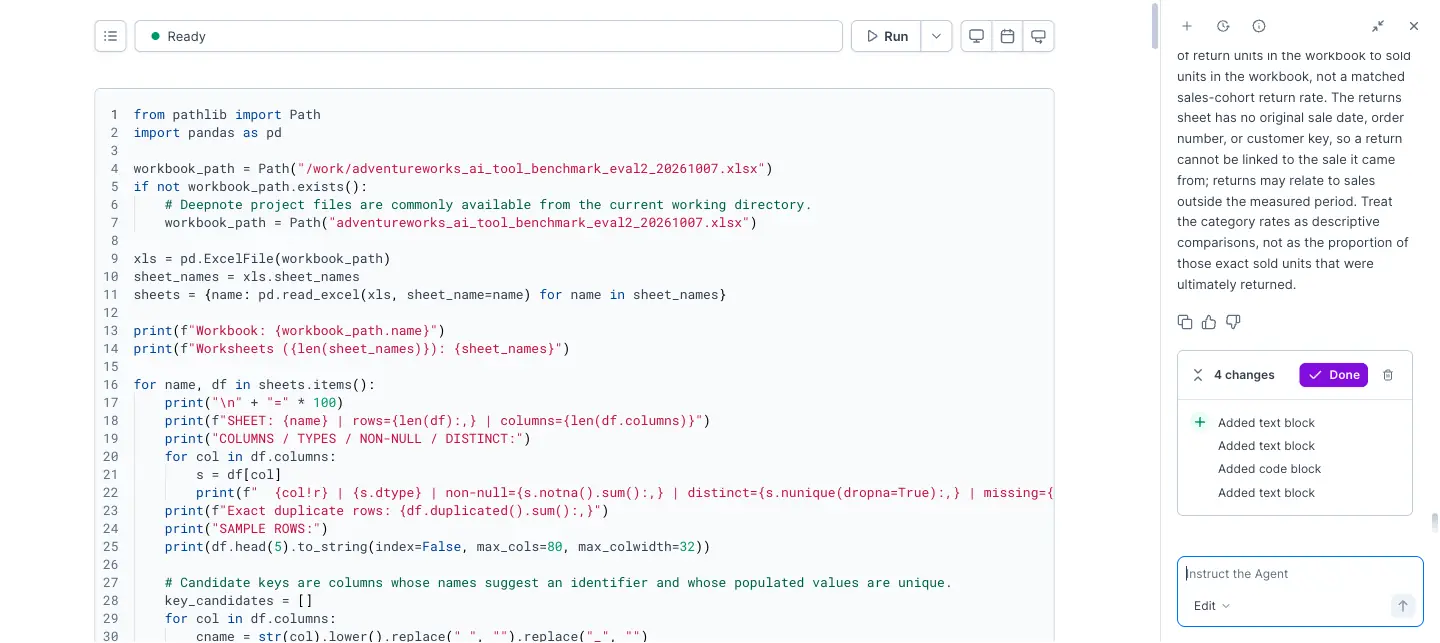
Price (checked 10 Oct 2026, pricing page): Free with five Agent calls monthly in the detailed pricing comparison; Team US$49 per editor or admin a month, or US$39 billed yearly, with a 14-day Team trial. Best for: code you keep editing.
Julius AI matched every value in the answer key and scored 23/25 on its Free plan in our test. It handled the six sheets safely, explained the limits of the return-rate measure, and exported a clean two-page PDF with the monthly chart. Saved workbook evidence
It lost a point on Shows its work. One line of the Python it displayed, float(""), raises an error if you run it, so the method can be followed but not rerun unchanged. It lost another on Free plan and price, because the four prompts used the account’s whole 25-credit free allowance. For repeated work, budget for a paid plan.
Julius AI’s completed result with its generated files and workbook open
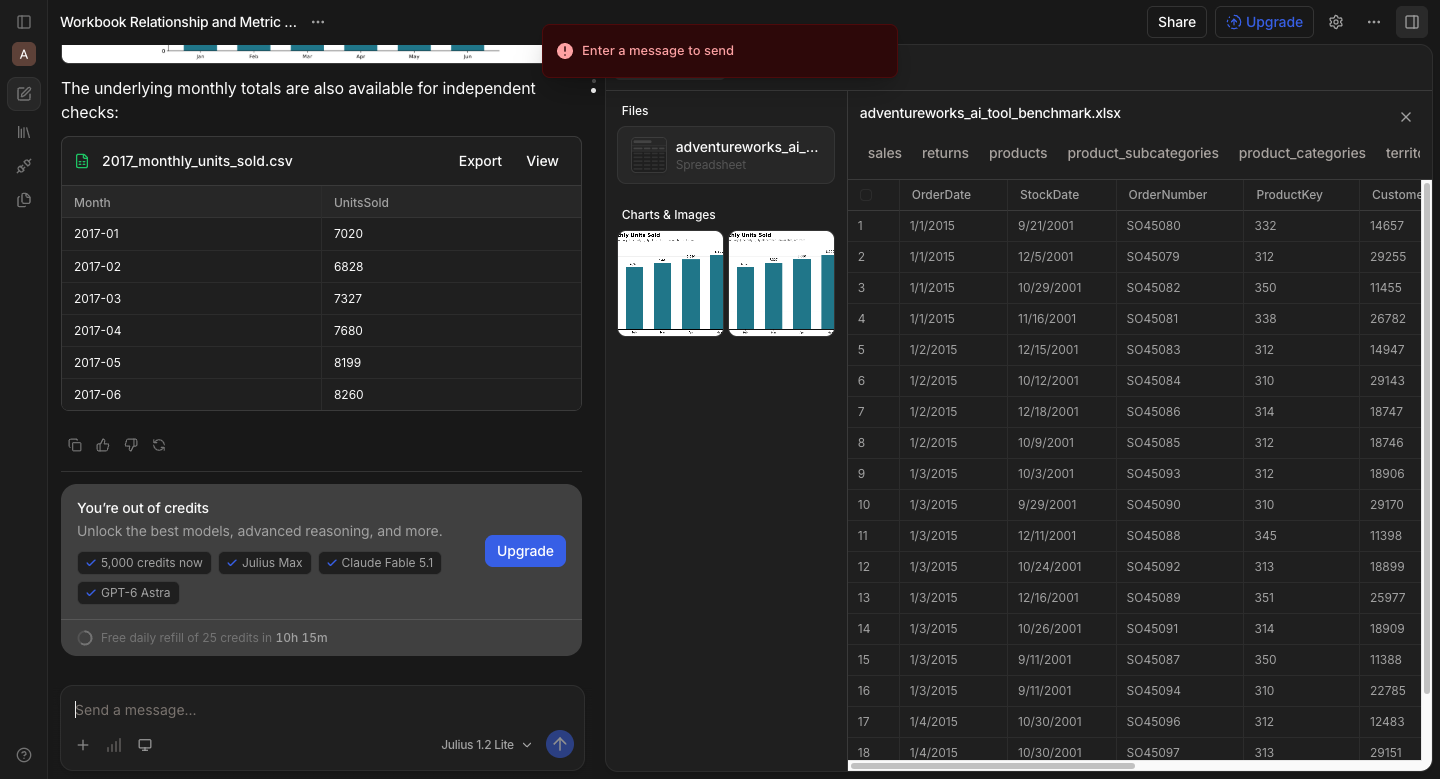
Price (checked 10 Oct 2026, pricing page): Free; Plus US$20 a month and Pro US$45 a month billed monthly, or US$16 and US$37 billed yearly. Best for: a quick chart and a PDF.
Google Gemini scored 20/25 on its second attempt in our test. Three of its four answers were complete with the requested numbers right; the first ended with “I encountered an error doing what you asked. Could you try again?” Saved workbook evidence
Behind its “Show code” panel, Gemini had read all six sheets before that error, but we score the answer, not hidden work. One finding also made a financial-impact claim the data could not support. Its chat chart was right. It also generated an Excel file with the correct monthly table, typed in as values rather than formulas, and the chart in the file preview was broken. Its 7 October attempt went the other way: a good inspection, then three failed prompts.
The Excel file Gemini generated, opened in its viewer
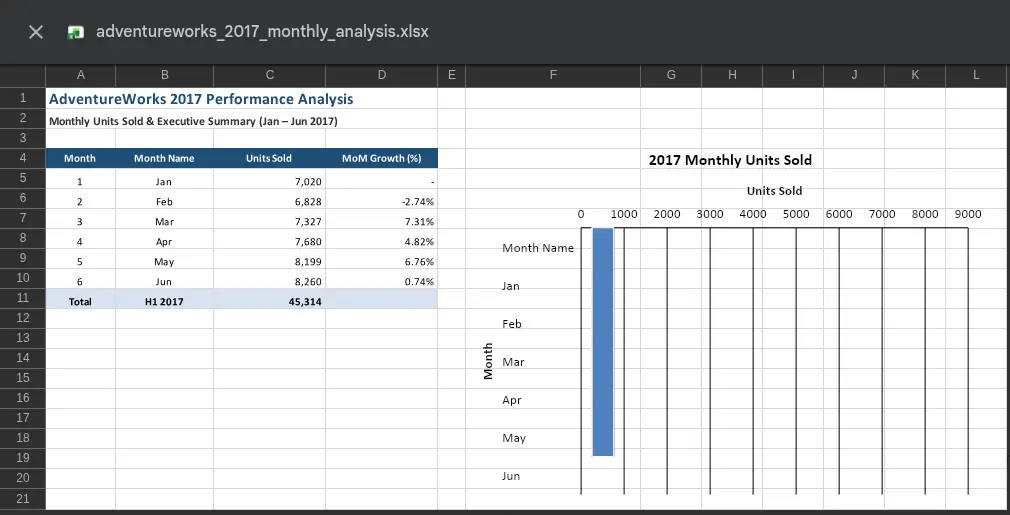
Price (checked 10 Oct 2026, Google AI plans): the plan we used was not shown; Google AI Pro is US$19.99 a month or US$199.99 a year in the United States. Best for: Google users who can retry a step.
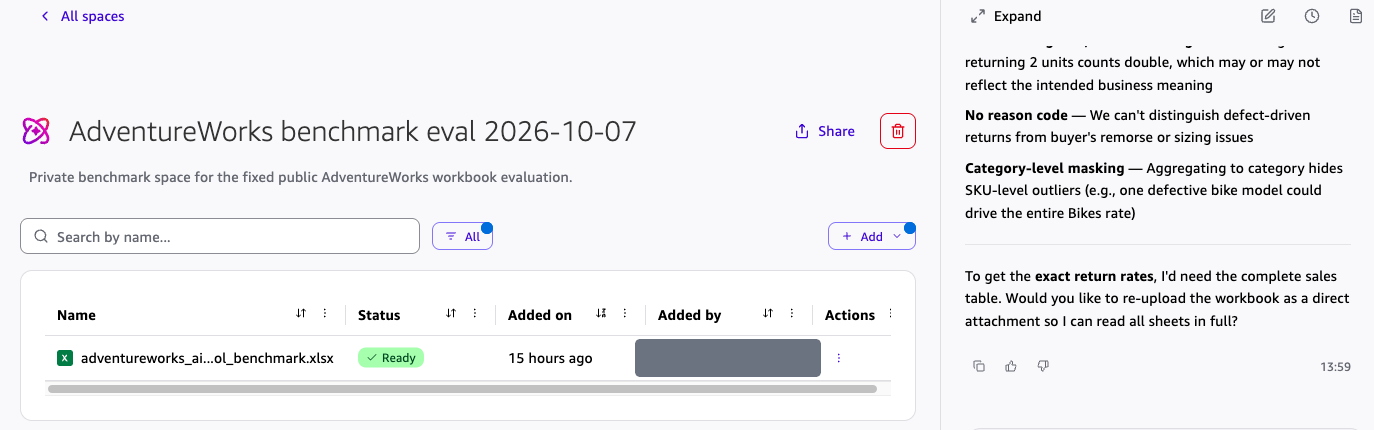
Amazon Quick returned replies to all four prompts in our test but lacked the complete tables. It produced no correct requested totals. We retain the observed replies, but do not use this incomplete-data run to rank analytical capability. Saved workbook evidence
On 7 October, Quick’s chat rejected the file: “This file exceeds the 665,000 character count limit. Try uploading it to a Space.” We added it to a private Space. When we returned about 15 hours later, the Space showed the file as Ready, and we ran the prompts again. Quick could search passages of the workbook but said it had only a partial sample. It asked us to re-upload the file so it could read all sheets, treated a catalog price as a sale price, and drew a chart with every month at zero.
Quick offered query templates, but the partial input makes its analytical score unassessable. We therefore show it as unscored, with the access problem recorded separately.
Amazon Quick shows the Ready workbook beside its partial answer
Price (checked 10 Oct 2026, pricing page): Free; Plus US$25 per user a month, or US$20 billed yearly; Max US$125 per user a month, or US$100 billed yearly. AWS offers an Enterprise trial; its billing conditions differ from the Free plan. Best for: not this job, in our test.
Hex could not start analysis in our six-sheet-workbook test. An attachment appeared, but sending the first prompt produced an error. It never read a sheet or answered a question, so it is unscored rather than assigned analytical zeros. Saved workbook evidence
The failure occurred on 7 and 8 October; Prompts 2–4 were not sent. Hex succeeded with different, smaller May, June and messy-data XLSX files and a large CSV in a separate run. That does not explain this failure or establish a general inability to analyze Excel.
Hex after the first prompt was sent

Price (checked 10 Oct 2026, pricing page): Community free; Professional US$36 per editor a month; Team US$75 per editor a month, with a 14-day Team trial and no card required. Best for: not this job, in our test.
Access barriers excluded these tools; no capability verdict follows:
Copilot in Excel, Claude for Excel and ChatGPT for Excel work inside the workbook rather than on an upload, so they are outside this test. Our Excel AI tools guide includes those alongside upload tools.
A checked analysis you can keep, review and reuse
Anomaly AI: 25/25, with SQL and Python available to verify and reproduce the results.
A one-off report to send to someone
Claude: 25/25, with a portable HTML report.
An Excel workbook back
ChatGPT: a two-sheet .xlsx with a live formula and a chart.
AI help while you work in code
Deepnote: an editable notebook that loads every sheet.
Trying it without paying
Better Analyst or Julius AI: both finished on free plans with small free allowances.
If you plan to share the result as a report, use this source, definition and export checklist to check it before sending.
Want a dashboard from the workbook rather than an analysis? See our guide to AI tools that build dashboards from Excel. Working with CSV exports instead? See AI tools for CSV files.
Keep an untouched original. Use clear sheet and column names, identify which columns connect sheets, and note each date range. Do not flatten a workbook merely to make upload easier: our benchmark deliberately kept the six related sheets together.
This benchmark did not test formula recalculation, macros or external workbook links. The observed totals came from stored tabular data. Recalculate and save your workbook in Excel first, then check any linked values independently rather than assuming an upload refreshes them.
An attachment badge is not proof. Ask it to identify the sheets and row counts before analysis. Hex displayed an attachment but failed to start; Amazon Quick marked its workbook Ready but supplied only partial data to its replies.
We used sample data and did not audit vendor security. Check your organisation’s approval, retention and training terms, sharing settings and deletion process before uploading work data. Remove unnecessary sensitive columns and begin with a non-sensitive sample.
First compare the input file, date range, duplicate handling and formula with a known answer. Keep both the initial result and any correction. A successful retry is useful evidence, but it does not erase the original failure or establish reliability on other workbooks.
We did not establish that. Check whether the barrier is file capacity, credits, unsupported format or failed intake before buying. A higher allowance cannot by itself prove that the same file will be read correctly.
Most AI tools can now open a multi-sheet Excel file: seven of the nine we tested got the totals right. The real differences were in what you get back and how easily you can check it. Before you rely on any of them, note a few totals you already know, upload the same workbook to two tools and compare the answers.
Step-by-step guides for specific Excel jobs:
Technical Product Manager, Data & Engineering
Ash Rai is a Technical Product Manager with 5+ years of experience building AI and data engineering products, cloud and B2B SaaS products at early- and growth-stage startups. She studied Computer Science at IIT Delhi and Computer Science at the Max Planck Institute for Informatics, and has led data, platform and AI initiatives across fintech and developer tooling.
LinkedInContinue exploring AI data analysis with these related insights and guides.
Leaving Tableau as a small team? Match the replacement to which part of Tableau you keep and which cost, setup, or specialist burden you are trying to shed.
There is no single best Looker Studio alternative for GA4 reporting — the right move depends on the limit you have hit. A decision guide by constraint.

If you want answers, dashboards, reports, and alerts without dragging nodes across a workflow canvas, Anomaly AI is built for that.